Purpose
This collection of high-quality short- and long-read, time series sequencing data sets should serve as a valuable community resource for bridging observational and experimental work, for developing metagenomic analysis pipelines, and for understanding cheese rind microbial communities.
- Data from this pub, including raw reads and assemblies, is accessible in the European Nucleotide Archive (ENA). Taxonomic and functional analysis is available on MGnify.
- Step-by-step protocols are available as a collection on protocols.io.
- Code and data tables used to produce visualizations are available in this GitHub repository.
We’ve put this effort on ice! 🧊
#StrategicMisalignment
As we explored microbial communities during our first ~year as a company, we refined our strategy and realized that we don’t want to divide ourselves along the lines of standard scientific disciplines. Rather than pursuing “microbiology” in a traditional sense, we’re now taking a broader-scale computational approach to identify potential evolutionary innovation in any organism, and then follow up. Thus, while we may return to metagenomic techniques in the future, we’ve stopped working on this particular project.
Learn more about the Icebox and the different reasons we ice projects.
Background and goals
One of the biggest challenges in coupling community-level observations to mechanistic understanding of microbiomes is figuring out how to bring microbial communities into the lab. Here, we demonstrate an example of how we went about “onboarding” a new microbial community at Arcadia. Our goal was to proactively consider aspects of a new community that could be informative and to stock samples so that future work would not be hindered by a lack of access to material. We decided that in addition to generating glycerol stocks of the communities for future community growth experiments or microbial isolation, it would be helpful to stock samples for future mass spectrometry, spatial imaging, viral DNA extraction and phage isolation, proximity ligation Hi-C libraries, metagenomics, and metatranscriptomics.
Based on in-house expertise, we selected five microbial communities growing on washed-rind cheeses as the first communities to onboard at Arcadia (Figure 1). Cheese rinds are a validated and stable experimental platform for microbial community research 1–4. As part of our initial characterization of these communities, we also produced high-quality short- and long-read metagenomic time series sequencing data and assemblies, including whole-genome amplification sequencing for some samples. Comparison of native DNA to amplified DNA can facilitate discovery of DNA modifications 5.
Alongside this pub, we have provided a collection of protocols for onboarding this microbial community, including protocols for sample collection, DNA extraction, and virome harvest. We also generated glycerol stocks for all of the cheeses used in these experiments that we’d be happy to make available to others for downstream uses like isolating individual strains or building culture collections.
While we have shifted direction and no longer plan to use these data sets for the time being, we hope that these protocols will be helpful to others who want to bring a microbial community into the lab. The data sets should be useful for metagenomic data mining and development of metagenomic analysis software, investigating DNA modifications, and learning about microbial communities of cheese.
SHOW ME THE DATA: Access our metagenomic sequencing data, including raw reads and assemblies. See MGnify for taxonomic and functional analysis.
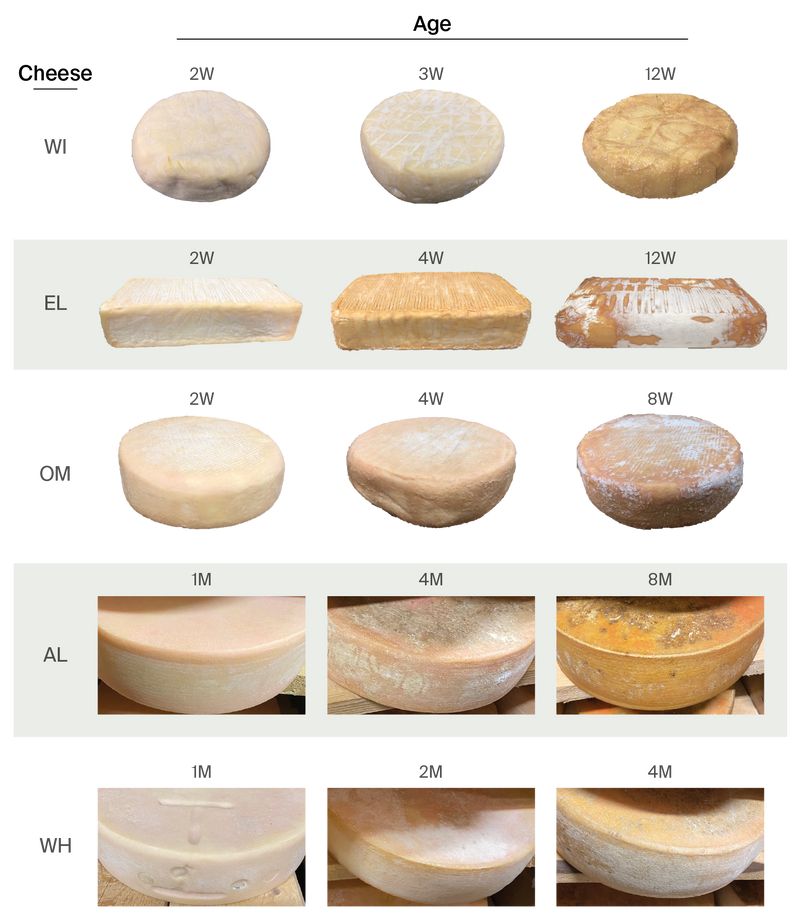
Figure 1. The five washed-rind cheeses that we sampled for this study.
Cheese names are abbreviated for simplicity. W: weeks, M: months
The approach
Code and data tables to produce figures for this pub are available in this GitHub repository (DOI: 10.5281/zenodo.7710287).
Briefly, we extracted DNA from five cheese rind communities, including their viral components (Figure 1). We then used short-read Illumina sequencing and long-read Nanopore sequencing (with and without whole-genome amplification) to characterize the microbes present in the full communities. Long-read sequencing can improve the quality of metagenomic assemblies. We sequenced multiple time points to capture the succession of microbes throughout the aging process. We then used the long-read sequencing data to predict circular contigs in the metagenomic assemblies. See detailed methods below or skip to the results.
TRY IT: You can find detailed, step-by-step protocols in this collection on protocols.io.
Sampling and DNA extraction
We sampled rinds from five distinct washed-rind cheeses aged in a cave facility in Vermont, USA as described in our “Harvesting and stocking cheese rind community samples” protocol, available on protocols.io. For simplicity, we have assigned each cheese an abbreviated name (Table 1). We selected three different time points in aging from each cheese, and used a subset of those samples for metagenomic sequencing. We made glycerol stocks for all the cheeses for possible downstream use for culture collection, as described in the protocol. WH 2M and WH 2M Hous are the same cheese style but were separate wheels that we sampled at different times. We performed DNA extraction from these samples as described in our “High-molecular-weight DNA extraction from cheese rind microbial communities” protocol.
| Cheese | Age of sequenced samples | Full aging time of cheese |
|---|---|---|
| El | 2 weeks, 1 month, 3 months | 2–3 months |
| OM | 2 weeks, 1 month, 2 months | 2.5–3.5 months |
| WI | 3 weeks | 1.5–3 months |
| AL | 4 months | 8–12 months |
| WH | 1 month, 2 months, 4 months | 3–6 months |
| WH Hous | 2 months | 3–6 months |
Table 1. Age of sequenced samples for the five cheeses.
Virome harvesting and DNA extraction
In parallel to harvesting and analyzing the full cheese rind microbial community, we also developed protocols to specifically harvest and analyze the viral component (the virome). We made concentrated virome extracts from the cheese rind samples, from which we extracted DNA and made glycerol freezer stocks. For full, step-by-step instructions, see our “Virome harvesting from cheese microbiomes” and “Virome DNA extraction with phenol-chloroform” protocols on protocols.io.
ONT long-read sequencing
We size-selected DNA samples from AL 4M, WH 2M, WH 2M Hous using this protocol from Oxford Nanopore Technologies (ONT) prior to ONT library preparation to enrich for fragments > 2 kb. Note that you need to make a free Nanopore Community account to view ONT protocols. We size-selected DNA samples from OM 2W, OM 8W, EL 2W, EL 12W, WH 1M, WH 4M using this protocol from ONT prior to ONT library preparation to enrich for fragments > 10 kb. For whole-genome amplified libraries (OM 4W WGA, EL 4W WGA, WH 2M WGA), we used the same DNA sample we used for native sequencing as the input into this protocol from ONT. We used 20 ng of DNA as input for amplification. For AL 4M, WH 2M, WH 2M Hous, OM 4W, EL 4W, and WI 3W, we loaded 10 fmol of library, assuming a size of 35 kb. For OM 2W, OM 8W, EL 2W, EL 12W, WH 1M, WH 4M, OM 4W WGA, WH 2M WGA, El 4W WGA, we loaded 10 fmol of library onto the flow cell, assuming 10 kb average length. We prepared libraries for OM 2W, EL 2W, and WH 1M with SQK-LSK114 and ran them on R10.4.1 flow cells (one full cell per sample); we prepared all other libraries with SQK-LSK112 and ran them on R10.4 flow cells (one full cell per sample). We sequenced until pores no longer showed activity (~72 h, although the majority of pores were no longer active after 40 h). We used the GridIon for sequencing and live base calling using the super-accurate base calling configuration and the following software versions: MinKNOW 22.08.6, Bream 7.2.8, Configuration 5.2.5, Guppy 6.2.7, and MinKNOW Core 5.2.2. We set the minimum read length to 1,000 bp and toggled read splitting on. For a summary of how we sequenced DNA from which cheeses, see Table 2 below.
Illumina short-read sequencing
We sent the same DNA extractions that we used as input for size selection prior to ONT sequencing to Novogene for Illumina library preparation and sequencing. We requested 16 G of raw data per sample. Novogene performed paired-end 150 bp sequencing on an Illumina NovaSeq 6000. The cheese samples from which we Illumina-sequenced DNA are summarized in Table 2.
| Native ONT | WGA ONT | Illumina | |
|---|---|---|---|
| OM 2W | x | x | |
| OM 4W | x | x | x |
| OM 8W | x | x | |
| EL 2W | x | x | |
| EL 4W | x | x | x |
| EL 12W | x | x | |
| WH 1M | x | x | |
| WH 2M | x | x | x |
| WH 4M | x | x | |
| AL 4M | x | ||
| WH 2M Hous | x | ||
| WI 3W | x |
Table 2. Summary of metagenomic sequencing work.
Each column represents a single DNA extraction sample. Rows represent sequencing techniques and an ‘x’ means we applied this technique to the sample in this column. The final two characters of the sample name designate the aging time of the cheese (W: weeks, M: months). ONT: Oxford Nanopore Technologies, WGA: whole-genome amplification. WH 2M and WH 2M Hous are samples from the same cheese style at approximately the same aging time point, but were separate wheels that we sampled at different times.
Metagenomic assembly of long-read sequencing data
We concatenated all FASTQ files with “passed” reads (quality score > 10) together and trimmed adapters using Porechop_ABI 0.5.1 6 and Python 3.8. We put trimmed reads into metaFlye 2.9.1-b1780 7 using the --nano-hq and --meta flags. We polished the assemblies with medaka 1.7.2 using BCFtools 1.14, bgzip 1.14, minimap2 2.17, SAMtools 1.14, and tabix 1.14. We obtained assembly statistics from the metaFlye output log and obtained read statistics from the ONT reports produced during sequencing.
Metagenomic assembly of short-read sequencing data
For each sample, we quality-filtered Illumina paired reads with fastp 0.23.2 8 using the --cut_front --cut_tail --cut_mean_quality 15 -q 15 and keep_phix false flags. We assembled filtered reads with metaSPAdes 3.15.3/Python 3.9.6. We obtained assembly statistics using the QUAST web interface 9 and Novogene provided read statistics.
Code and data tables to produce figures for this pub are available in this GitHub repository (DOI: 10.5281/zenodo.7710287).
Sourmash and sourmashconsumr analysis
We used sourmash version 4.6.1 to compare all of the metagenomic assemblies and to look at the taxonomic composition of the WH, OM, and EL Illumina metagenomic time-series data 10. We used the sourmash sketch dna command with -p flags k=31,scaled=1000 to make signatures for all metagenomic assemblies. We then used the sourmash compare command to make a similarity matrix for the assemblies. We used the sourmash sketch dna command with -p flags k=31,scaled=1000,abund to make signatures for paired-end Illumina read files. We used the sourmash gather command with -k 31 and --scaled 1000 options for each of the nine signatures. For sourmash gather, we used the pre-prepared sourmash GenBank genomes from March 2022 k31 databases for viruses, bacteria, archaea, protozoa, and fungi, plus the custom cheesegenomes-k31-scaled1k database. We then used the sourmash tax annotate command on the resulting gather files with the taxonomy sheets for these six databases. This resulted in nine sr.with-lineages.csv files. We then used the sourmashconsumr package 11 to make time-series alluvial plots.
Data deposition
We deposited raw Illumina and Nanopore reads (FAST5 and FASTQ files) and their corresponding metagenomic assemblies in the ENA (project PRJEB58160). We also requested MGnify analysis for the deposited data through the MGnify webpage. The resulting analysis is available here (study MGYS00006097).
The results
SHOW ME THE DATA: Access our metagenomic sequencing data, including raw reads and assemblies. See MGnify for taxonomic and functional analysis.
To generate reference metagenomic data sets for this microbiome, we generated separate assemblies based on long- or short-read data.
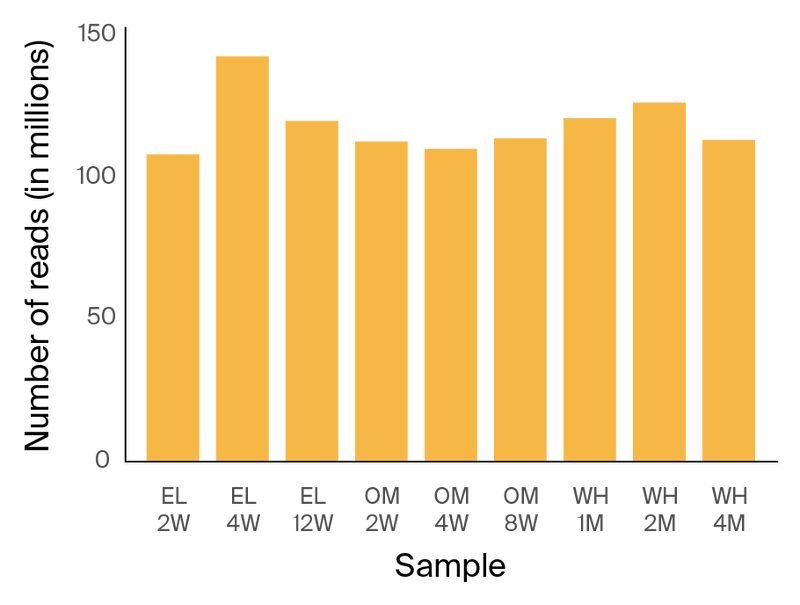
Figure 2. Depth of Illumina sequencing per sample.
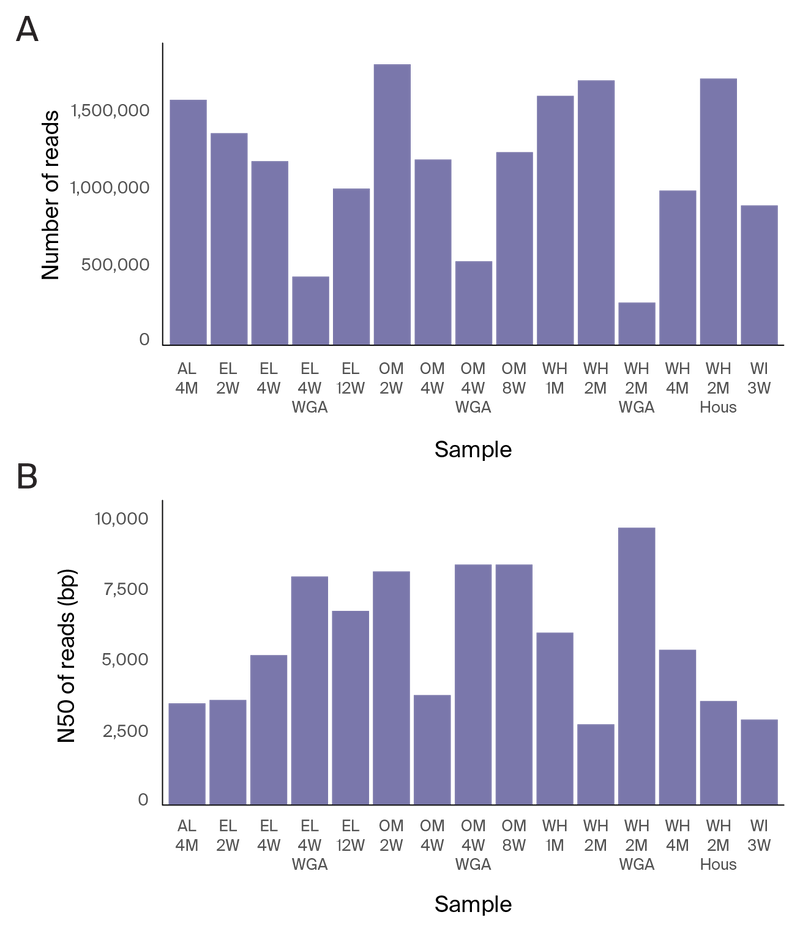
Figure 3. ONT long-read sequencing statistics.
(A) Number of reads collected per sample.
(B) N50 of ONT reads per sample.
WGA: Whole-genome amplification. “WH 2M” and “WH 2M Hous” are samples from the same cheese style at approximately the same aging time point, but were separate wheels that we sampled at different times.
For Illumina short-read 150 bp PE sequencing, the average sequencing depth was 119 million reads per sample (Figure 2). For ONT long-read sequencing, the average depth was around 1.2 million reads per sample, with an average N50 of 5.8 kb (Figure 3).
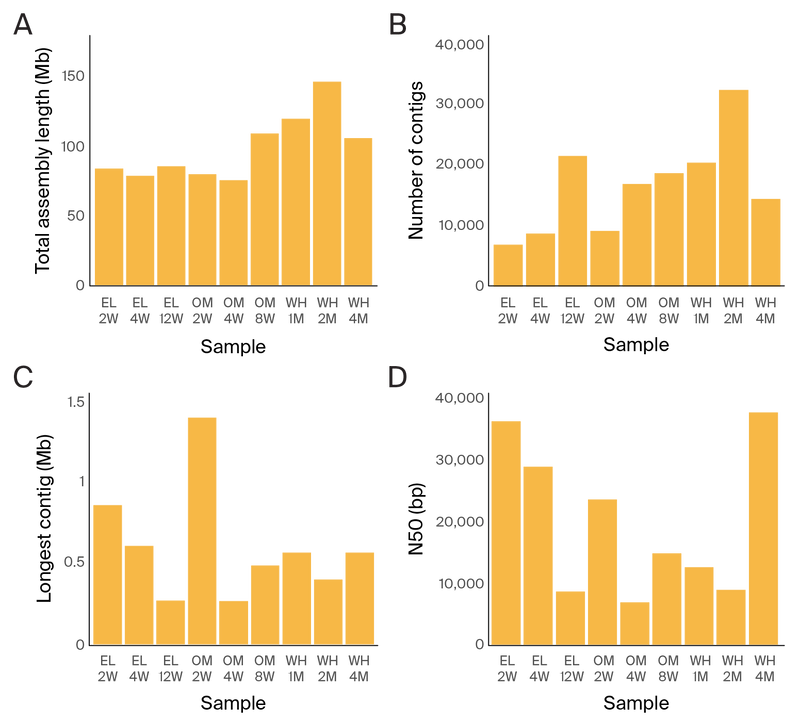
Figure 4. Metagenomic assembly statistics from short-read assemblies.
(A) Total length of the assembly per sample.
(B) Number of contigs per sample.
(C) Longest contig per sample.
(D) N50 of contigs per sample.
The Illumina metagenomic assemblies were an average of 1.5 times larger than the GridIon assemblies of the same DNA sample, with 7.5 times the number of contigs (Figure 4 and Figure 5). The N50 of the Illumina assemblies was 19.6 kb on average, whereas the N50 of the long-read assemblies was 333.8 kb. For long-read sequencing, the longest assembled contigs were an average of 3.7 Mb, about the size of a complete bacterial genome, while the longest Illumina contigs were about 0.6 Mb on average (Figure 4 and Figure 5).
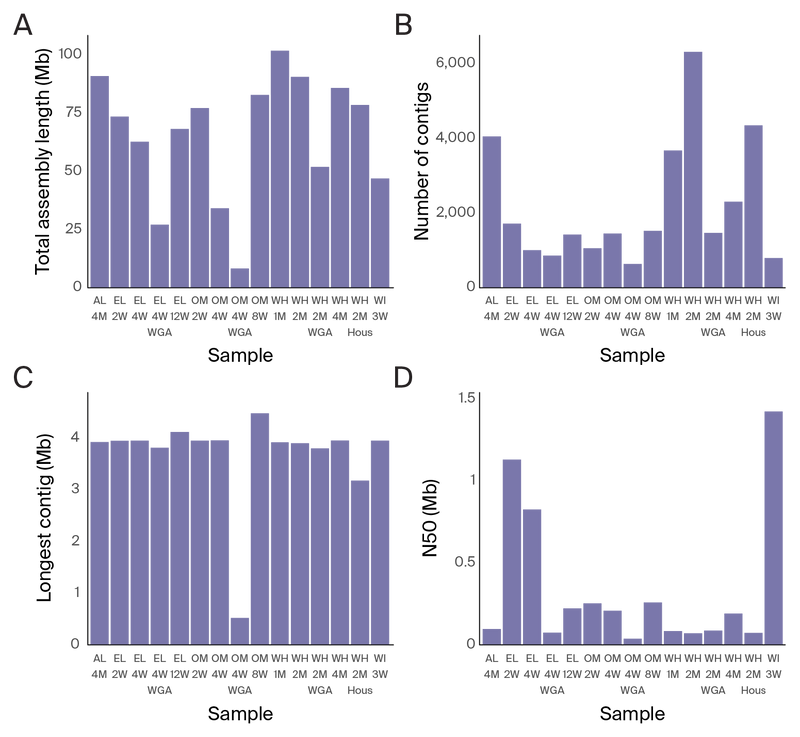
Figure 5. Metagenomic assembly statistics from long-read assemblies.
(A) Total length of the assembly per sample.
(B) Number of contigs per sample.
(C) Longest contig per sample.
(D) N50 of contigs per sample.
We assembled an average of 116 circular contigs per sample from the long-read data, which may represent complete bacterial chromosomes, viruses, or plasmids (Figure 6, Table 3). As expected, our data suggest that using long reads dramatically improved assembly contiguity.
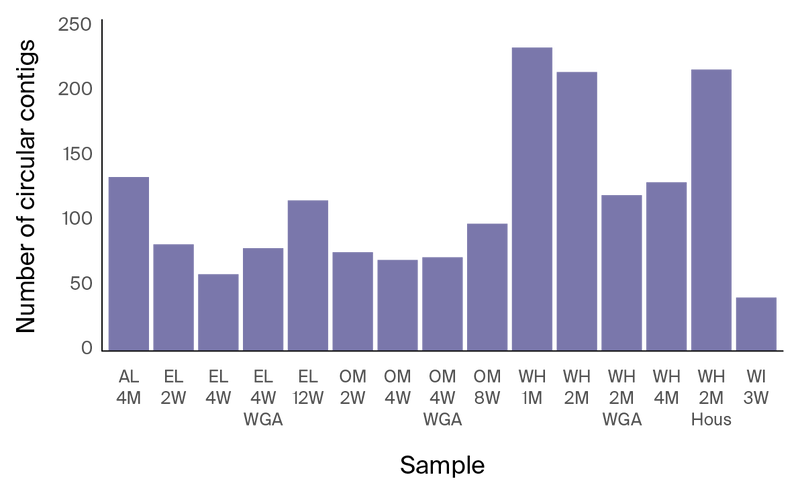
Figure 6. Number of circular contigs per sample.
| < 1000 bp | 1000–10000 bp | 10000–100000 bp | 100000 bp –1 Mbp | 1 Mbp | |
|---|---|---|---|---|---|
| AL 4M | 10 | 81 | 39 | 3 | 0 |
| EL 2W | 2 | 58 | 18 | 1 | 3 |
| EL 4W | 1 | 34 | 19 | 2 | 3 |
| EL 4W WGA | 2 | 40 | 35 | 1 | 1 |
| EL 12W | 4 | 63 | 44 | 3 | 2 |
| OM 2W | 5 | 43 | 24 | 2 | 2 |
| OM 4W | 5 | 47 | 14 | 2 | 2 |
| OM 4W WGA | 3 | 28 | 41 | 0 | 0 |
| OM 8W | 0 | 51 | 41 | 2 | 4 |
| WH 1M | 14 | 129 | 82 | 7 | 2 |
| WH 2M | 21 | 151 | 39 | 4 | 0 |
| WH 2M WGA | 2 | 49 | 64 | 4 | 1 |
| WH 4M | 1 | 90 | 38 | 1 | 0 |
| WH 2M Hous | 18 | 144 | 52 | 2 | 1 |
| WI 3W | 5 | 20 | 12 | 1 | 3 |
Table 3. Size distribution of circular contigs in long-read assemblies.
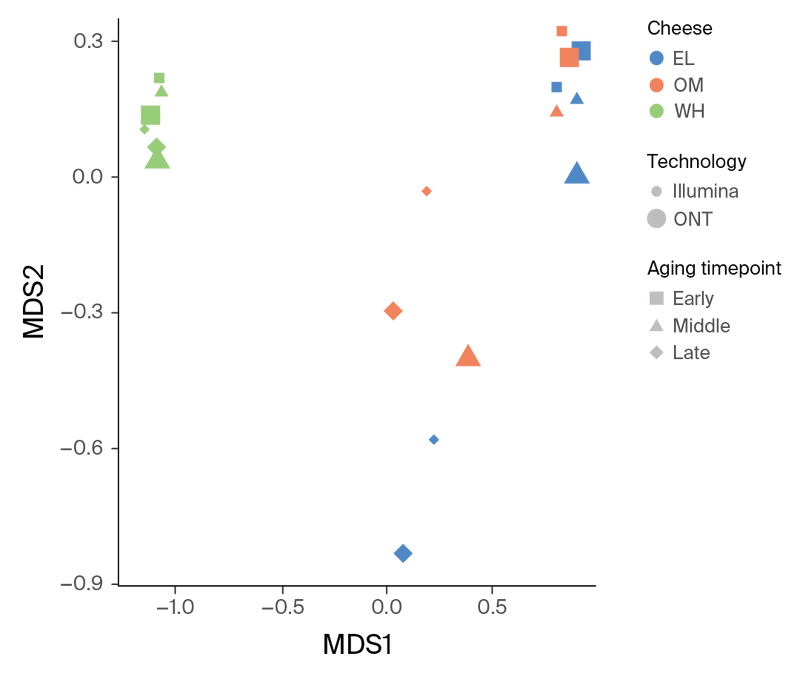
Figure 7. MDS ordination plot based on the similarity matrix produced by sourmash comparison of the assemblies.
Since the cheeses sampled all belong to a similar rind style and are aged in the same facility, we next applied a min-hash-based comparison pipeline to the short-read data to understand how similar these data sets are. Sourmash comparison of the time series assemblies showed that the microbial communities from OM and EL cluster closely together, while WH appears distinct (Figure 7, green points). Based on short-read data, the OM and EL communities appear to be dominated by Psychrobacter and Pseudoalteromonas spp. throughout the aging process. Actinobacteria and Halomonas spp. more heavily dominate WH communities. A larger fraction of the WH metagenome is unclassified compared to the other two communities (Figure 8). We suspect this may be due to a higher fraction of fungal genomes in WH that are not well represented in databases.
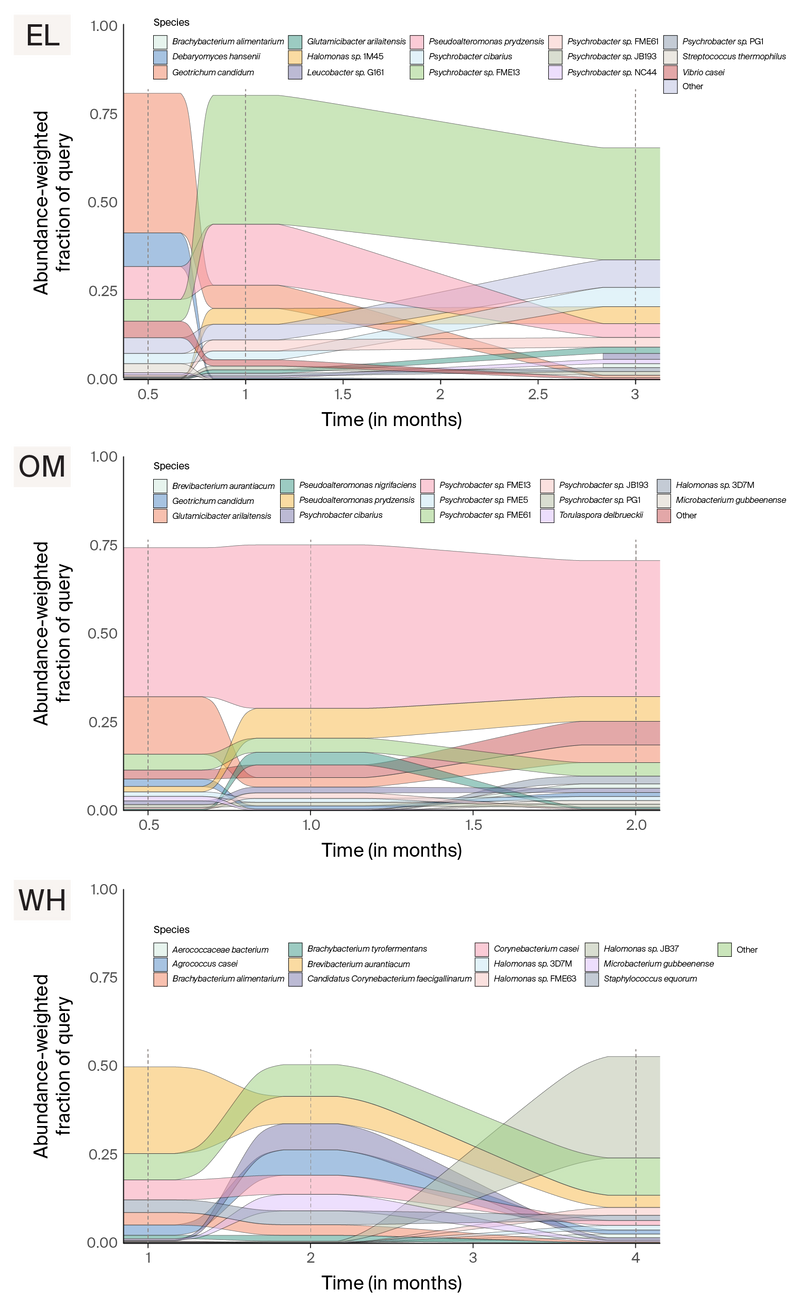
Figure 8. Change in abundance of microbes over the aging process based on sourmash analysis of short-read sequencing data.
Note that colors correspond to different microbes across the three panels.
Key takeaways
Cheese rinds are semi-complex microbial communities containing bacteria, viruses, and fungi. We used both long- and short-read sequencing to survey the microbial communities of five different cheeses across multiple time points. Long-read sequencing lets us assemble contigs the length of bacterial chromosomes. These data sets can serve as resources for benchmarking computational workflows and guiding computational methods development at Arcadia and beyond.
Please reuse our data!
We sequenced the same communities using multiple approaches: short-read Illumina sequencing, native DNA ONT sequencing, and whole-genome amplified ONT sequencing. These paired data sets are a resource to evaluate how different sequencing approaches differentially impact recovery of microbial community members 12, an important consideration when choosing a sequencing methodology.
We also generated paired native DNA and whole-genome amplified (WGA) ONT data sets as a resource to facilitate DNA modification discovery (for example, 5 and 13). DNA modification identification can guide genome engineering efforts of bacteria 14–15, as well as the discovery of new DNA chemistries in microbial communities. As current de novo modification prediction tools for ONT data are designed for ONT R9 chemistry, which will be fully discontinued this year, we hope that the paired WGA:native R10 chemistry data that we’ve provided will be useful for the development of updated tools. FAST5 files required for this type of analysis are available in the European Nucleotide Archive (ENA).
We encourage others interested in microbial communities and/or DNA modification to explore these data sets!
Next steps
We’re not planning to further analyze this data in the near-to-medium-term, but we encourage others to make good use of the paired data sets and stocked samples.
We have also done HiPR-FISH spatial imaging 16 on the same cheese samples sequenced here. Be on the lookout for an upcoming pub presenting this data!
Acknowledgements
Thank you to Julia Pringle and Jasper Hill Farm for organizing the collection of cheese samples from the cheese aging facility.
Be the first to comment on this publication.