Purpose
Ticks and other parasitic chelicerates feed on our skin undetected for long periods of time. This requires blocking typical host responses to parasitism, such as itch, pain, and inflammation. We want to understand the mechanistic bases of this detection-suppression trait so we can design better therapeutic strategies for chronic skin diseases.
Here, we used comparative phylogenomics and trait mapping across 40 chelicerates to identify gene families that predict the ability of a parasite to suppress host detection. Out of the gene families we found, the most promising are antimicrobial peptides, cystatin protease inhibitors, and SAA1-like proteins. These candidate detection suppressors have known links to immunity, itch, and pain, creating opportunities to better understand their function in parasitism and skin biology.
That said, our approach and results come with caveats, and they need follow-up. We're sharing our methods and findings in case they’re useful to others interested in predicting the biological basis of traits. As our own methodology is a work in progress, we'd welcome feedback on how to continue to build and improve our phylogenomics toolkit. We’d also love feedback on our specific findings from domain experts in fields such as immunology, skin biology, and parasitology.
- This pub is part of the project, “Ticks as treasure troves: Molecular discovery in new organisms.” Visit the project narrative for more background and context.
- Data from this pub, including input proteomes, NovelTree inputs and outputs, and Amblyomma americanum gene expression data, is available on Zenodo.
- All associated code is available in this GitHub repository.
Background and goals
Ectoparasites are parasites that live on the outside of their hosts. They feed by breaching the host’s outermost barrier defenses, using salivary secretions to manipulate the local environment, and releasing host fluids they then ingest 1. Ectoparasites must evolve specialized structures and strategies to get past their host's barrier defenses 1, and many organisms (from plants to animals) have ectoparasites that have evolved to prey on them 2–3.
Hematophagous (blood-feeding) ectoparasites consume blood, lymph, or exudate leaking from damaged skin 1. Within hematophagous ectoparasites of vertebrates such as humans, there's a wide diversity of feeding behaviors. Mosquitoes attach to the host for only seconds to minutes 4, while leeches or argasid (soft) ticks feed for 20–30 minutes 5–6. Some hard tick species have even evolved the ability to feed for longer than a day 7. Such extreme strategies require substantial manipulation of the host dermis through the tick’s saliva, which contains hundreds to thousands of pharmacologically active molecules 8.
Some of the host systems that tick saliva manipulates include host sensory perception (itch, pain) and immune responses 8–11. We broadly term these responses “host detection,” as they're systems that rapidly detect parasites or other sources of danger. We're interested in discovering the strategies that ticks use to block this detection. We believe these adaptations may inform new therapies for treating skin conditions characterized by itch, pain, and inflammation. In particular, prolonged feeders like ticks could give us a unique lens into signaling events in the skin over a longer time span, giving us clues for treating more stubborn chronic or delayed-onset conditions.
So far, we’ve used an experimental approach to identify molecules of interest. We extract itch-suppressing compounds from the saliva of the A. americanum ticks and narrow the list of potential effectors via sub-fractionation. This strategy has already proved fruitful, and we’ve been following up on several promising hits. However, it also has certain limitations that we hope to overcome with our evolution-informed computational platform. First, we’re limited in how many species of ticks we can empirically study given the throughput bottleneck imposed by experimental work. Second, experiments rely on activity-specific assays, meaning we can only survey a tiny slice of bioactivity at a time. Together, these limitations limit a more systematic understanding of global host manipulation mechanisms that ticks use.
Here, we designed an orthogonal computational approach to identify putative detection-suppressing effectors across a wider range of species. This approach, combining existing and new methods developed in-house, leverages comparative evolutionary genomics to test hypotheses and screen for gene families that putatively contributed to the evolution of long-term suppression of host detection. Since individual genes evolve at distinct rates and though distinct combinations of evolutionary mechanisms (e.g., gene duplication, loss, and horizontal transfer), reconstructing gene family histories can be quite informative about the genes that contribute to the evolution of ecologically relevant traits, such as those associated with ectoparasitism. You can read more about how this works in 12. Importantly, a key part of this predictive power comes from our ability to compare patterns across species at both the genomic and phenotypic levels.
How did some parasites evolve to evade host detection?
Some species in the subclass Acari feed on vertebrate hosts, including humans, for long periods of time (> 1 day). They suppress host detection (including itch, pain, and inflammation), which could be therapeutically useful. We leveraged the diversity of lifestyles across all chelicerates to find genes associated with this behavior. We found 87 such gene families and filtered down to 10 promising putative suppressors of host detection.
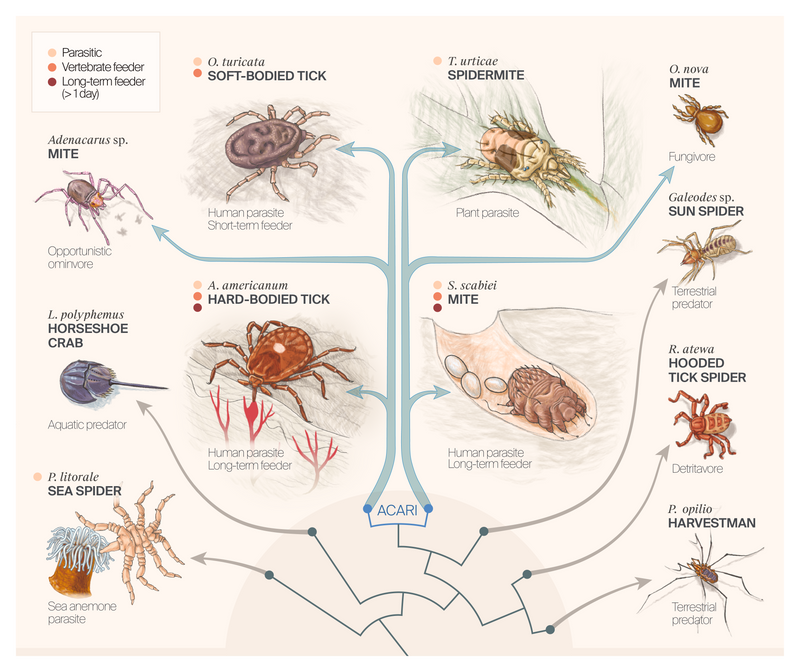
Ticks and their relatives in the subphylum Chelicerata are ripe for comparative investigation into the evolution of traits related to parasitic life histories. Chelicerates have substantial variation in their ecology and traits relating to parasitism, diet, and feeding time, suggesting a comparable diversity of mechanisms underlying the suppression of host detection. Parasitic life histories have been gained and lost repeatedly across the group, particularly within the sea spiders, mites, and ticks 13. Parasitic lineages have also undergone numerous host-switches 13. Individual chelicerate species parasitize a broad diversity of host species, ranging from microscopic invertebrates such as nematodes to sea anemones, other mites, insects, and all major vertebrate groups 13. Host specificity is also highly variable 13. For instance, tick species range from being highly specialized with salivary cocktails tailored to their hosts (a process potentially driven by gene duplication) to extreme generalists that feed on phylogenetically and morphologically diverse host species 14. Furthermore, the duration spent feeding on their hosts is highly variable across chelicerates 6–7, suggesting the group may harbor substantial diversity in the types of pharmacologically active molecules suited to treating chronic skin diseases.
In this work, we searched for gene families (orthogroups) with diversification histories consistent with the hypothesis that they contributed to the evolution of long-term suppression of host detection. To do so, we designed and implemented a “phylogenomic association test,” which performs phylogenetic profiling using the outputs of NovelTree, our method for phylogenomic inference 15. We identified 87 gene families with gene copy numbers that were strongly and significantly associated with long-term suppression of host detection. By filtering for patterns consistent with secreted salivary effectors, we narrowed this list to 10 orthogroups, four of which had clear functional annotations. These orthogroups are a starting point for us to make new hypotheses about how ticks modulate host responses like itch, pain, and inflammation.
Orthogroups vs. gene families
Throughout this pub, we use the terms orthogroups and gene families interchangeably. We use these words to refer to groups of evolutionarily related genes derived from a single gene present in the last common ancestor of all the species analyzed 16.
The approach
Our approach to identifying chelicerate proteins associated with host detection suppression consisted of four main steps: designing the study (including curating publicly available data), performing phylogenomic inference with NovelTree 15, testing for associations between gene family diversification and the capacity for long-term suppression of host detection, and filtering down to gene families most likely to be secreted salivary effectors (Figure 1). Click here to skip past our methodology and jump straight to the results.
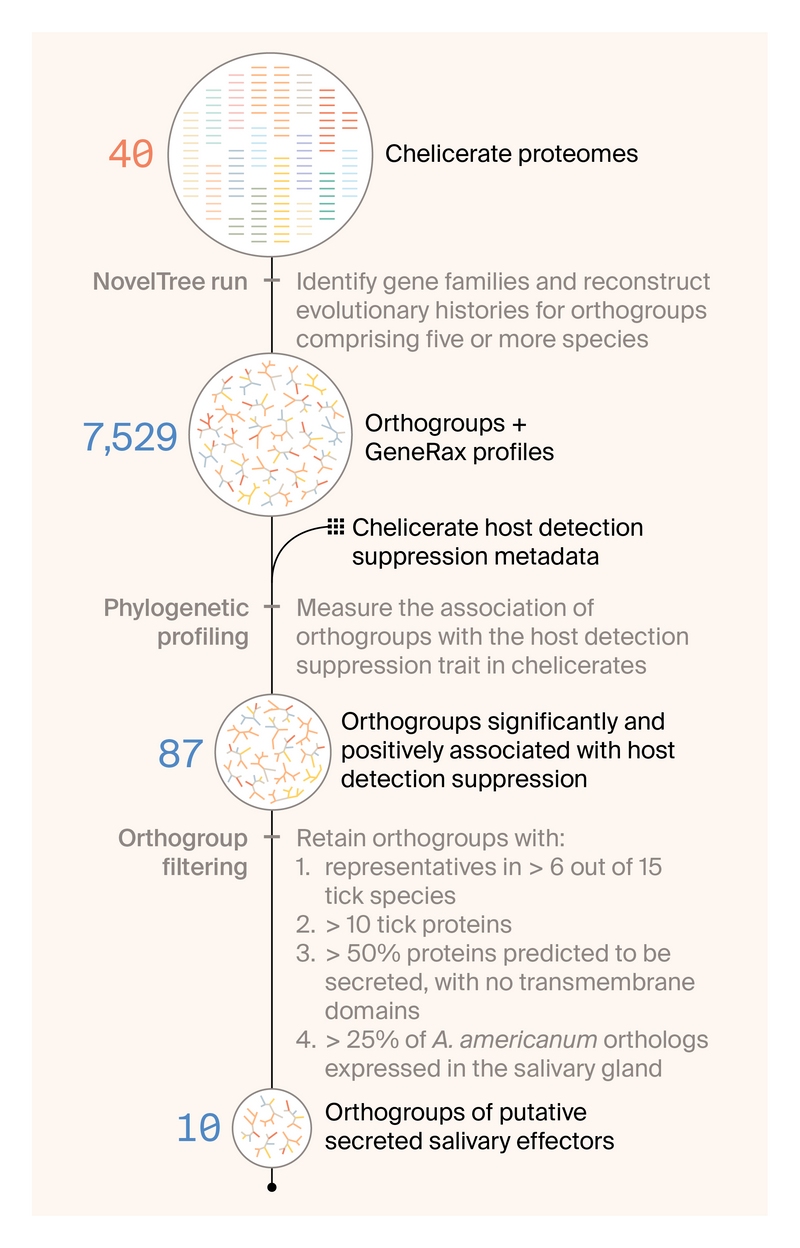
Figure 1. Our workflow for identifying gene families that help long-term feeders suppress host detection.
We started with 40 chelicerate proteomes and then used NovelTree to identify gene families and reconstruct their evolutionary histories. We moved 7,529 gene families that met our criteria to the phylogenetic profiling stage, where we measured the association of orthogroups with the ability of a chelicerate to suppress host detection. Out of the 87 orthogroups positively associated with this trait, we filtered down to the 10 most promising that seem most likely to be secreted and directly interact with the host.
Curating chelicerate proteomes
To explore gene family evolution in ticks and other blood-feeding or parasitic species, we used our phylogenomic inference tool, NovelTree 15. The NovelTree workflow takes proteomes (i.e., one amino acid sequence for each protein-coding gene in a genome or transcriptome) from diverse organisms and infers orthology, gene family trees, species trees, and gene family evolutionary dynamics. For this initial investigation into the evolution of host detection suppression by chelicerates, we decided to target 30–50 species.
Based on our interest in prolonged feeding, we focused on ticks and their close relatives. We compiled a set of 15 tick proteomes and built out taxonomic breadth and depth within the tick-containing subphylum Chelicerata. Ultimately, this dataset consisted of proteomes from 40 chelicerate species, including class Pycnogonida (sea spiders; n = 2), subclass Acari (a historical designation for mites and soft or hard ticks; n = 32), orders Opiliones (harvestmen; n = 2), Palpigradi (microwhip scorpions; n = 1), Ricinulei (hooded tick spiders; n = 1), Solifugae (sun spiders; n = 1), and Xiphosura (horseshoe crabs; n = 1). We selected these species groups based on recent chelicerate phylogenetic hypotheses and associated life history transitions (e.g., 17–19).
We used 25 proteomes generated from genomic data and 15 from transcriptomes to study these species. To maximize proteome completeness, we only used transcriptomes derived from either whole animals or multiple tissues, except for the Ornithodoros turicata transcriptome, which came from only the tick synganglion. Most of the proteomes used in this analysis had > 75% of the Arachnida Odb10 BUSCOs 20 (Figure 2), meaning they're relatively complete despite their varied origins. As previously described in detail here (Snakemake workflow found here), before running NovelTree, we pre-processed all 40 proteomes to filter out redundant and short sequences and curate functional annotations (e.g., KEGG annotations) 15.
We ran the pre-processing Snakemake workflow using the sample sheet “chelicerate-samples.tsv.” This and all proteome processing outputs are on Zenodo (DOI: 10.5281/zenodo.14113178). Outputs of the proteome data curation pipeline are in “chelicerate_proteome_preprocessing_outputs.zip,” and all chelicerate protein sequences are found in “2024-06-24-all-chelicerate-noveltree-proteins.fasta.”
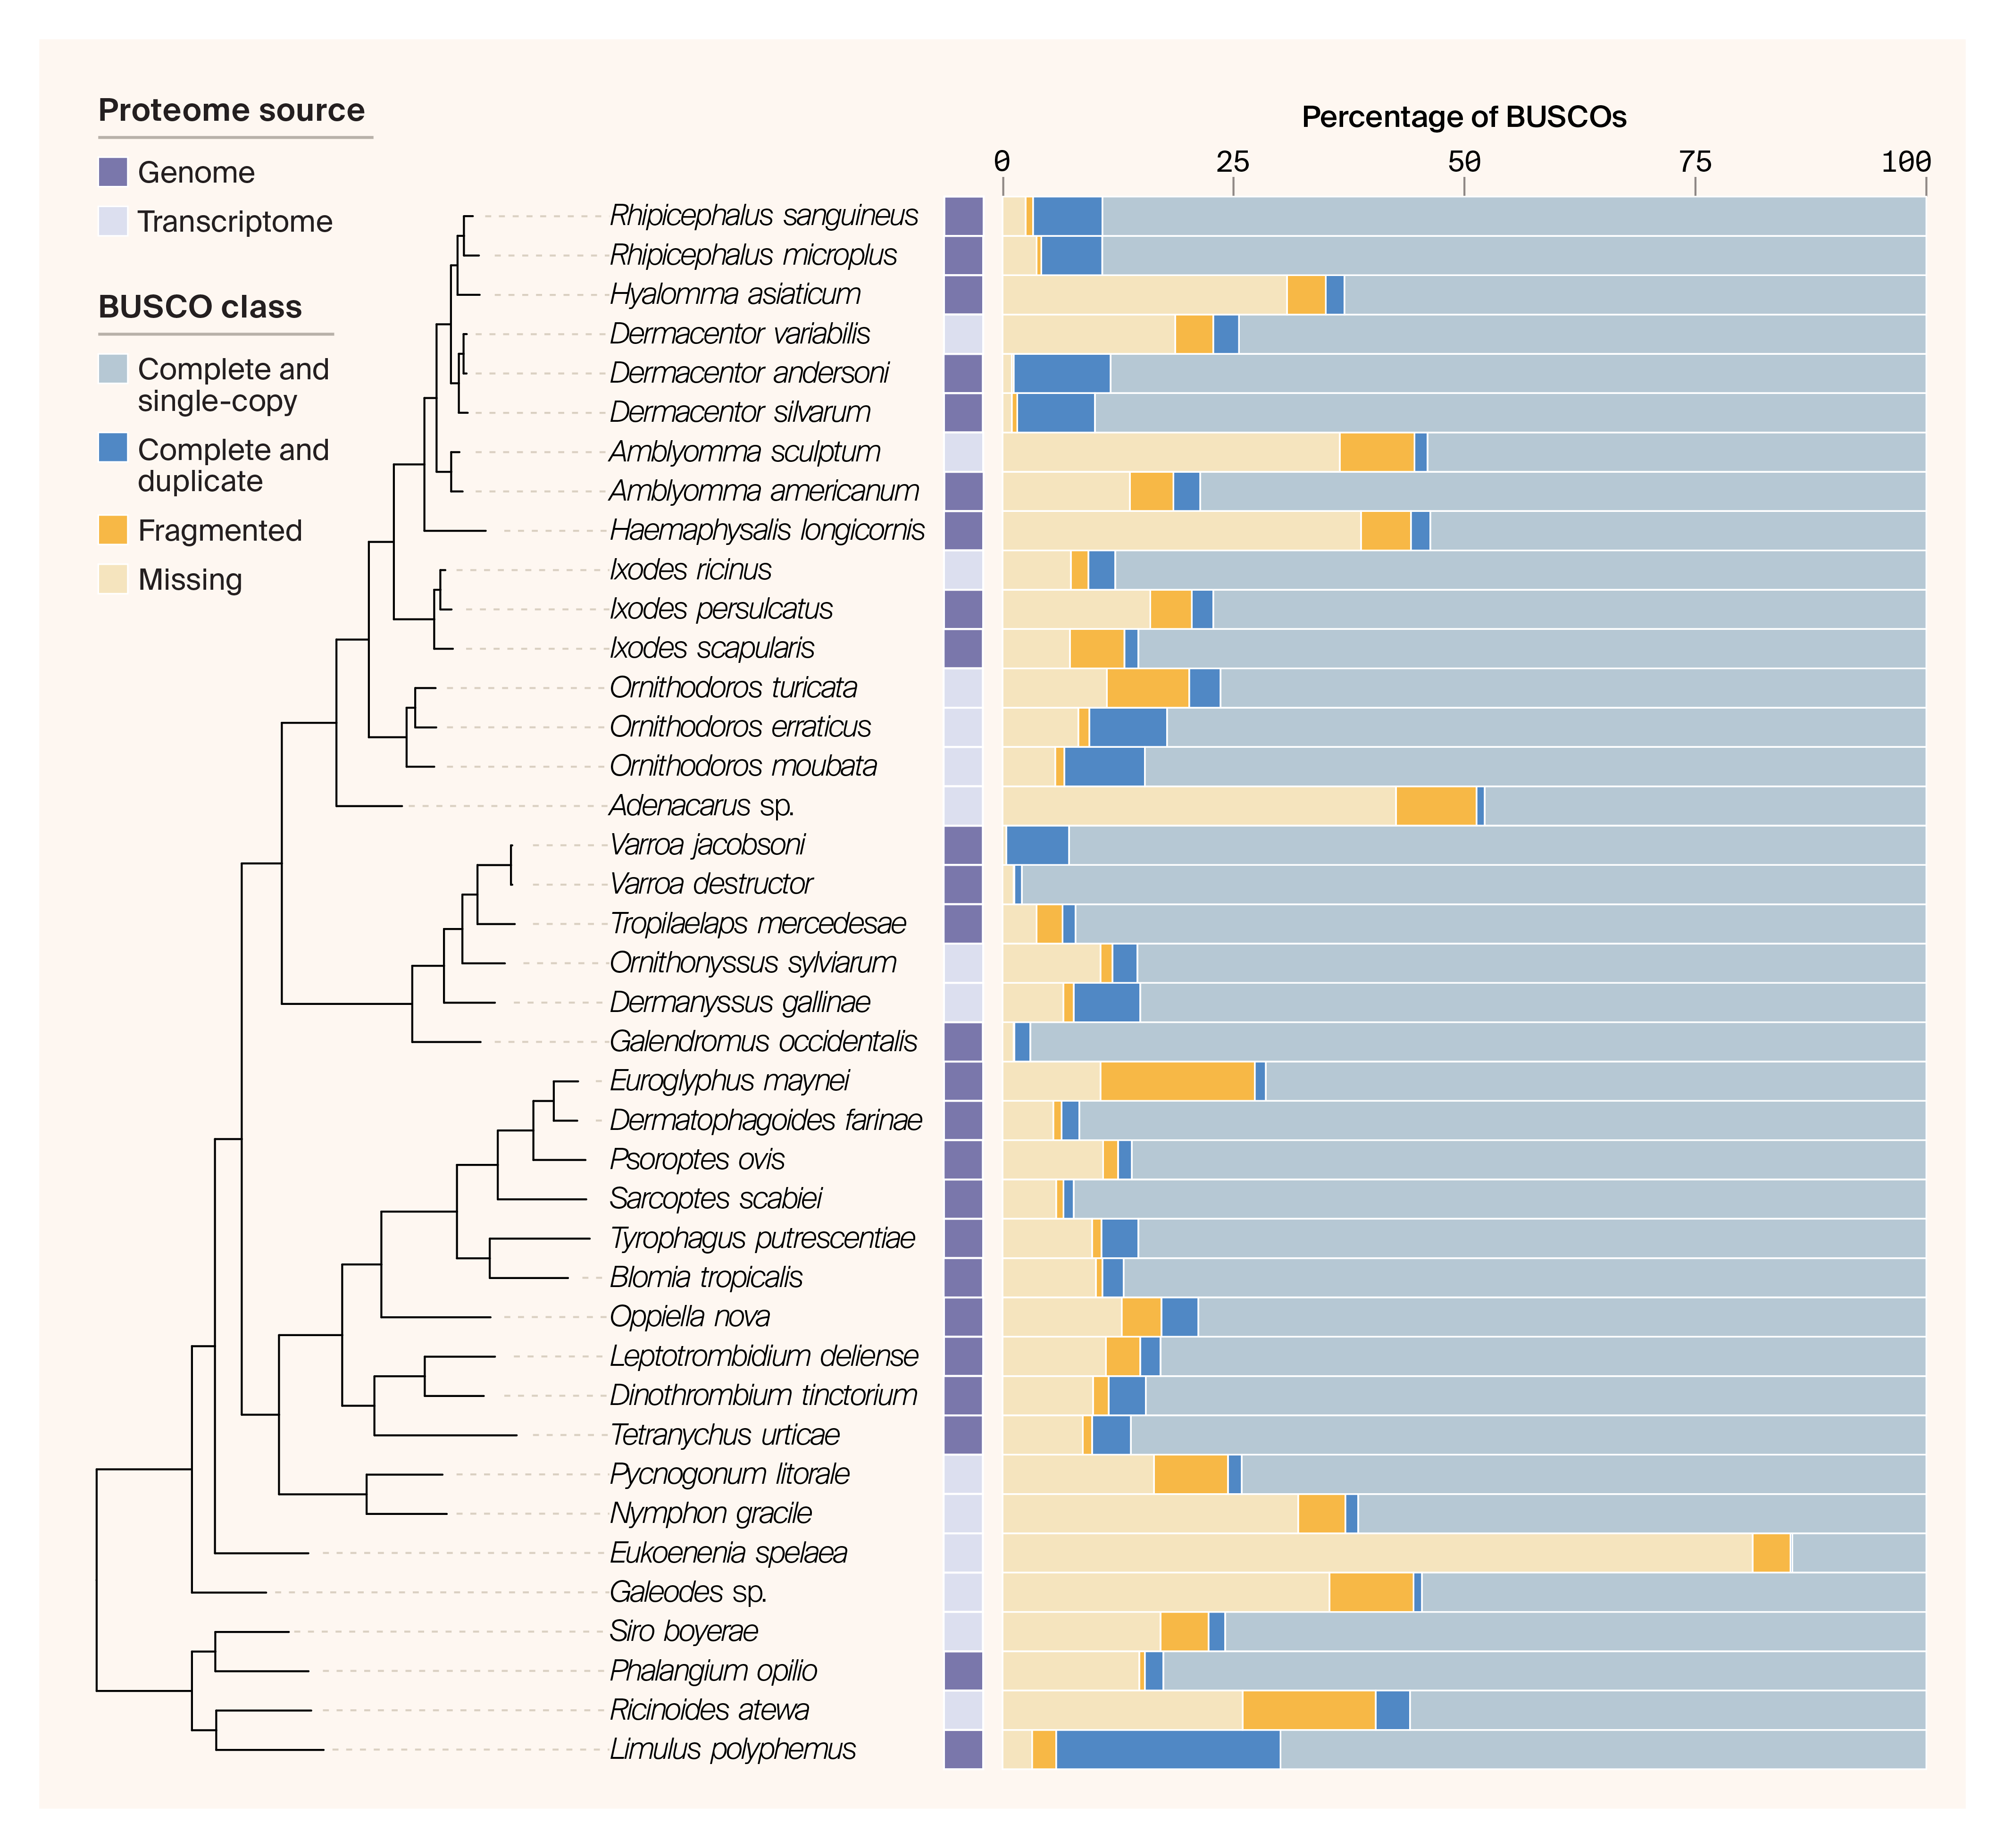
Figure 2. Proteome source and completeness for the 40 chelicerate species in our study.
Proteomes are organized into a species tree, which we inferred by SpeciesRax using 4,969 gene families as implemented in NovelTree. We show BUSCO completeness scores for each proteome, calculated using the Arachnida Odb10 dataset. Proteomes sourced from transcriptomes are highlighted in light grey, and proteome sources from genomes are marked in dark purple.
Curating chelicerate trait data
To predict the basis of long-term suppression of host detection in our trait association tests, we had to assign the presence or absence of that trait to each of our 40 chelicerate species. We established four ecological criteria that an organism would have to satisfy to be designated a long-term suppressor: (1) the organism is a parasite, (2) the organism feeds on vertebrates, (3) the organism must feed for > 1 day, and (4) the organism can’t be known to cause immediate itch, pain, or inflammation in a bitten host. We then manually curated the relevant trait data from the literature for each species included in our phylogenetic analyses (Table 1 & Table 2). We classified species reported to meet these criteria as long-term suppressors of host detection (Table 2).
Implications of omitting parasites of non-vertebrates
Many chelicerates are parasites of non-vertebrate species, such as plants and other arthropods. They may also suppress host detection for extended periods. However, given the overall limited data on exact feeding durations and the differences in the mechanisms underlying host recognition of ectoparasites across vertebrates, arthropods, and plants in the literature, we limited our search to adaptations that specifically enable parasites to feed on vertebrates. While this narrowed scope might mean missing out on the full mechanistic diversity of host detection suppression in chelicerates, it increases our ability to interpret our results in the context of known human biology.
| Species | Common name | Diet | Host | Diet and lifestyle reference(s) | Feeding duration (days) | Feeding duration reference |
|---|---|---|---|---|---|---|
| Adenacarus sp. | Long-legged mites | Various small organisms, pollen, fungi | NA | 21 | NA | NA |
| Amblyomma americanum | Lone star tick (hard tick) | Blood | Vertebrate | 22 | 12 | 23 |
| Amblyomma sculptum | Hard tick | Blood | Vertebrate | 22 | 14 | 24 |
| Blomia tropicalis | Dust mite | Skin flakes (scavenged) | NA | 25 | NA | NA |
| Dermacentor andersoni | Rocky Mountain wood tick (hard tick) | Blood | Vertebrate | 22 | 6 | 26 |
| Dermacentor silvarum | Hard tick | Blood | Vertebrate | 22 | 7 | 27 |
| Dermacentor variabilis | American dog tick (hard tick) | Blood | Vertebrate | 22 | 8 | 23 |
| Dermanyssus gallinae | Red poultry mite | Blood | Vertebrate | 28 | 0.04 | 29 |
| Dermatophagoides farinae | American house dust mite | Skin flakes (scavenged) | NA | 25 | NA | NA |
| Dinothrombium tinctorium | Red velvet mite | Hemolymph | Arthropod | 30 | Unknown | NA |
| Eukoenenia spelaea | Microwhip scorpion | Scavenges detritus, cyanobacteria | NA | 31–32 | NA | NA |
| Euroglyphus maynei | Mayne's house dust mite | Skin flakes (scavenged) | NA | 33 | NA | NA |
| Galendromus occidentalis | Western predatory mite | Hemolymph | Arthropod | 34 | Unknown | NA |
| Galeodes sp | Camel spider | Various small arthropods | NA | 35 | NA | NA |
| Haemaphysalis longicornis | Asian long-horned tick (hard tick) | Blood | Vertebrate | 22 | 12 | 36 |
| Hyalomma asiaticum | Hard tick | Blood | Vertebrate | 22 | 10 | 37 |
| Ixodes persulcatus | Yaiga tick (hard tick) | Blood | Vertebrate | 22 | 9 | 38 |
| Ixodes ricinus | Castor bean tick (hard tick) | Blood | Vertebrate | 22 | 7 | 39 |
| Ixodes scapularis | Black-legged tick (hard tick) | Blood | Vertebrate | 22 | 7 | 23 |
| Leptotrombidium deliense | Scrub typhus mite (chigger mite) | Skin exudate | Vertebrate | 40–41 | 3 | 40 |
| Limulus polyphemus | Atlantic horseshoe crab | Small animals and detritus | NA | 42 | NA | NA |
| Nymphon gracile | Sea spider | Body fluids | Cnidaria | 43–44 | Unknown | NA |
| Oppiella nova | Soil mite | Fungi | NA | 45 | NA | NA |
| Ornithodoros erraticus | Soft tick | Blood | Vertebrate | 46 | 0.01 | 6 |
| Ornithodoros moubata | African relapsing fever tick (soft tick) | Blood | Vertebrate | 46 | 0.01 | 6 |
| Ornithodoros turicata | Relapsing fever tick (soft tick) | Blood | Vertebrate | 46 | 0.01 | 6 |
| Ornithonyssus sylviarum | Northern fowl mite | Blood | Vertebrate | 47 | 0.04 | 29 |
| Phalangium opilio | Daddy longlegs (harvestman) | Various small arthropods | NA | 48 | NA | NA |
| Psoroptes ovis | Sheep scab mite | Skin exudate | Vertebrate | 49 | 27 | 50 |
| Pycnogonum litorale | Sea spider | Body fluids | Cnidaria | 51 | Unknown | NA |
| Rhipicephalus microplus | Cattle tick (hard tick) | Blood | Vertebrate | 22 | 7 | 52 |
| Rhipicephalus sanguineus | Brown dog tick (hard tick) | Blood | Vertebrate | 22 | 9 | 23 |
| Ricinoides atewa | Atewa hooded spider | Termites and ants | NA | 53 | NA | NA |
| Sarcoptes scabiei | Itch mite | Skin exudate | Vertebrate | 54 | 17 | 54 |
| Siro boyerae | Mite harvestman | Small animals and detritus | NA | 55 | NA | NA |
| Tetranychus urticae | Red spider mite | Plant cell cytoplasm | Plant | 56 | Unknown | NA |
| Tropilaelaps mercedesae | Honey bee mite | Hemolymph | Arthropod | 57 | 2 | 57 |
| Tyrophagus putrescentiae | Cheese mite | Fungi | NA | 58 | NA | NA |
| Varroa destructor | Varroa mite | Insect fat bodies | Arthropod | 59 | 0.01 | 60 |
| Varroa jacobsoni | Varroa mite | Insect fat bodies | Arthropod | 60 | 0.01 | 60 |
Table 1. Trait data for all chelicerate species we used in this study.
We report each species in this study's common name, whether it's a parasite, and its diet. For the parasites, we also report the duration of feeding time. In cases where we couldn't find the relevant trait information, we designate the trait as “unknown.” In the cases where the column isn't applicable (e.g., feeding duration doesn’t apply to non-parasites), we use the designation “NA.”
| Organism | Host detection | Detection reference(s) | Designation |
|---|---|---|---|
| Hard ticks (12 species) | Suppress itch, pain, and inflammation during feeding, not detected by bitten humans | 8–11 | All are long-term detection suppressors |
| Leptotrombidium deliense | Bite is described as a “sting,” appears to be detected rapidly by bitten humans | 41 | Causes immediate pain, not a long-term detection suppressor |
| Psoroptes ovis | Causes intense itch after massive replication, appears to be a latent phase before sheep begin itching | 50 | Long-term detection suppressor |
| Sarcoptes scabiei | Causes intense itch after massive replication in the skin, not noticed by parasitized humans for up to 30 days | 61–62 | Long-term detection suppressor |
Table 2. Host detection suppression in long-term parasites of vertebrates.
For the chelicerates in our study that parasitize vertebrates for > 1 day, we reviewed the literature to understand whether they're potential suppressors of host detection. We report the relevant host-detection traits and our final designation of whether the organism is a long-term suppressor of host detection. Here, we group all hard ticks together, as they're all long-term parasites of vertebrates and, to the best of our knowledge, share the ability to suppress host detection. In addition to hard ticks, we also predict that P. ovis and S. scabiei can suppress host detection for > 1 day.
Inferring gene family evolutionary histories with NovelTree
We ran NovelTree v1.0.2 using the same settings as described in its original pub 12. Briefly, we used WITCH v0.3.0 63 for multiple sequence alignment and IQ-TREE 2 v2.2.0.5 64 for gene family tree inference. We required that gene families retained for phylogenetic analysis contained proteins from at least five species and had a mean per-species gene copy number ≤ 20 (7,529 gene families). After multiple sequence alignment, we removed sequences with an ungapped length of ≤ 20 amino acids. To infer our species tree, we used the gene families with fewer than a mean per-species copy number of 10 (4,969 gene families).
Run configuration and all NovelTree input and outputs are on Zenodo (DOI: 10.5281/zenodo.14113178).
- The detailed NovelTree run configuration is in its parameter file “chelicerata-v1-parameterfile.json”
- Inputs are “chelicerata-v1-samplesheet.csv,” and outputs are “chelicerata-v1-10062023.zip” and “summary_of_noveltree_results.zip”
- You can find the orthogroup table in “chelicerata-v1-10062023.zip” with file path “chelicerata-v1-10062023/orthofinder/complete_dataset/Results_Inflation_1.5/Orthogroups/Orthogroups.GeneCount.tsv”
Phylogenetic profiling
We sought to identify gene families most strongly associated with suppressing host detection. We first generated phylogenetic profiles — counts of evolutionary events for each species and each internal branch of the species tree — for each gene family using the outputs of GeneRax using R (v4.4.1) 65. Note that our approach to phylogenetic profiling is distinct from the approach more typically applied to bacterial species, which uses gene presence/absence rather than gene copy number or event counts 66.
Here, we focus on speciation events. These occur when a parent species diverges into two daughter species, resulting in the original gene branching into two separate gene lineages that persist to the present. Speciation events thus capture multiple features of gene family evolution that are closely tied to gene copy number and correlate with the other event types — gene duplication, transfer, and loss.
Performing independent association tests for each (> 10,000) gene family carries the risk of elevated false-positive rates and the spurious identification of gene family–trait associations. Consequently, we took a hierarchical approach where we: 1) clustered gene families according to their profile similarity, 2) conducted statistical tests to identify which gene family clusters most strongly predicted suppression of host detection, and 3) carried out post-hoc tests using individual gene families within significant clusters. Below, we provide details of the methods used at each step.
If you want to use this phylogenetic profiling pipeline for your research, you can find it in our GitHub repo (DOI: 10.5281/zenodo.14218627).
Clustering
Phylogenetic profiles of gene family evolutionary event counts at each node in the tree are evolutionarily and thus statistically non-independent. To account for this, we conducted a phylogenetic transform on the log10(x + 1) normalized count data 67, effectively returning residual trait variation not explained by shared evolutionary history (i.e., phylogeny) alone. To facilitate the clustering of gene families, we subsequently quantified multivariate Mahalanobis distances between all gene families using the transformed count data. For more details on our implementation of this approach, see 68.
We combined these approaches to develop a pipeline to conduct phylogenetic profiling using the outputs of NovelTree, implemented by the function run_phylo_profiling. In brief, this function takes formatted event count data (speciation, duplication, transfer, loss, or all four) and the inferred species tree from NovelTree and subsequently:
- Applies the phylogenetic GLS transformation to the event count data
- Calculates all pairwise multivariate distances among gene families using all event count data
- Constructs a k-nearest neighbor (kNN) graph of gene families where k = 10 and edge weights are specified as similarities where using dbscan 69 and igraph 70 after removing singleton (disconnected) components
- Clusters gene families using one or all of Leiden 71–72, Walktrap 73, or Infomap 74–75 clustering algorithms, optimizing for modularity
- Visualizes gene family clusters using t-distributed UMAP on the count data using the R package uwot 76, embedding gene families into a two-dimensional projection to facilitate visualization interactively with plotly 77
For downstream trait association tests, we used the clusters inferred by the Leiden algorithm because it maximized modularity. Before performing our trait association tests for each cluster, we conservatively removed Leiden clusters with less than 25 orthogroups. We made this decision because the small sample sizes in these clusters led to noisy parameter estimates, possibly due to a greater sensitivity to model initialization conditions and low statistical power. We removed these clusters to prevent possible spurious associations with our trait of interest.
Phylogenomic trait association tests
As previously mentioned, we developed a pipeline to implement hierarchical association tests to identify which gene families have evolutionary histories most predictive of suppressing host detection. Using all clusters containing at least five gene families, the pipeline:
- Calculates the mean event count (after phylogenetic GLS transformation) for each gene family across species that suppress host detection and those that don't, grouping mean counts within each cluster.
- Conducts logistic regressions to identify clusters composed of gene families with event count distributions that most strongly differ between itch suppressors and non-suppressors (Figure 4, A)
- Conducts post-hoc phylogenetic logistic regressions using the
phyloglmfunction from the phylolm R-package 78 for each gene family within the most strongly associated (i.e., p ≤ 0.05 & coefficient in top 10%) clusters, identifying gene families that positively predict whether species suppresses host detection (p ≤ 0.05, log-odds > 0: Figure 4, B–E)
We implement the per-cluster association tests in the cluster_assoc_test function, the post-hoc per-family tests in the test_fam_corrs_per_clust function, and plot results of these tests using the plot_cluster_traitcorr function.
We implement the entire pipeline on the chelicerate dataset in the “01_phylo_profiling_genefam_evol_counts.R” script.
Orthogroup filtering
After conducting our hierarchical phylogenetic trait association tests, we chose to move forward with all orthogroups that were positively and significantly associated with suppression of host detection (i.e., p ≤ 0.05). We then sought to narrow this pool of orthogroups down to families of putative salivary effector proteins that could be direct mediators. We filtered for orthogroups where DeepSig (v1.2.5) 79 predicted at least 50 percent of the proteins have signal peptides and removed orthogroups containing proteins that the DeepTMHMM web server (v1.0.42) 80 predicted to have transmembrane domains.
Next, we wanted to filter down to orthogroups that are transcriptionally expressed in the salivary gland. To do this, we took advantage of our previous transcriptomic studies 81–82 of the Amblyomma americanum (lone star tick) salivary gland. Using our expression analysis 82 of our previously generated salivary gland transcriptome 81, we scored each gene in the A. americanum genome as “salivary expressed” or not. We then required that at least 25% of A. americanum genes in each orthogroup were “expressed" in our salivary transcriptome data. As a caveat, this means that we dropped orthogroups without an A. americanum representative from the analysis. In future iterations, we'd love to incorporate salivary gland expression data from many more chelicerates to make this analysis more robust and less biased toward the biology of a single species.
As our final filter, we also required that the orthogroup must have a representative gene from at least six out of 15 tick species represented in our data and that across these tick species, at least 10 genes were present in the orthogroup. We chose to do this because ticks are our focal species in this analysis, and we reasoned that strong suppressors of host detection would be shared across ticks.
We used the “02_clusters-orthogroups-analysis.R” script to perform the filtering described in this section. The A. americanum salivary transcriptome expression table is on Zenodo in the file “tx2gene.tsv.”
Additional methods
We used ChatGPT to help write, clean up, and comment our code.
The results
Our trait association tests identify 10 candidate secreted salivary suppressors of host detection
To search for genes involved in the long-term suppression of itch, pain, and inflammation, we performed evolutionary comparisons across proteomes of 40 chelicerate species with varied traits involving parasitism and long-term suppression of host detection (Figure 3). The first step in this process was to define gene families (or orthogroups) using NovelTree 12. NovelTree identified a total of 31,160 orthogroups, 7,529 of which comprised five or more species and had a maximum mean per-species copy number of 20. Of these, 4,969 had a mean per-species copy number of 10 and were therefore more likely to be phylogenetically informative, so we used these to infer species trees using SpeciesRax 83 as implemented in NovelTree.
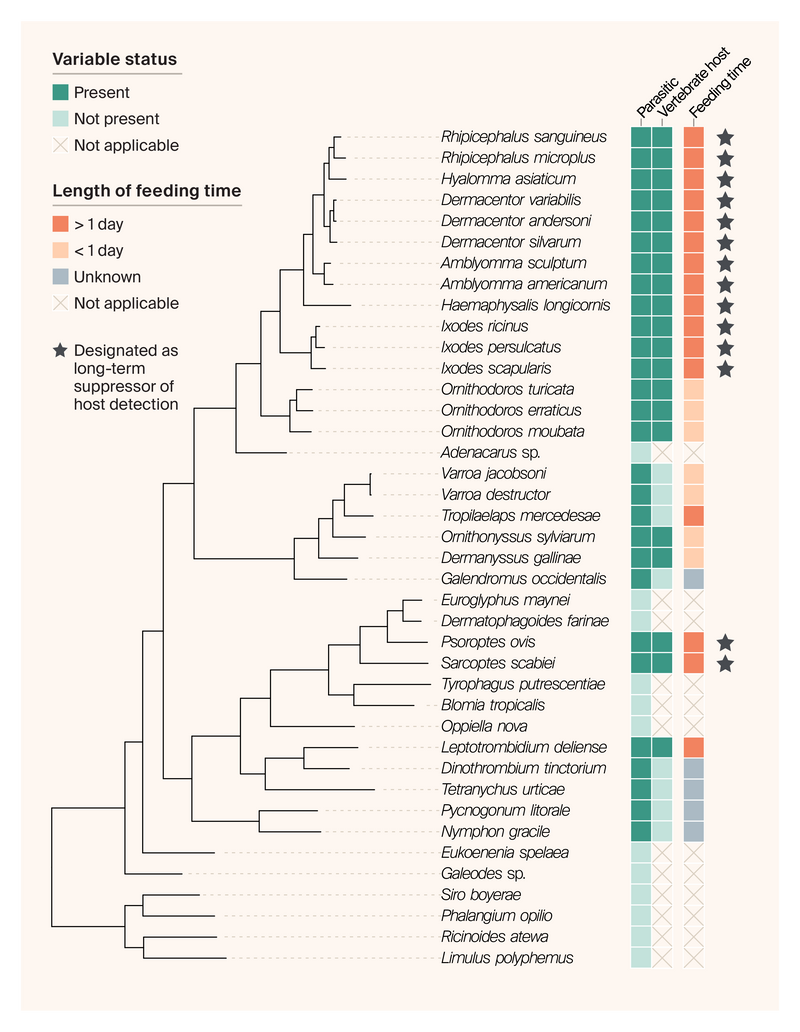
Figure 3. Species tree of the 40 chelicerate species studied here, as well as their life history and trait data.
Input proteomes are organized by the species tree on the left, which we inferred by SpeciesRax using 4,969 gene families containing at least five species with a maximum mean per-species copy number of 10 as implemented in NovelTree. We curated trait data manually through literature review. To be designated a long-term suppressor of host detection, an organism had to be parasitic, feed on vertebrates, have a feeding time > 1 day, and not be known to cause itch, pain, or inflammation immediately after biting its host.
Next, we applied our phylogenetic profiling pipeline to these 7,529 orthogroups. We clustered these orthogroups into 71 Leiden clusters and found that 46 were positively and significantly associated with suppression of host detection after correcting for multiple tests (false-discovery rate/FDR ≤ 0.05; Figure 4, A). These clusters are sets of orthogroups with evolutionary histories that aren't just highly similar across chelicerates, but also closely track the evolution of the suppression of host detection. From these 46 clusters, we focused our downstream investigation on those for which the estimated coefficient was in the 90th percentile for positively associated clusters. This led us to retain five clusters comprising 832 orthogroups and 19,693 genes (mean size = 23.7 genes, standard deviation/SD = 38.1).
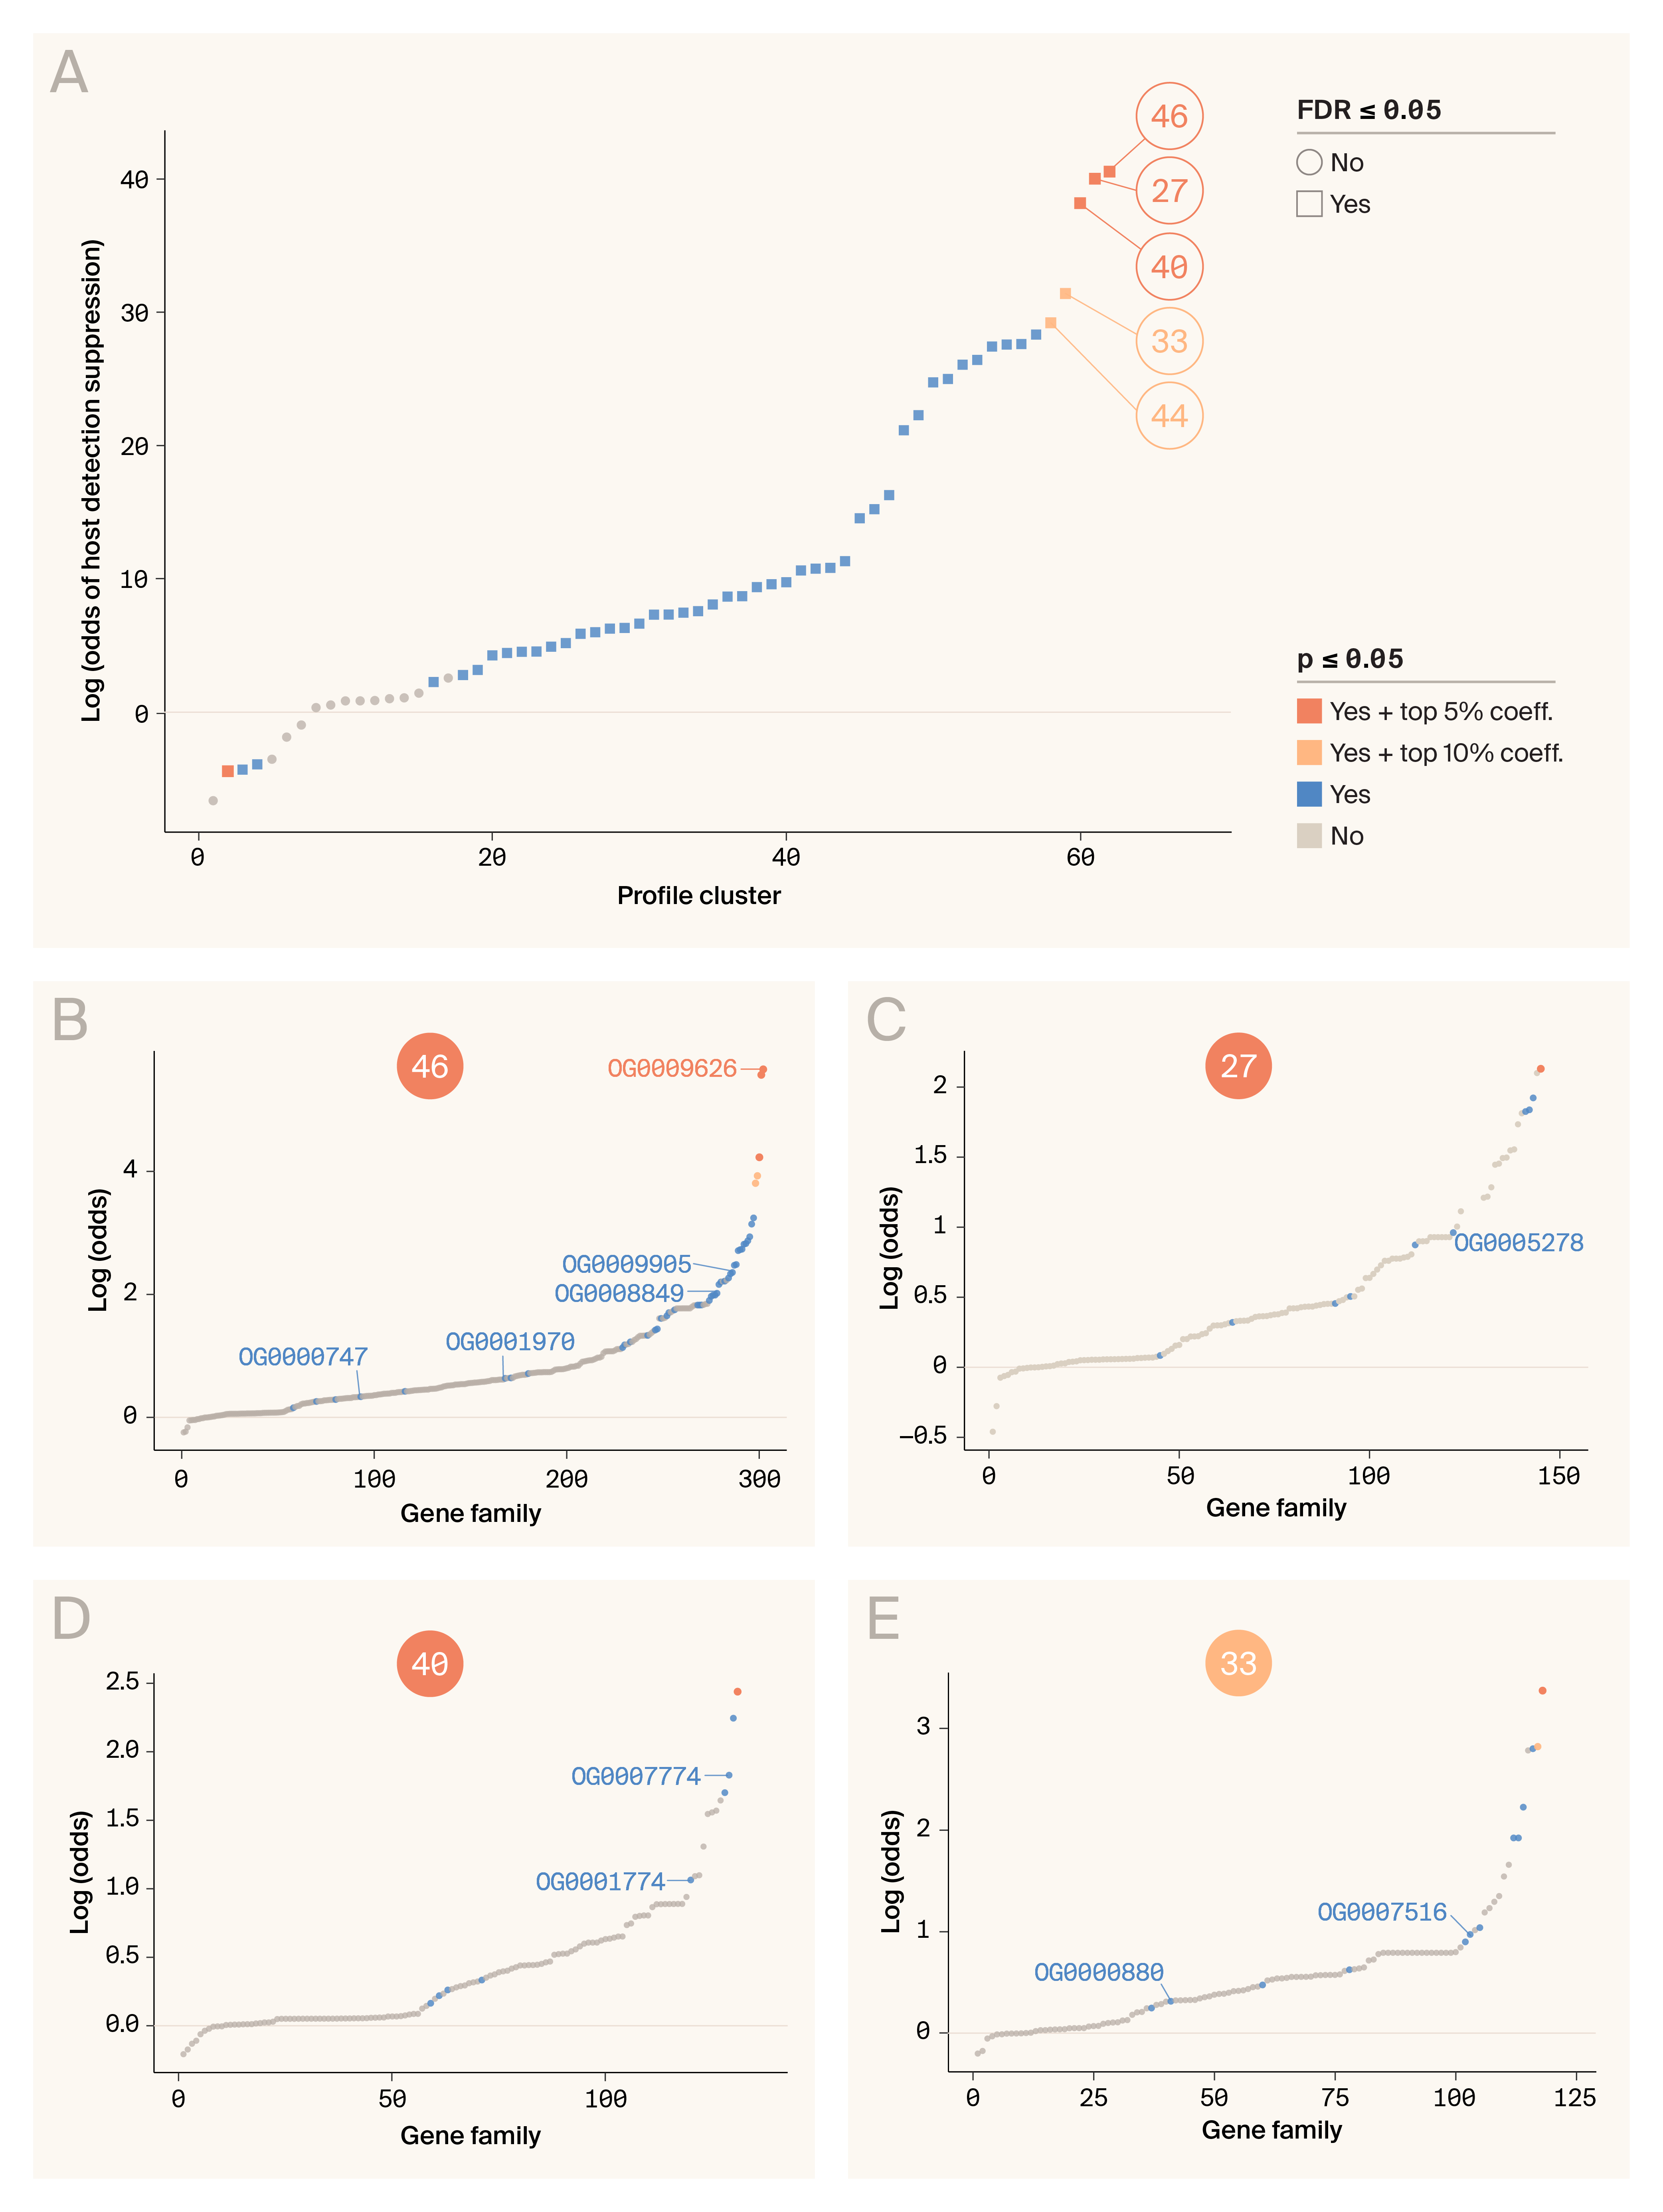
Figure 4. Hierarchical phylogenomic trait-association tests identify 87 gene families (orthogroups) with speciation counts that are significantly (p ≤ 0.05) associated with the suppression of host detection.
(A) Trait-association results for each of the 71 Leiden clusters of orthogroups identified according to patterns of phylogenetic profile similarity (i.e., counts of speciations, duplications, transfers, and losses at each node of the species tree). Clusters are plotted along the x-axis, ordered by increasing sign and strength of association. Clusters are plotted according to their strength and the significance of their association, as indicated by the key.
(B–E) Trait-association results for each gene family within profile Leiden clusters 46 (B), 27 (C), 40 (D), and 33 (E), using a phylogenetic logistic regression. Each gene family is plotted along the x-axis, ordered by increasing sign and strength of association, and points are colored/shaped according to the same key in A. In each plot, we have labeled the orthogroups that are families of secreted effectors. No gene families in cluster 44 met our filtering criteria for secreted effectors; therefore, this cluster isn't shown here.
After conducting post-hoc association tests for each orthogroup within these five clusters, we identified 87 orthogroups that are positively and significantly associated with the suppression of host detection (p ≤ 0.05: Figure 4, B–E). It’s worth noting, however, that none of these orthogroups remained significant (FDR ≤ 0.05) after correcting for multiple tests. This is perhaps to be expected given the size of our dataset (only 40 species and two independent origins of long-term suppression of host detection) and the number of tests conducted (19,693 total post-hoc tests).
To identify the orthogroups most likely to contain detection-suppressing effector proteins secreted into the host skin, we identified orthogroups that we predicted would be expressed in the salivary gland and secreted into the saliva. We also filtered out orthogroups that were very small (< 10 gene copies) or present in less than six out of 15 tick genomes, since we figured that potent suppressors of host detection would be widespread in ticks. After all these filtering steps, we ended up with 10 orthogroups of secreted effectors putatively involved with suppressing host detection (Table 3). One cluster, cluster 44, didn't have any orthogroups that met our criteria, so we dropped it from the analysis at this point.
| Orthogroup | Cluster | # of genes in orthogroup | Putative protein functions | log-odds | p-value |
|---|---|---|---|---|---|
| OG0000747 | 46 | 102 | Unknown | 0.341 | 0.017 |
| OG0001970 | 46 | 59 | Annotated as serum amyloid A protein [BLAST and Foldseek confirm] | 0.640 | 0.012 |
| OG0008849 | 46 | 16 | Unknown | 2.129 | 0.035 |
| OG0009626 | 46 | 13 | Unknown | 5.664 | 0.002 |
| OG0009905 | 46 | 12 | Unknown | 2.478 | 0.014 |
| OG0005278 | 27 | 39 | Annotated as fetuin-B; cystatin-SN; kininogen; cystatin-10 [BLAST and Foldseek confirm] | 0.960 | 0.048 |
| OG0001774 | 40 | 62 | Annotated as defensins, drosomycins (AMPs) [BLAST and Foldseek confirm] | 1.058 | 0.031 |
| OG0007774 | 40 | 22 | Foldseek hits to basic tail secreted proteins (function unknown) | 1.827 | 0.027 |
| OG0000880 | 33 | 93 | BLAST hits to acanthoscurrin-2-like proteins (AMPs) | 0.314 | 0.012 |
| OG0007516 | 33 | 24 | Unknown | 0.972 | 0.019 |
Table 3. Secreted orthogroups implicated in host detection suppression.
Each orthogroup is listed along with the original Leiden cluster from which it derived (Figure 4, A). We show the total number of genes in each orthogroup, the log-odds coefficient, and the p-value (not FDR-corrected) for each orthogroup’s association with the detection-suppression trait. To functionally annotate these orthogroups, we used common KEGG annotations found in this orthogroup, BLAST, and Foldseek. Of these 10 orthogroups, four had interpretable functional annotations across the orthogroup: OG0001970, OG0005278, OG0001774, and OG0000880. AMP stands for antimicrobial peptide.
SHOW ME THE DATA: Access the input proteomes, NovelTree inputs and outputs, and Amblyomma americanum gene expression data from this study on Zenodo. You can find our phylogenetic profiling methods and results on GitHub.
Exploring the candidate host-detection suppressors with annotations
Next, we’ll walk through the four orthogroups with clear annotations, discuss what we know about them, and speculate on how they may be involved in suppressing detection.
Serum amyloid A1-like proteins
OG0001970 comprises serum amyloid A1 (SAA1)-like proteins, which are highly conserved in vertebrates and involved in the inflammatory immune response 84. To our knowledge, SAA1-like proteins haven't been characterized in ticks, so our functional predictions of the tick SAA1-like proteins are derived from our understanding of SAA1 in vertebrates.
In humans, SAA1 is a well-known inflammatory biomarker, increasing over 1000-fold in serum during a systemic inflammatory response 84. Despite its strong correlation with inflammation, the functional role of SAA1 during a systemic inflammatory response is still poorly understood. In recent years, progress has been made in unraveling the role of SAA1 produced locally at tissue barrier sites. In the gut, SAA1 is implicated in generating inflammatory Th17 cells 85 and has been proposed as a potential drug target in irritable bowel disease 86. In the respiratory tract, SAA1 acts as a soluble pattern recognition receptor that binds lipocalin proteins from house dust mites, triggering an allergenic type II immune response 87. It's worth noting that house dust mites are also chelicerates, and lipocalins are a major class of secreted tick salivary effector proteins 88–90. These findings make us wonder if human SAA1 is involved in inflammation and immune responses in the skin, and whether it can also recognize tick lipocalins.
Thus, the role of the vertebrate SAA1 in chelicerate recognition, allergy, and inflammation suggests a potential role for the tick SAA1 in modulating the host immune response during tick feeding.
Cystatin proteins
OG0005278 is a family of cystatin proteins. The cystatin superfamily of proteins canonically functions to inhibit cysteine proteases 91. However, some subfamilies of cystatins have roles outside of protease inhibition. For example, the kinogen family has non-inhibitory alternative functions, including serving as precursor proteins for the production of kinin peptides 92. Fetuins, another subfamily of cystatins, are circulating proteins involved with immune regulation that have been shown to bind free fatty acids 93 as well as other circulating signaling molecules 94. Most characterized tick cystatins appear to act conventionally as cysteine protease inhibitors 95. Excitingly, many tick cystatins have anti-inflammatory effects 95–96. In humans, various cysteine proteases are involved in itch 97, pain 98, and inflammation 99–100, making inhibition of cysteine protease activity a plausible mechanism for ticks to suppress host detection.
Antimicrobial peptides (AMPs)
OG0000880 and OG0001774 are both annotated as antimicrobial peptides. OG0000880 is an orthogroup of acanthoscurrin-2-like proteins 101, and OG0001774 is a group of defensin- or drosmycin-like proteins. Defensins are a broad category of AMPs distributed across eukaryotes 102, and drosomycin is an insect defensin with antifungal activity 103–104. It’s possible that these peptides act canonically as antimicrobials, protecting ticks or the host from infection. This could enable longer feeding time by either directly protecting the tick from pathogenic colonization, or by preventing skin infection and subsequent inflammation in the host. However, defensins can have many noncanonical roles outside of antimicrobial defense 102, and some tick defensin-like proteins are known to act directly on host mast cells, where they can drive itch and inflammation in the absence of other salivary components 105.
While the potential of tick peptides to modulate immune cell activity is fascinating, it’s difficult to hypothesize more about the activity of these particular peptide orthogroups as we don’t know their target cell type (be it bacterial, fungal, or host immune cells).
Key takeaways
Using a combination of phylogenetic profiling, phylogenetic trait-association tests, and protein sequence features, we identified 10 gene families in chelicerates that may contribute to suppressing host detection. Of these, we could confidently assign a function to four using KEGG annotations and structural similarity. Two families are predicted to be AMPs, one is a family of cysteine protease inhibitors called cystatins, and the last family is of SAA1-like proteins. Promisingly, SAA1 is best known as an inflammation-associated protein in humans, and tick cystatins have been shown to have anti-inflammatory functions. Our success in finding two gene families with clear, intuitive ties to inflammation points to the potential viability of our approach.
Caveats
We're excited about the potential to use these kinds of phylogenetic approaches to identify gene families with human biology applications, and we hope this pub provides a framework for how others might do this. That being said, our approach comes with some caveats. First, our trait-mapping approach depends on our ability to properly label species as detection-suppressing or not, which is hard to do empirically or systematically with publicly available data. Also, although we got interesting hits, none of the individual orthogroups associated with the host detection suppression trait remained significant after correcting for multiple tests. We expect that increasing the size of our dataset to include more independent evolutionary origins of long-term suppression of host detection could increase our statistical power.
Next steps
At the end of the day, we see this work as an exciting strategy for generating hypotheses. We’ll be following up on some of our hits computationally to see if we can get more confidence about how they might act to modulate human skin biology.
Although the approach we’ve developed here has proven useful to us in charting a path forward, much is left to be done. For instance, we’d like to improve the statistical power of our gene family association tests. As implemented, our gene family association tests are quite conservative, as no individual gene family remained a strong predictor of host-detection suppression after correcting for multiple tests. Because we carried out thousands of individual association tests, the bar for individual gene families to be associated with a trait of interest is necessarily very high to mitigate the risk of identifying false positives.
We'd also like to implement recently described complementary approaches that account for evolutionary non-independence by borrowing from the field of statistical genetics 106. These have shown promise and were recently applied to study the contribution of gene family diversification to the evolution of metabolic traits in yeasts 107. To increase their utility for the broader scientific community, we aim to generalize these approaches into a reproducible package of standalone functions for any run of NovelTree.
Finally, since the statistical approaches we describe in this pub are still in development, we'd love your feedback on improving them.
Be the first to comment on this publication.