Purpose
We’ve been using Raman spectroscopy and microscopy as label-free techniques to explore biological phenotypes. We’ve previously shared our work with spontaneous (incoherent) Raman systems 1 on algae 2, bacteria, archaea, and reagents 3.
Here, we sought to use coherent Raman microscopy to acquire biochemical data on living cells at subcellular resolution as part of an effort to discover measurable phenotypes in genetically defined conditions. The two techniques differ in that spontaneous (incoherent) Raman typically has high spectral throughput, whereas coherent Raman has high imaging throughput. We focused on Schizosaccharomyces pombe and mutants dea2 and pdf1 for this dataset, which is part of a larger project using yeast as models for human disease.
We're sharing the raw data, key methods, and code for image visualization and export, along with metadata. We hope this will be useful to other researchers phenotyping this species and will add to the currently limited body of coherent Raman imaging data in biology.
The approach
We chose to work with the fission yeast Schizosaccharomyces pombe. S. pombe is a unicellular eukaryote that's been extensively researched as a disease model 4 and has a range of available mutants, making it a tractable platform for systematic phenotyping. This dataset includes the wild-type strain SP286 and mutant strains pdf1Δ and dea2Δ in the SP286 background. These genes are of interest to us because they encode putative orthologs of human proteins involved in disease. Developing rapid, label-free approaches to detect disease-relevant phenotypes in S. pombe should facilitate scalable screening and in-lab experimentation.
Coherent Raman microscopy has been relatively recently explored as a useful technique for observing live biological samples without the use of stains, tags, or dyes 5. It’s been applied to study yeast cells before, and can be used to easily distinguish subcellular features such as lipid droplets 6–7.
Strain information
Schizosaccharomyces pombe strains we used in this study were diploid and derived from the SP286 genetic background (h+/h+ ade6-M210/ade6-M216 ura4-D18/ura4-D18 leu1-32/leu1-32). Gene deletion strains (dea2Δ and pdf1Δ) were generated in the SP286 background. We obtained all strains used in this study (Table 1) from Bioneer.
| Strain ID | Genotype | Ploidy | Selection markers | Genetic background |
|---|---|---|---|---|
| SP286 | Wild type h+/h+ ade6-M210/ade6-M216 ura4-D18/ura4-D18 leu1-32/leu1-32 | Diploid | KanMX4 | SP286 |
| SPBC1198.02 | dea2Δ SP286 | Diploid | KanMX4 | SP286 |
| SPBC530.12c | pdf1Δ SP286 | Diploid | KanMX4 | SP286 |
Table 1. Strain information.
We acquired data on three strains of S. pombe.
Sample preparation
We grew three diploid S. pombe strains — SP286, pdf1Δ, and dea2Δ — in YES media at 30 °C and 200 rpm overnight until saturation. We pipetted 3 μL of dense cells onto a clean glass slide, within a 4 mm wax circle. We coverslipped the slide and sealed it with VALAP (1:1:1 vaseline, lanolin, paraffin). We immediately imaged the cells.
Acquisition details
We used two modalities of coherent Raman imaging, stimulated Raman scattering (SRS) and coherent anti-Stokes Raman scattering (CARS). Both selectively probe individual vibrational modes and generate significantly stronger signals than spontaneous Raman, enabling rapid, label-free imaging at specific wavenumbers using two synchronized laser beams. In SRS, the Raman signal appears as a small intensity modulation of the excitation beams and scales linearly with molecular concentration, making it well suited for quantitative imaging. CARS generates a blue-shifted anti-Stokes signal that can be detected with high sensitivity, but it also includes a non-resonant background that can complicate spectral interpretation.
We acquired all data using a Leica STELLARIS CRS Coherent Raman Scattering Microscope in both SRS and epi-CARS modes. We used a 40× water immersion objective (1.1 NA) and water immersion for the condenser. Each dataset has two key fields of view, selected based on cell density and immotility.
We acquired spectra for each sample between 2,800–3,000 cm−1 using the “lambda scan” mode at a single z plane, using the following parameters:
- Image size: 512 × 512
- Line scan speed: 400 Hz
- Line averaging: 2
- Pixel size: 0.11 µm
- Stokes laser wavelength: 1031.7 nm
- Stokes laser power: 0.3 W (45%)
- Pump laser step size: 0.5 nm
- Pump laser wavelength: 787.9–800.9 nm
- Pump laser power: 0.15 W (45%)
- SRS detector gain: 30%
- epiCARS detector gain: 50%
In a separate field of view, we acquired SRS and epiCARS images at eight different wavenumbers for each sample: 3,010, 2,970, 2,937, 2,850, 1,744, 1,650, 1,605, and 1,448 cm−1. These wavenumbers cover a range of biologically relevant modes, summarized in Table 2. We used the following acquisition parameters:
- Image size: 512 × 512
- Line scan speed: 200 Hz
- Line averaging: 2
- Pixel size: 0.11 µm
- Stokes laser wavelength: 1031.7 nm
- Stokes laser power: 0.3 W (45%)
- Pump laser wavelength: Varies
- Pump laser power: 0.15 W (45%)
- SRS detector gain: 30%
- epiCARS detector gain: 50%
| Wavenumber (cm−1****) | Modes | Example molecules | Citation |
|---|---|---|---|
| 3,010 | =C-H stretch | Unsaturated fatty acids | 8 |
| 2,970 | -CH3 stretch | Lipid, fatty acids, nucleic acids | 6 |
| 2,937 | -CH3 symmetric stretch | Lipids, proteins | 6 |
| 2,850 | -CH2 symmetric stretch | Lipids, fatty acid chains | 8 |
| 1,744 | C=O stretch | Neutral lipids | 9 |
| 1,650 | C=O stretch (amide I) | Proteins (peptide backbone) | 10 |
| 1,605 | C=C ring stretch | Ergosterol, aromatic amino acids | 9, 11 |
| 1,448 | CH2 bending | Lipids, proteins, hydrocarbons | 9 |
Table 2. Key wavenumbers for this dataset.
We acquired data for each sample at these wavenumbers, which correspond to biologically relevant bond vibrational modes.
Analysis details
We wrote code to visualize the dataset and export images and metadata. We used Python for all scripts and notebooks. We used arcadia-pycolor v0.6.5 to format the images generated in some of the example notebooks 12. The images can be exported as PNG and metadata in JSON and CSV format. More details about the software, dependencies, and environment are available in the GitHub repository.
AI usage
We used Claude (Sonnet 4) to help write, comment on, and review our code, then selectively incorporated its feedback. We used Claude (Opus 4.5) to review the pub and selectively incorporated its feedback. We also used Grammarly Business to suggest wording ideas and then chose which small phrases or sentence structure ideas to use.
The dataset
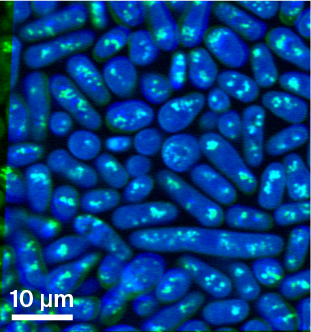
Figure 1. Representative SRS image overlay.
Composite image of two single-wavenumber SRS acquisitions, taken at 2,850 (green) and 2,937 cm−1 (blue).
Green: Lipid droplets within cells. Blue: Entire cell biomass.
The images in the dataset contain different fields of view of the S. pombe cells, which appear as elongated ovals or rods. Certain subcellular structures, such as lipid droplets, are easily visible at particular wavelengths. The single-wavenumber acquisitions can also be overlaid to produce a label-free composite that highlights various biomolecules (Figure 1).
Dataset access
Our imaging data, including raw LIF files and metadata files, is on Zenodo.
The code to visualize datasets and export images and metadata is on GitHub (DOI: 10.5281/zenodo.18478294), including CSV and JSON metadata.
Dataset limitations and caveats
As this dataset comes from living, unfixed cells in liquid culture, and the coverslips may not have perfect seals, there's movement between frames of the lambda scan and between the different single-wavenumber images. Also, while we didn't observe any noticeable damage to cells before and after laser exposure, this could have occurred. The exact wavelength we entered may differ slightly from the wavelength the laser tuned to (e.g., 2,937 vs. 2,936). Finally, the LIF files contain other acquisitions that aren't the focus of the primary dataset and visualization, and should be easily distinguishable by acquisition name. Relevant acquisitions typically follow the naming convention “Modality_mode_wavenumber_zoom_objective_FOV.”
Next steps
We may continue to add to this dataset and the associated collection as we work with S. pombe and mutants. If you use this dataset, please let us know your experience — what was helpful, what information we missed, and the utility of the code repository.