Purpose
We’ve been using Raman microscopy as a label-free technique to explore morphological and biochemical phenotypes. We’ve previously shared a dataset on fission yeast collected with this technique 1.
Here, we used coherent Raman microscopy to acquire biochemical data on living cells at subcellular resolution as part of an effort to discover measurable phenotypes in genetically defined conditions. We focused on Saccharomyces cerevisiae and mutants aah1∆ and rad6∆ for this dataset, which is part of a larger project using yeast as models for human disease.
We're sharing the raw data, key methods, and code for image visualization and export, along with metadata. We hope this will be useful to other researchers phenotyping this common model and will add to the currently limited body of coherent Raman imaging data in biology.
The approach
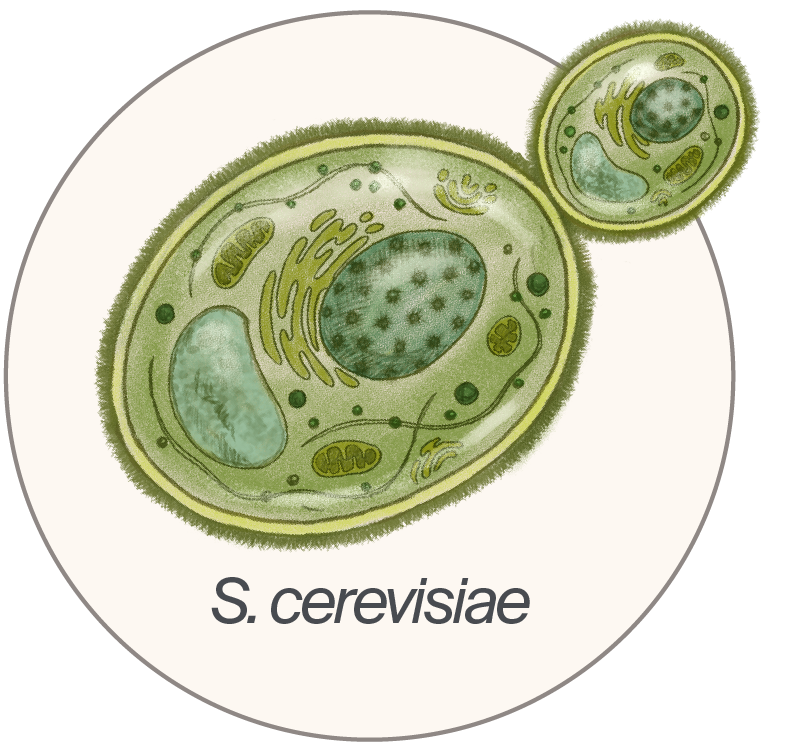
We chose to work with the budding yeast Saccharomyces cerevisiae. It’s a unicellular eukaryote that's a commonly used model for human disease development 2. This dataset includes the S. cerevisiae wild-type (WT) strain BY4741 and mutant strains aah1∆ and rad6∆ in the BY4741 background. These genes are of interest to us because they encode putative orthologs of disease-relevant proteins in humans (Aah1 is an ADA1 ortholog, and Rad6 is a UBE2A ortholog) 3. Finding simple yet sensitive ways to phenotype these strains helps accelerate in-lab experimentation with this model. We'll include more information about the larger project in upcoming pubs.
Coherent Raman microscopy has been relatively recently explored as a useful technique for observing live biological samples without the use of stains, tags, or dyes 4. It’s been applied to study yeast cells before, and can be used to easily distinguish subcellular features such as lipid droplets, which can serve as markers of disease 5–7.
Strain information
The Saccharomyces cerevisiae strains we used in this study were derived from the BY4741 background (MATa his3∆1 leu2∆0 met15∆0 ura3∆0). Gene deletion strains (aah1∆ and rad6∆) were generated in the BY4741 background. We obtained BY4741 from ATCC and aah1∆ and rad6∆ strains from EUROSCARF (Table 1).
| Strain ID | Genotype | Ploidy | Selection markers | Genetic background |
|---|---|---|---|---|
| WT | MATa his3∆1 leu2∆0 met15∆0 ura3∆0 | Haploid | None | BY4741 |
| aah1∆ | MATa his3∆1 leu2∆0 met15∆0 ura3∆0; YNL141w::KanMX4 | Haploid | KanMX4 | BY4741 |
| rad6∆ | MATa his3∆1 leu2∆0 met15∆0 ura3∆0; YGL058w::KanMX4 | Haploid | KanMX4 | BY4741 |
Table 1. Strain information.
We acquired data on three strains of S. cerevisiae.
Sample preparation
We grew three haploid S. cerevisiae strains — BY4741, YNL141w (aah1∆ mutant), and YGL058 (rad6∆ mutant) — in YPD media at 30 °C and 200 rpm overnight until saturation. For each sample, we pipetted 3 μL of dense cells onto a #1.5 coverslip clean glass slide, within a 4 mm wax circle. We flipped the coverslip onto an ethanol-cleaned glass slide and sealed it with VALAP (1:1:1 vaseline, lanolin, paraffin). We immediately imaged the cells.
Acquisition details
We used two modalities of coherent Raman imaging, stimulated Raman scattering (SRS) and coherent anti-Stokes Raman scattering (CARS). Both selectively probe individual vibrational modes, enabling rapid, label-free imaging at specific wavenumbers using two synchronized laser beams. More information about the different Raman modalities can be found here 1.
We acquired all data using a Leica STELLARIS CRS Coherent Raman Scattering Microscope in both SRS and epi-CARS modes. We used a 40× water immersion objective (1.1 NA) and water immersion for the condenser. Each dataset has two key fields of view, selected based on cell density and the absence of motility, for which we performed different acquisitions. We used a single culture per strain.
We acquired spectra for each sample between 2,800–3,000 cm−1 using the “lambda scan” mode at a single z plane, using the following parameters:
- Image size: 512 × 512
- Line scan speed: 200 Hz
- Line averaging: 2
- Pixel size: 0.11 µm
- Stokes laser wavelength: 1031.7 nm
- Stokes laser power: 0.3 W (45%)
- Pump laser step size: 0.5 nm
- Pump laser wavelength: 787.9–800.9 nm
- Pump laser power: 0.15 W (45%)
- SRS detector gain: 30%
- epiCARS detector gain: 50%
For the wild-type strain, we also acquired a lambda scan between 800–1,700 cm−1, which is expected to have a different set of biomolecular modes from proteins, lipids, and DNA/RNA 8.
In a separate field of view, we acquired SRS and epiCARS images at eight different wavenumbers for the WT and rad6∆ samples: 3,010, 2,970, 2,937, 2,850, 1,744, 1,650, 1,605, and 1,448 cm−1. These wavenumbers cover a range of biologically relevant modes. We used the following acquisition parameters:
- Image size: 512 × 512
- Line scan speed: 100 Hz
- Line averaging: 2
- Pixel size: 0.11 µm
- Stokes laser wavelength: 1031.7 nm
- Stokes laser power: 0.3 W (45%)
- Pump laser wavelength: Varies
- Pump laser power: 0.15 W (45%)
- SRS detector gain: 30%
- epiCARS detector gain: 50%
For the aah1∆, we only acquired the higher four wavenumbers, due to the cells moving. More information about the wavenumbers we elected to use can be found in Table 2 in one of our prior pubs 1.
Analysis details
We wrote code to visualize the dataset and export images, spectra, and metadata. We used Python for all scripts and notebooks. We used arcadia-pycolor (v0.6.5) to format the images generated in some of the example notebooks 9. The images can be exported as PNG or SVG, and metadata can be exported in JSON and CSV formats. More details about the software, dependencies, and environment are available in the GitHub repository.
AI usage
We used Claude (Opus 4.6 and Sonnet 4.5) to help write, clean up, comment, and review our code, selectively incorporating its feedback. We also used Grammarly Business to help clarify and streamline the text that we wrote. Additionally, we used Gemini (2.5 Pro) to review the publication and incorporated its feedback.
The dataset
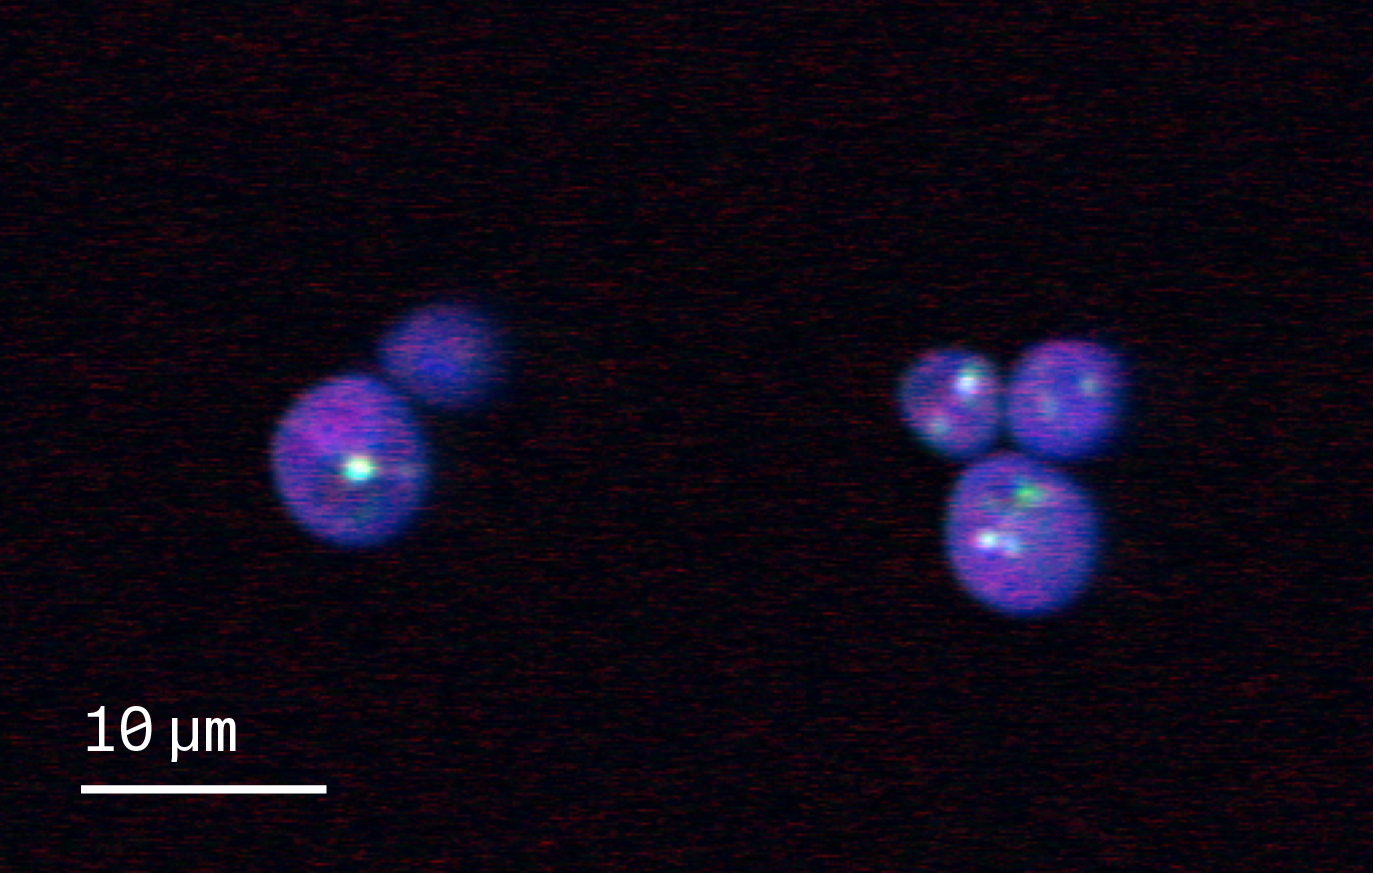
Figure 1. Representative SRS image overlay.
Overlay of three single-wavenumber SRS acquisitions of wild type S. cerevisiae. The acquisitions are taken at 1,650 (red), 2,850 (green), and 2,937 cm−1 (blue).
Red: Likely proteins in the cell biomass. Green: Lipid droplets within cells. Blue: Entire cell biomass.
The images in the dataset capture different fields of view of S. cerevisiae cells, which appear as circles. Certain subcellular structures, such as lipid droplets, are easily visible at particular wavelengths, and can be overlaid to make a composite (Figure 1).
Dataset access
Our imaging data, including raw LIF files and metadata files, is on Zenodo.
The code to visualize datasets and export images and metadata is on GitHub (DOI: 10.5281/zenodo.18750427), including CSV and JSON metadata.
Dataset limitations and caveats
As this dataset comes from living, unfixed cells in liquid culture, and the coverslips may not have perfect seals, there's movement between frames of the lambda scan and between the different single-wavenumber images. Also, while we didn't observe any noticeable damage to cells before and after laser exposure, this could have occurred. The exact wavelength we entered may differ slightly from the wavelength the laser tuned to (e.g., 2,937 vs. 2,936). Finally, the LIF files contain other acquisitions that aren't the focus of the primary dataset and visualization and are easily distinguishable by their acquisition names. Relevant acquisitions typically follow the naming convention “Modality_mode_wavenumber_zoom_objective_FOV.” For our first release, the aah1∆ set contains only single-wavenumber images in the higher-wavenumber region (above 2,700).
Next steps
We'll continue to add to this dataset and the associated collection as we work with S. cerevisiae and mutants. We also aim to analyze this dataset and our prior dataset on S. pombe to identify Raman markers for phenotyping. If you use this dataset, please let us know your experience — what was helpful, what information we missed, and the utility of the code repository.
Be the first to comment on this publication.