Purpose
Choosing an experimental organism is an important decision in biological research, yet these choices are often constrained by tractability or awareness of available options. We present the Organism Tractability Atlas, a surveyable map of the practical tractability landscape for ~15,000 organisms across the tree of life, which we plan to update periodically. We generated the atlas by systematically aggregating measurable signals of community activity, experimental infrastructure, experimental tooling, throughput capacity, and logistical requirements. We created an interactive resource to enable researchers to more easily navigate trade-offs between scientific fit and experimental tractability, identify underexplored organisms with strong existing infrastructure, and make more data-driven organismal choices. This work complements our other organism selection tools and resources by adding a critical tractability layer for practical decision making.
Introduction
Modern biology depends on model organisms, or species for which decades of investment have created rich experimental ecosystems. The concentration of research effort on a handful of models (mice, flies, worms, yeast, E. coli) enables unparalleled experimental power 1, but many biological questions demand exploration across broader phylogenetic diversity 2.
The challenge facing researchers isn't just which organism best fits their scientific question, but rather which organism offers the most tractable path forward 3. Can you obtain it? Grow it in your lab? Scale experiments to generate statistical power? Manipulate its genome? Is there a community to learn from? These practical questions often matter as much as, if not more than, phylogenetic position or protein similarity.
Organism selection benefits immensely from implicit knowledge: literature searches, conversations with colleagues, institutional memory. This works well within established model system communities but becomes opaque when venturing into less-studied organisms. A researcher might identify a phylogenetically ideal candidate through comparative genomics, only to discover months later that it requires specialized permits, depends on a bacterial food source, is no longer commercially available, or lacks any genetic manipulation protocols 4.
We hypothesized that public resources or discoverable proxies could help address pieces of this puzzle. Specialized databases like ATCC catalog commercial availability. NIH RePORTER tracks funding, which may reflect model maturity or community size. Individual model organism databases can provide deep knowledge or helpful protocols. The Alliance of Genome Resources integrates model organism databases (MODs), but no resource systematically maps tractability across the tree of life.
The resource: The Organism Tractability Atlas
We created a tractability atlas covering ~15,000 organisms that have available reference proteomes. We quantified organism tractability by surveying publicly available sources spanning four areas: community, logistics, throughput, and tooling. Rather than producing a single "tractability score," we preserved the multi-dimensional structure, revealing that organisms cluster into distinct archetypes defined by their differentiated tractability profiles. We present our findings in two formats:
- A database: Raw data where each organism is characterized across ~50 features spanning four tractability domains, together with a searchable interface.
- A visual map with a conversational interface: A feature space visualization that can be navigated via a natural language query system.
We encourage readers to explore the interactive tools directly before continuing through the analysis sections. The remainder of this publication explains how we built this resource, what patterns emerged, and how researchers might use it.
Methods
Defining the organism set
We began with organisms in UniProt's reference proteome collection 5, species for which reasonably complete protein sequence sets exist. This choice grounds our atlas in organisms where basic molecular resources are already available, while spanning phylogenetic diversity. From UniProt's initial set of ~960,000 proteome entries, and by selecting for highest genome and proteome assembly quality, we yielded ~15k organisms spanning Bacteria (~11k), Eukaryota (~3k), and Archaea (~1k).
Feature collection: Four domains of tractability
The core of our atlas is a structured collection of organism-level features 6. We designed these features around a practical question: What would you want to know before starting to work with an organism? We collected these features through either direct API (application programming interface) queries for sources that offer them, web scraping, or LLM-assisted answers. Our GitHub repo enumerates the features along with their respective sources and collection methods.
Community
These proxy the strength of research communities and include active funded research through the NIH, publications through PubMed, and published experimental protocols through protocols.io, among others.
Logistics
These determine whether you can obtain and maintain an organism. Examples of these include commercial availability through ATCC catalog presence, the biosafety level classification ranging from BSL-1 through BSL-4, whether special lab permits from agencies like the USDA or CDC are needed, and whether bacterial food source and host organisms are required for culture.
Throughput
These determine experimental scale and speed. Examples include 96-well plate compatibility, organism size and cellularity, as well as time to adulthood and doubling time. Note that reproduction mode (asexual vs. sexual), while an important factor, is not included in the current release.
Tooling
These indicate what genetic manipulation technologies exist for a given organism, including CRISPR, RNAi, mutagenesis, mutant libraries, vector systems, and GFP reporters, among others. Genomic resources deposited online, e.g., genes, proteins, and structures, were also included.
LLM-assisted answers
We collected some features (e.g., genetic tooling availability, CRISPR-readiness) through an initial web search followed by LLM reasoning over the search results (via the Exa answer endpoint). Answers are provided with reasoning, confidence scores, along with a citation list.
Dimensionality reduction and clustering
We preprocessed features for dimensionality reduction as follows. We normalized scalar count-like features (e.g., PubMed, ATCC) as . We encoded discrete categorical features with enumerated responses (e.g., yes/maybe/no, BSL level, cellularity, ploidy) as ordinal integers. We embedded free-text features using the OpenAI text-embedding-3-small model. We computed a two-dimensional UMAP 7 embedding (Python v3.12; umap-learn v0.5.11; numpy v2.4) to derive reference coordinates (Euclidean metric, n_neighbors=15, min_dist=0.1). We then applied HDBSCAN clustering 8 (hdbscan v0.8.41; min_cluster_size=10, other parameters default) to define reference clusters.
Additional methods
We used ChatGPT (GPT-5.1) to help write, clean up, and comment our code, suggest wording ideas, rearrange text to fit the structure of one of our pub templates, expand on summary text that we provided, and help clarify and streamline text that we wrote. We also used it to survey online data sources and identify meaningful tractability features to collect. We also used Claude (Sonnet 4) to suggest wording ideas, write text, and expand on summary text. We reviewed all AI-generated text and often edited it, and we verified all final text.
Emergent organismal clusters
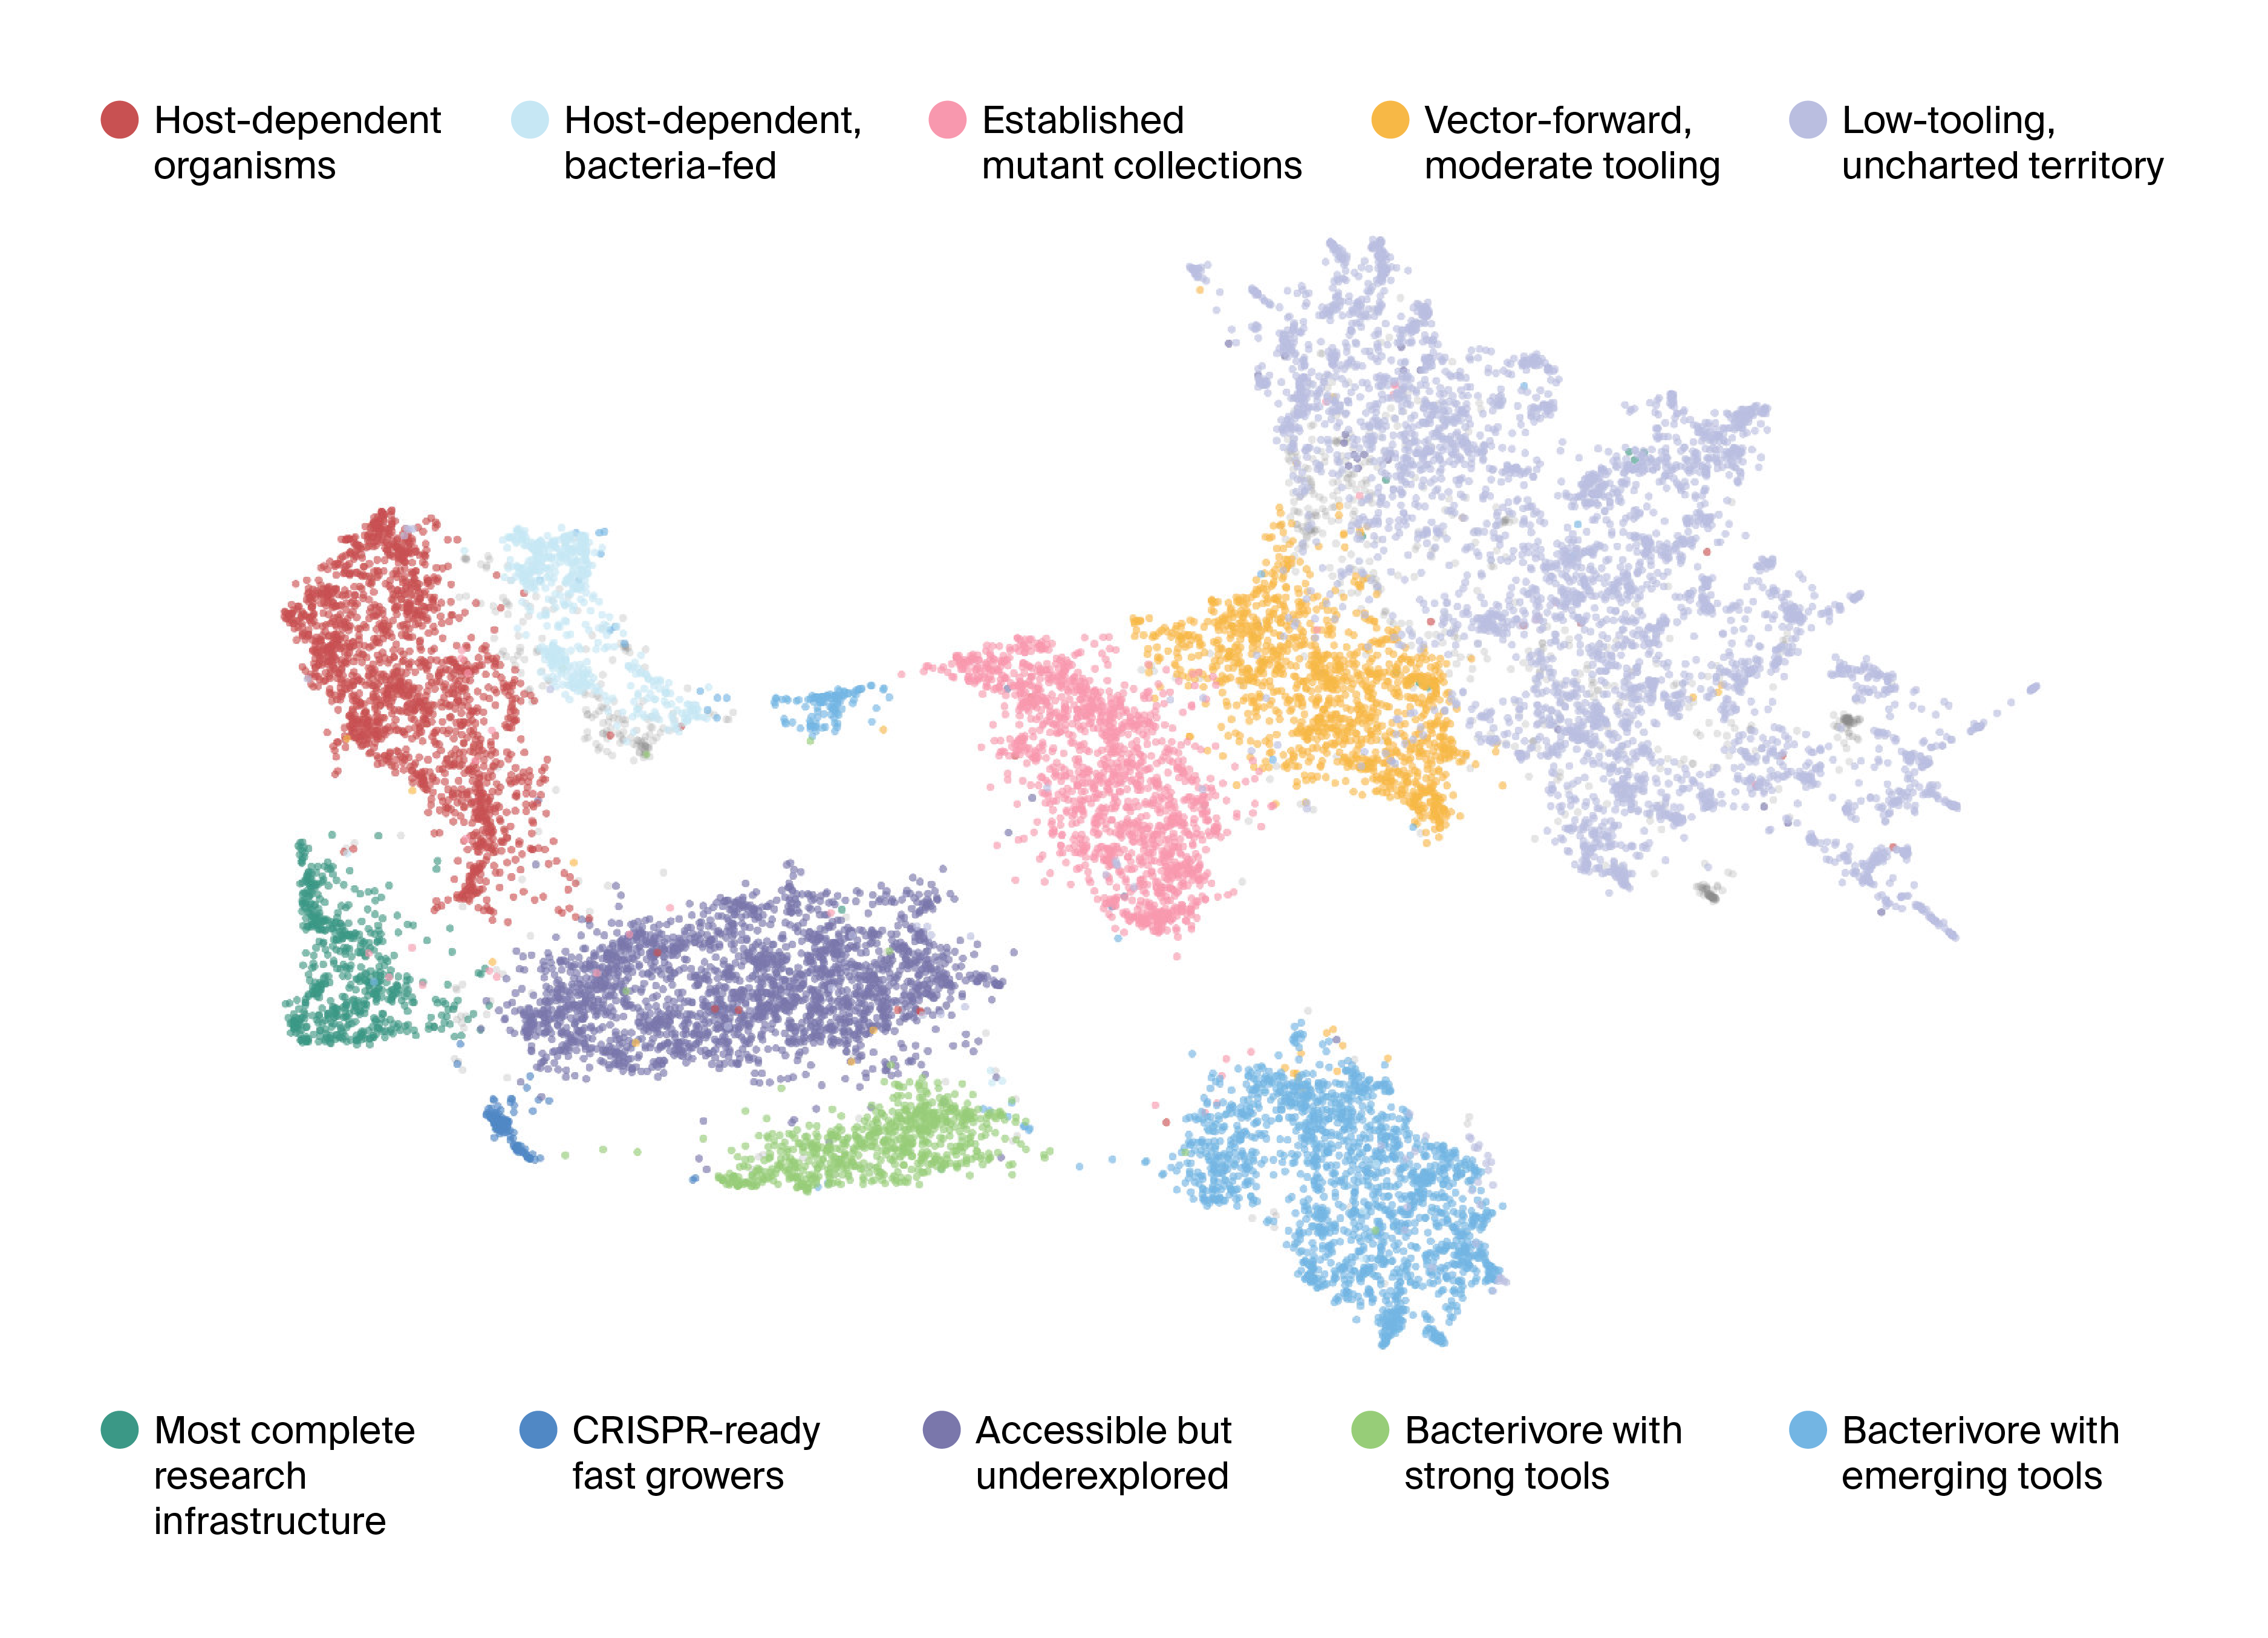
Figure 1. Organism Tractability Atlas: UMAP clustering of experimental accessibility profiles.
Two-dimensional UMAP embedding of organisms based on a multi-feature tractability profile. Each point represents an organism; proximity indicates similar experimental constraints and enabling tools. Points are colored by cluster, and clusters are annotated with qualitative labels (e.g., low-tooling/uncharted territory, vector-forward moderate tooling, CRISPR-ready fast growers, established mutant collections, etc.) to summarize dominant tractability archetypes.
With ~50 normalized features per organism, we needed a way to visualize the tractability landscape. We used UMAP (uniform manifold approximation and projection) to reduce the ~50-dimensional feature space to two dimensions for visualization.
If tractability were simply "easy vs. hard," we'd expect organisms to fall along a continuum. Instead, the UMAP reveals roughly a dozen distinct regions, each representing a tractability archetype, or a recurring pattern of strengths and limitations (Figure 1). This clustering reflected structure in the data stemming from:
- Common phylogenetic histories, which shape physiology and culture requirements
- Similar research community development, which shapes tool availability
- Convergent logistical constraints, e.g., host-dependent organisms
Cluster archetypes
We identified 10 major clusters and characterized each by its defining features. Here we walk through a few of these, noting what defines them with example organisms. More details about all clusters and their constituents can be found in the resource table.
Tool-rich multicellular models
These are the classic “supermodel” eukaryotes: starting here is like moving to a city with a dense subway map, reliable street signage, and a help desk on every corner. Even when the biology is complex, the day‑to‑day work is unusually well supported — reagents exist, workflows are standardized, and there’s institutional memory for what fails and how to fix it. In practice, the organism often fades into the background because the experimental infrastructure is so mature: you spend more time asking good questions than inventing basic methods.
Defining features:
- Deep community tooling (genome editing plus multiple orthogonal perturbation options)
- Standardized husbandry/culture with widely shared protocols
- Large ecosystem of reagents, strains, and commercial resources
- Well-developed phenotyping readouts and reproducible assays
- Strong “known-good” experimental playbooks across labs
Examples: Mus musculus (mouse), Drosophila melanogaster (fruit fly), Caenorhabditis elegans (nematode), Danio rerio (zebrafish), Arabidopsis thaliana (thale cress), Xenopus laevis (African clawed frog)
CRISPR-ready fast growers
This cluster feels like working on a tight feedback loop: build, edit, test, iterate — then do it again tomorrow. The organisms here tend to reward engineering-minded workflows, where genome editing isn’t a special event but a routine step in an experimental pipeline. The big advantage is cadence: when growth and genetic manipulation reinforce each other, you can explore larger design spaces, run more controls, and converge on conclusions faster.
Defining features:
- CRISPR is part of the “default toolkit,” not a bespoke one-off
- Short experimental cycles that support rapid iteration
- Practical transformation/delivery routes that work repeatedly
- Good fit for scalable screens, libraries, and multiplexed experiments
- Clear paths from genotype to measurable phenotype in common assays
Examples: Streptomyces thermocarboxydovorans, Methanocaldococcus sp., Sulfolobales archaeon, Capra hircus, Cucumis melo, Populus alba, Neurospora intermedia, Penicillium chermesinum
Accessible but underexplored
These are potential "opportunity zone" organisms. You can order them, grow them in a standard lab, and basic molecular biology works. However, they lack mature research communities and funding. Starting with one means you'll develop methods, but you won't be starting from zero. Haploidy (or effectively simple genetics) often makes experiments cleaner: perturbations show their effects quickly, and troubleshooting is more straightforward.
Defining features:
- Straightforward culturing and storage; easy to parallelize experiments
- Conventional DNA introduction and common reporter-style readouts
- Genetics that often yields fast, interpretable phenotypes
- Broad compatibility with routine lab automation and plate-based assays
- Low operational overhead relative to host-dependent systems
Examples: Methylomonas sp., Paenibacillus glacialis, Pseudomonas triticifolii, Methanothermobacter thermautotrophicus, Cocos nucifera, Penicillium rubens, Penicillium digitatum, Fusarium acuminatum, Candida africana, Aspergillus chevalieri
Host-dependent organisms
These organisms only grow inside or on another organism. While obligate parasites or symbionts offer immense potential for cool biology, host-dependency adds enormous experimental complexity 9.
Defining features:
- Requires host cells/tissues, co-culture, or a structured life cycle to maintain
- Fewer plug-and-play assays; readouts are often more constrained
- Scaling and throughput are harder because multiple systems must stay “healthy”
- Genetic manipulation can be possible, but less routine and more conditional
- Low commercial availability
- Low funding
Examples: Helicobacter ganmani, Campylobacterales bacterium, Promethearchaeota archaeon, Aigarchaeota archaeon, Symbiodinium microadriaticum, Opisthorchis felineus
The tractability ladder: Funding trails tools, access, and publications
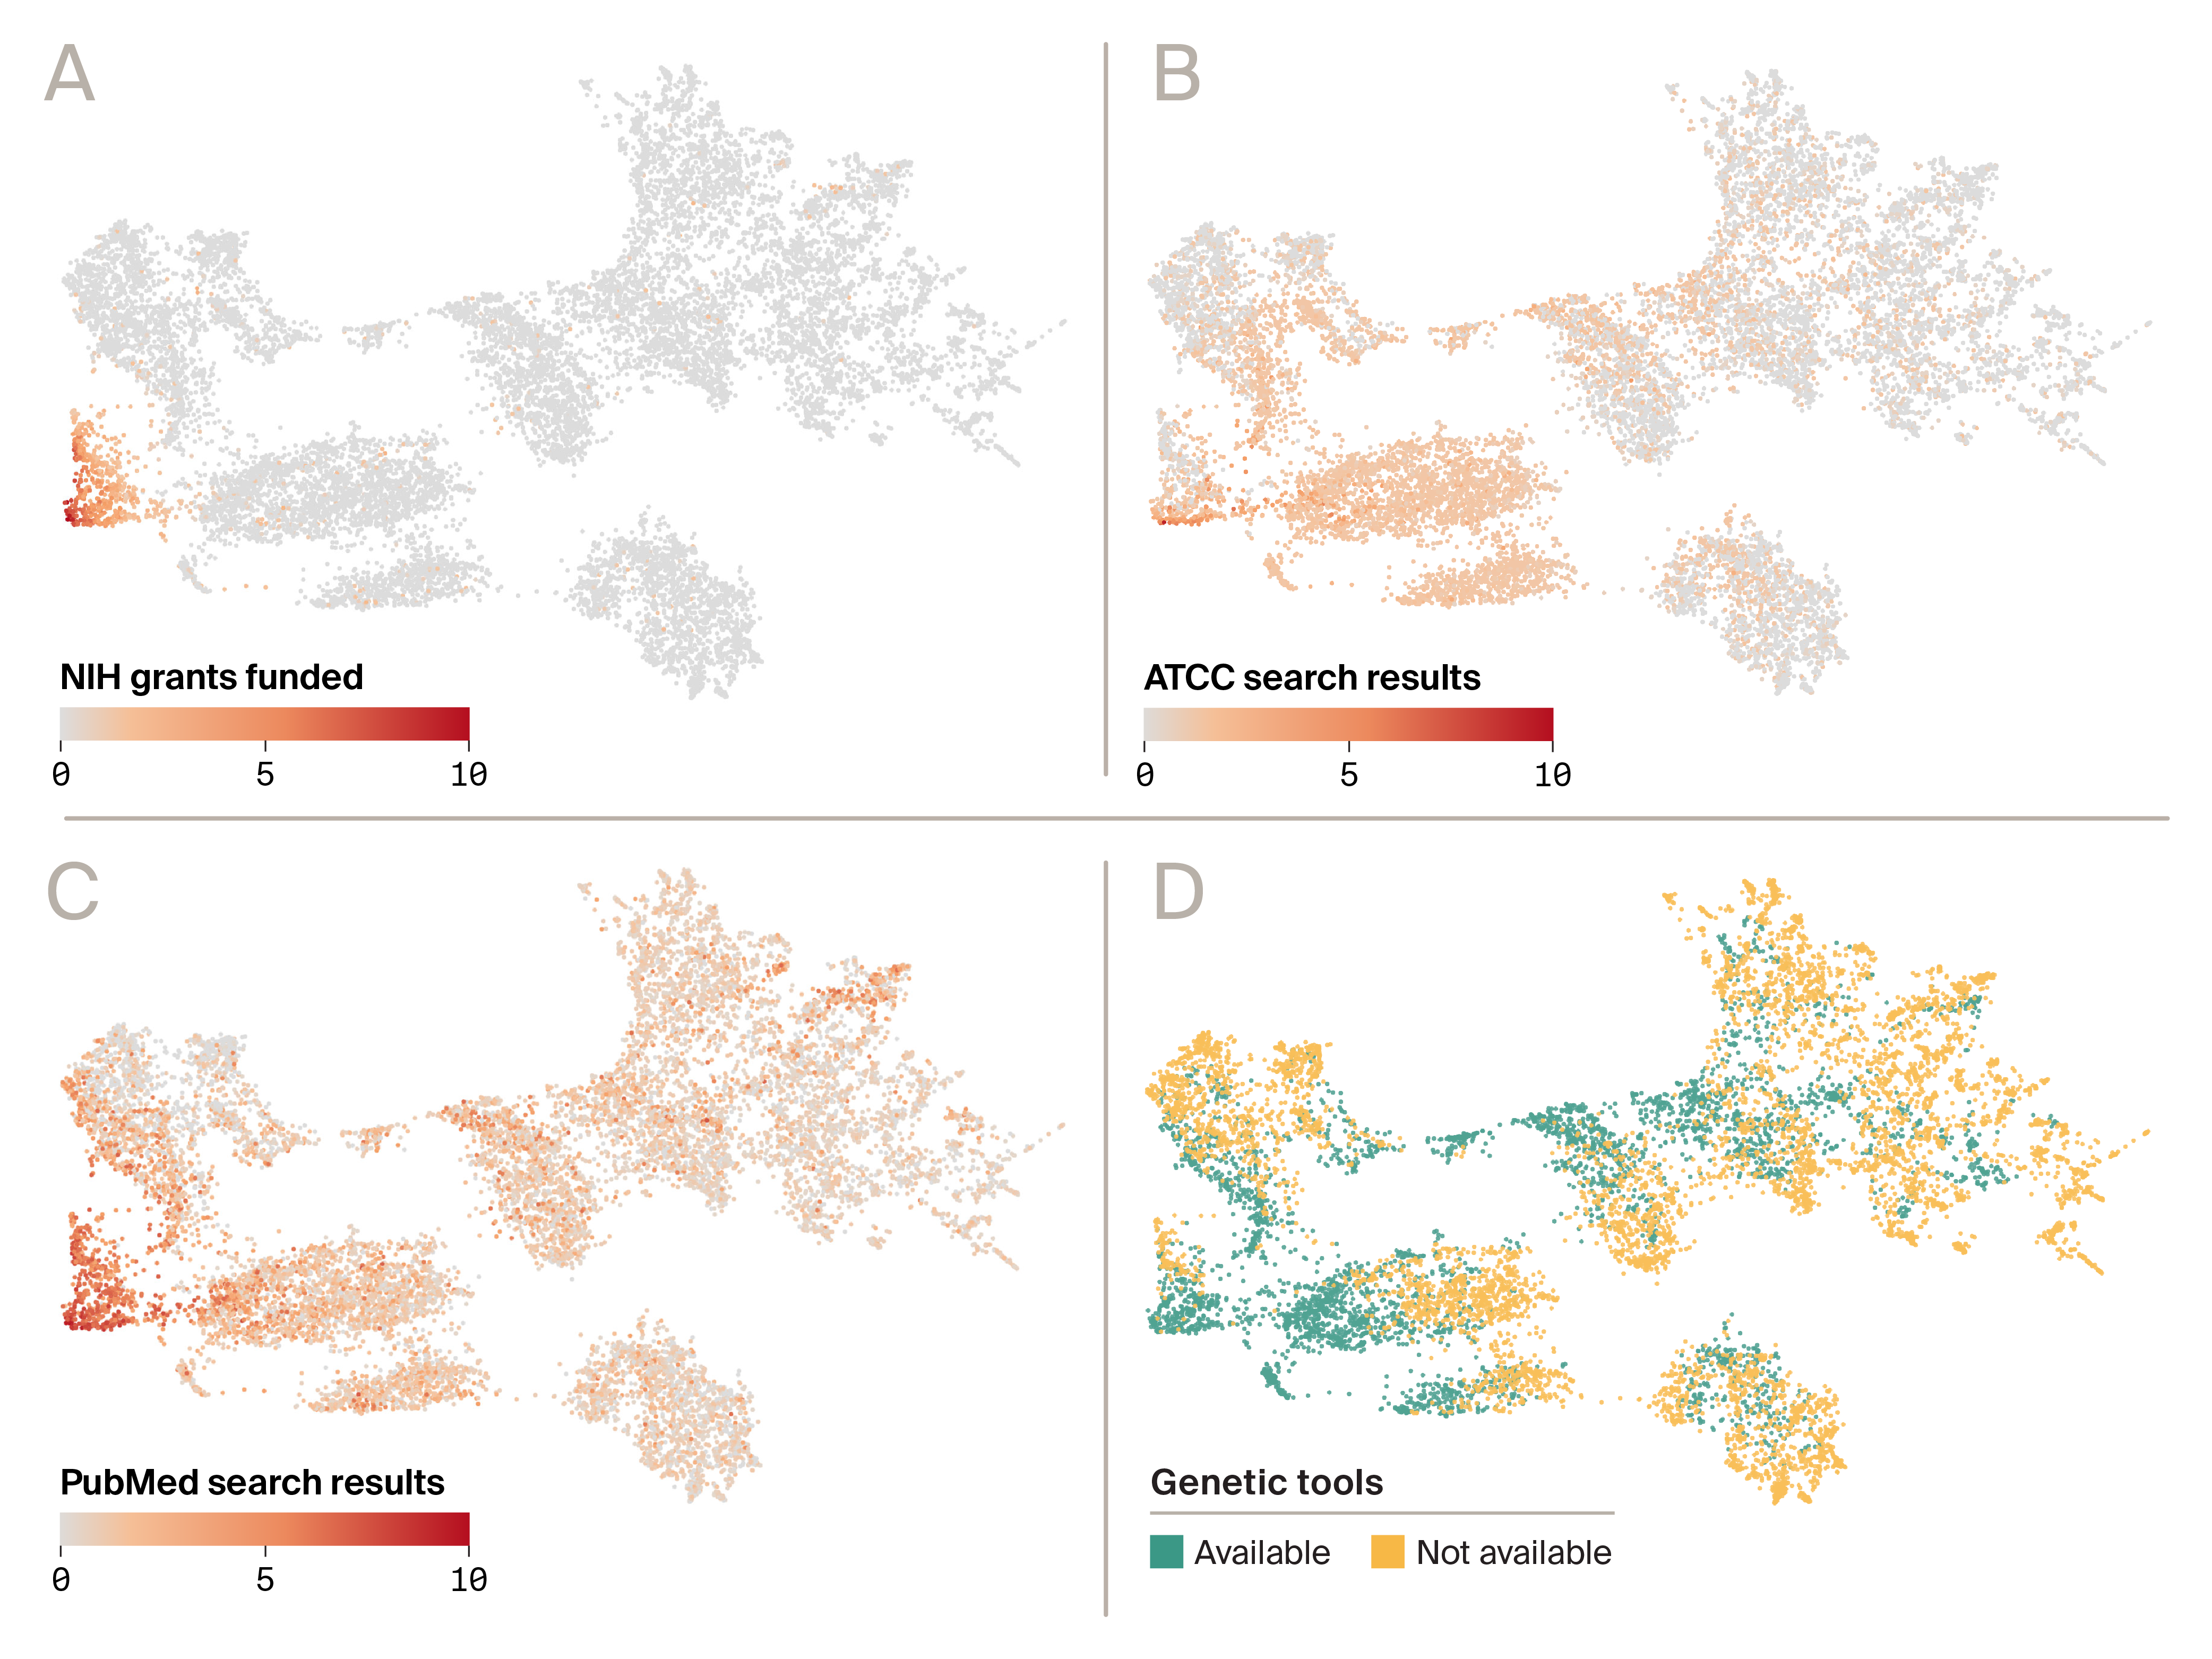
Figure 2. Differential penetration of tractability signals across the organism landscape.
Four-quadrant UMAP embedding of organisms shown with identical coordinates in each panel, recolored by a different tractability signal:
(A) Number of NIH grants funded
(B) ATCC search results
(C) PubMed search results
(D) availability of genetic tooling through web search and LLM reasoning.
A, B, and C are on a log scale, while D is categorical.
Across these four views (Figure 2), the same organism landscape is reinterpreted through successive layers of “tractability infrastructure.” Funding-related signals are concentrated in a relatively small subset of organisms, whereas publications, commercial availability, and genetic-tooling signals extend much more broadly across the map. This visual pattern is also reflected in simple coverage statistics: 4% of organisms show a nonzero NIH funding signal, compared with 33% with nonzero ATCC signal, 54.0% with nonzero PubMed signal, and 64% with genetic tools available. Taken together, the panels suggest a practical ordering in which funding is the narrowest layer, followed by commercial availability, publications, and tooling.
Limitations and caveats
A key caveat to keep in mind is that this atlas measures proxies, not ground truth. We infer tractability from public signals, not direct experimental experience.
Each feature comes with inherent limitations. For instance, the ATCC feature merely implies the presence of search results in the catalog. Genetic tooling availability is inferred from web search with LLM reasoning over the results, which may over- or underestimate actual tool accessibility and effectiveness despite citations, confidence scores, and detailed reasoning. LLM answers may be incorrect even when providing what appears to be well-supported analysis.
Funding data captures only NIH grants and shows US-centric bias plus historical bias from older, now-inactive research. Publication counts reflect research interest but not necessarily lab tractability, as some organisms are only studied through sequencing without actual culture work. Safety and permit classifications are often inferred from web searches and may be incomplete, outdated, or vary by institution.
Data freshness and coverage
We plan to refresh features on different schedules, which will be dictated in part by user engagement. This means that recent method developments (e.g., CRISPR papers from the last six months) may not yet be reflected. Newly deposited strains may not appear immediately.
In terms of organism coverage, we focused on organisms with reference proteomes that passed a BUSCO-defined assembly quality threshold 10. This excluded viruses, organisms without genome sequences, and organisms with very low-quality assemblies. Therefore, some ecologically or medically important organisms may not be represented.
The "tractability" we measure is biased
Most of our features represent a molecular and genetic bias. We emphasized genetic manipulation capabilities. Organisms excellent for field ecology, natural history, behavioral studies, and sequencing-based approaches may score poorly as a result. Our "tractability" is narrower than all possible research types.
Also, features like "ATCC availability" and "NIH funding" center US/European research ecosystems. An organism widely used in Japan or Brazil with different culture collections and funding may appear "unfunded" in our data.
What this atlas does not do
- It doesn't answer "what's the best organism for my question?" That requires knowing your question. We provide tractability context, but scientific fit is separate. For scientific fit, consider Arcadia's Zoogle tool or phylogenetic/comparative approaches.
- It doesn't replace community knowledge. If someone in your department has worked with an organism for 20 years, their tacit knowledge exceeds anything in this database.
- It doesn't track all relevant costs. We know some organisms are commercially available but don't track price, import/export restrictions, infrastructure needs.
Give the atlas a try
We hope the Organism Tractability Atlas is useful as a living resource that will evolve with community input and progress.
Explore the database and interactive visual map.
Our code is in this GitHub repo (DOI: 10.5281/zenodo.18601022), and the raw data are on Zenodo.
Whether you're selecting an organism for a new project, evaluating tractability for a grant proposal, or simply curious about what's experimentally possible across the tree of life, we hope this resource helps you make more informed decisions. Use the comments section to provide suggestions, corrections, or requests related to the atlas, as your input can help shape future releases.
Moving forward, we're thinking of adding a few additional features in future releases. Please vote in the poll below to help us evaluate which new features may be most useful:
Be the first to comment on this publication.