Purpose
Biological relationships, such as mappings between genotypes and phenotypes, are often nonlinear. Given their sensitivity to such nonlinearity, deep learning (DL) models seem likely to be broadly useful for biological research. However, the black box nature of DL models has so far hampered our ability to extract meaningful insights from them and has limited their utility. Recent mechanistic interpretability approaches may change this, enabling novel discovery from previously uninterpretable model architectures. Here, we use one such interpretability method — Equivalent linear mapping (ELM) — to decode biological signals from an empirical yeast genotype–phenotype dataset. We show that ELM recovers quantitative genetic effect sizes previously reported for this data using linear regression. Furthermore, we explore how individual-level genotype effects estimated by ELM can be used to probe the behaviour of genetic variants across genetic backgrounds. We demonstrate that this level of granularity reveals various forms of global epistasis, including both increasing costs and diminishing returns, which vary in prevalence across experimental environments. Finally, we show that shifts in global epistasis correlate with putative measures of growth condition harshness and associate with identifiable genetic determinants. We conclude that ELM works for empirical QTL datasets and demonstrates that the interpretation of DL models can lead to novel biological inference.
Background and goals
Understanding how complex phenotypes arise from genetic variation is a central challenge in biology. Efforts to understand such genotype–phenotype relationships have traditionally relied on linear regression-based approaches. While linear models are able to identify additive genetic contributions, they're not well suited to capturing nonlinear interactions like epistasis, at scale, an important but poorly understood component of genotype–phenotype maps. Deep learning (DL) models that can implicitly capture both linear and nonlinear effects are an enticing alternative to the limits of linear approaches; however, DL models are often black boxes, highly predictive but inscrutable. Shining light on these black boxes could reveal new aspects of the genetic architectures of complex traits, offering the opportunity to learn new biology from existing data. Interpretability methods offer a potential route to this. We recently explored one such method, Equivalent Linear Mapping (ELM) 1. When applied to DL models trained on synthetic genotype–phenotype data, ELM is able to estimate genotypic effect sizes by decomposing model predictions into a linear combination of inputs 2. Notably, these per-sample estimates recover familiar quantitative genetic statistics — additive effects and pairwise epistatic interaction terms — with high fidelity relative to known ground truth.
A key open question is whether ELM recovers meaningful biological signals from real data, where measurement noise, linkage disequilibrium, and polygenic complexity complicate genotype–phenotype mapping. Here, we use ELM to interpret neural networks trained on a dataset of ~100,000 yeast F1 segregants whose growth was measured across 18 environments 3. We consider this a stringent test of ELM: it combines realistic sample sizes and noise levels with a well-characterized genetic architecture, allowing direct validation of ELM-derived estimates against previously published linear regression parameters.
We show that ELM-derived additive and epistatic effect estimates are tightly correlated with published linear regression coefficients, confirming that ELM recovers meaningful quantitative genetic signal from real data. We then exploit the individual-level resolution that ELM provides — per-segregant variant effect estimates that are inaccessible to conventional linear approaches — to ask how variant effects change across genetic backgrounds. This analysis reveals widespread global epistasis across all 18 environments. ELM detects both amplification (increasing costs) and attenuation (diminishing returns) of variant effects with increasing background fitness. Strikingly, the direction of this scaling shifts across environments: benign growth conditions are dominated by increasing costs, while harsh environments appear to shift toward diminishing returns. We trace this environmental dependence to a small set of epistatic hub loci whose pairwise interaction terms are sign-enriched in benign environments. This is consistent with co-adaptation between parental alleles under the conditions in which the parental strains were maintained. DL models coupled with ELM reveal broad aspects of complex trait architecture that are invisible to conventional approaches, opening new pathways for biological understanding.
The approach
Genomic data and QTL inputs
We applied ELM to growth phenotype data from a panel of ~100,000 barcoded F1 segregants derived from a cross between the BY and RM yeast strains, as described by Nguyen Ba et al. 3 Briefly, fitness in each of 18 environments was measured by bulk competition assay and barcode frequency tracking across ~50 generations of serial passaging. For each environment, we used the set of lead QTL SNPs previously identified by the original authors 3 via a cross-validated forward search. These per-environment QTL sets served as the input feature space for our neural networks, with analyses for each of the 18 phenotypes conducted independently. We filtered out segregants with missing phenotype values for any given environment. Phenotype values were standardized to zero mean and unit variance prior to model training; a per-phenotype standard deviation scalar was retained to rescale sensitivity values back to original fitness units during downstream analysis. Probabilistic genotype calls (posterior probability of the RM allele, ranging continuously from 0 to 1) were rescaled to a −1/+1 encoding via the transformation 2x − 1, such that the BY and RM alleles correspond to −1 and +1, respectively, so that both allelic states produce nonzero activations in the bias-free network, allowing the model to learn effects for both alleles. For downstream analyses that required discrete allelic states (such as assigning genotypic combinations across pairs of sites), we assigned discrete allelic states based on a cutoff at 0.
Model architecture and training
We trained a two hiddenlayer multilayer perceptron (MLP) for each phenotype independently, using only the lead QTL loci identified for that environment as input features. The network consisted of an input layer of size n (where n is the number of QTLs for the focal environment), two hidden layers of size 1,024, and a single-unit linear output layer. All layers were implemented without bias terms, which is a requirement for the Jacobian to accurately reconstruct model outputs under ELM (see Golden et al. 1). Leaky ReLU activations (negative slope 0.01) were applied after each hidden layer.
Models were trained using the AdamW optimizer with a learning rate of 1e−4 and weight decay of 1e−4 using PyTorch (v2.5.1) 4. The loss function was mean absolute error (MAE). We used a ReduceLROnPlateau learning rate scheduler that halved the learning rate after three consecutive epochs without improvement in validation loss, and implemented early stopping with a patience of 10 epochs and a minimum improvement threshold of 0.003 on the validation loss, with a maximum of 100 epochs. Data were split 85%/15% into training and test sets; model performance was evaluated as Pearson's r and R2 between predicted and true phenotypes in the held-out test set.
Applying ELM to extract locus sensitivities
Under a quantitative genetic model with additive effects and pairwise epistatic effects phenotype is given by:
Where and denote the allelic state (−1/+1) at each QTL/locus in the genome. We ignore any residual error, as it is, in practice, unlearnable by the model. Following Golden et al. 2, we applied ELM by computing the Jacobian of the trained model with respect to 8,000 random test-set strain inputs using PyTorch automatic differentiation. The ELM sensitivity of locus in a given individual/strain (assuming the above quantitative genetic model of a phenotype) is given by:
Where is the predicted phenotype for an individual sample. As shown in Golden et al. 1, because our MLP uses only bias-free linear layers and homogeneous-order-one activation functions (Leaky ReLU), the standard Jacobian computed via automatic differentiation provides an exact equivalent linear representation of the model, exactly recovering the phenotypic prediction via a simple linear sum:
Sensitivity values were computed for 8,000 test-set samples per phenotype and rescaled to original fitness units by multiplying by the per-phenotype standard deviation. All downstream analyses were conducted using these rescaled sensitivity values.
Estimating marginal effects
As described in Golden et al. 2, the expected locus sensitivity averaged across a population of test-set individuals approximates the marginal additive effect of that locus:
where is the additive effect and allele frequencies at interacting loci are approximately 0.5, a reasonable assumption for an F1 population. We estimated additive effects as the mean locus sensitivity across all test-set individuals and compared these estimates to the marginal (additive-only model) effect sizes reported by Nguyen Ba et al. 3 for each environment.
Similarly, the variance in locus sensitivity provides an estimate of the total (squared) epistatic contribution of each locus:
Estimating pairwise epistatic effects
To estimate pairwise epistatic interactions between loci, we used genotype conditioned mean sensitivities as described in 2. Briefly, for a pair of loci and , we stratified test-set individuals by their joint genotype at the two loci ({−1,−1}, {−1,+1}, {+1,−1}, {+1,+1}) and computed the mean sensitivity of locus in each genotype class. The epistatic effect between the pair was estimated as the extent to which the sensitivity of one locus is modulated by the allelic state of the other:
with a symmetric estimate computed from locus 's sensitivities. The final epistatic estimate was taken as the sum of these two independent estimates (to make it comparable to the single linear regression interaction term), , and rescaled to original fitness units. Because genotypes are encoded as −1/+1 while the published epistatic effects from 3 use a [0,1] encoding convention, we applied a factor-of-4 correction when comparing parameter estimates between the two frameworks.
Locus pairs were filtered to retain only those for which each of the four genotype classes was represented by at least 10% of the total sampled individuals, to prevent noisy estimates from sparsely occupied genotype combinations from distorting comparisons.
Sensitivity-based dimensionality reduction
To characterize the global structure of sample-level sensitivity variation, we performed PCA on the matrix of per-sample locus sensitivity values. Prior to PCA, the sensitivity matrix was standardized column-wise to zero mean and unit variance across samples, so that loci with different absolute sensitivity magnitudes contributed comparably to the decomposition. PCA was performed using scikit-learn (v1.6.1). To assess which biological signal each principal component captured, we computed Pearson correlations between PC scores and two sample-level metadata variables: individual fitness (true phenotype value) and genome-wide ancestry fraction (mean RM allele frequency across all QTL loci). We additionally fit multiple regression models predicting PC scores from fitness and ancestry jointly, decomposing explained variance into unique contributions from each variable and their shared component.
Identifying hub loci
Hub loci were defined as QTL with disproportionately high locus sensitivity variance across samples. Variance in sensitivity is expected to scale with the square of a locus's epistatic effect (see above), providing a model-free screen for epistatic activity. For each environment, we ranked QTLs by their sensitivity variance and designated the top 15 as candidate hub loci for subsequent analyses.
Sensitivity–fitness correlation as a measure of global epistasis
For each QTL in each environment, we computed the Pearson correlation between per-sample sensitivity values and per-sample phenotype (fitness) values across test-set segregants. Because sensitivity values can be positive or negative depending on allelic direction, and because the sign of a locus's marginal additive effect () determines which direction of fitness scaling corresponds to diminishing returns versus increasing costs, we applied a sign correction: the correlation was multiplied by , where is the mean sensitivity of locus across test-set samples. This correction makes the resulting statistic comparable across loci with different allelic polarities, with positive values indicating increasing costs epistasis (sensitivity grows with fitness background) and negative values indicating diminishing returns (sensitivity shrinks with fitness background).
We also computed a complementary slope statistic, which has a natural theoretical interpretation (see below) and was sign-corrected in the same manner.
Theoretical prediction of sensitivity–fitness slopes
The slope of regressing on background fitness — the quantity we estimate empirically — is given by:
Substituting the expression for with and noting that is constant with respect to the covariance, this simplifies to:
Approximating , which holds when the marginal additive effect of locus isn't strongly affected by collinear loci, gives the closed-form prediction:
This result has an intuitive interpretation: the global epistasis slope at a focal locus is a sum over all its epistatic partners, weighted by both the strength of the interaction () and the partner's own marginal effect on fitness (). Loci with large positive marginal effects that also interact positively with focal locus will drive positive (increasing costs); loci with opposing sign alignment will drive it negative (diminishing returns). We again apply a sign correction using the average sensitivity value's sign to make slopes comparable across loci with different allelic polarities, as described above.
In practice, because a small number of hub loci account for the majority of pairwise epistatic variance, we restricted the sum to interactions involving hub loci only, using the top 3, 5, 10, or 15 hubs per environment (ranked by sensitivity variance). We substituted ELM-derived mean sensitivities for , and ELM-derived pairwise epistatic estimates for . Predicted slopes were compared to empirical slopes for non-hub loci, with concordance evaluated by Pearson's r and regression slope.
Hub-specific contributions to global epistasis
To quantify each hub's individual contribution to the genome-wide pattern of global epistasis, we computed, for each hub and each non-hub locus that interacts with , the signed contribution term:
For a given hub , the distribution of across all non-hub partner loci () captures both the magnitude and direction (we again correct for sign based on mean sensitivity at the non-hub locus) of that hub's contribution to global epistasis: hubs with predominantly positive values drive increasing costs epistasis, while those with predominantly negative values drive diminishing returns. We visualized these distributions summarizing each hub's behavior (in each environment) by the hub's median, and variance contribution to non-hub slopes. To enable comparison across environments with different overall epistatic magnitudes, we normalized each hub's median and variance contributions within each environment by the sum of absolute medians and total variance, respectively, such that all hubs sum to unity within each environment.
Cross-environment comparison of global epistasis
To compare global epistasis patterns across the 18 environments, we summarized each environment by the median sign-corrected sensitivity–fitness correlation across all QTLs. We used two proxies for environmental harshness: 1) the skewness of the fitness distribution in that environment, reflecting the extent to which a long tail of low-fitness lineages was present, and 2) the Pearson correlation of per-environment fitness values with those measured at 30 °C, as a reference benign condition. Both metrics were correlated with median global epistasis slope across environments using Pearson's r. To rule out the possibility that differences across environments reflected artifacts of environment-specific QTL sets, we repeated all analyses using a common set of LD-pruned QTLs from 5, training separate neural networks for each environment on this shared input feature space.
Code, including notebook templates to replicate our results, is available in our GitHub repo (DOI: 10.5281/zenodo.20546760).
Additional methods
We used Claude (Opus 4.6 and Opus 4.8) to help write code, review our code and selectively incorporate its feedback, write text that we edited, suggest wording ideas and then chose which small phrases or sentence structure ideas to use, help clarify and streamline text that we wrote, and help copy-edit draft text to match Arcadia's style. We also used Grammarly Enterprise to help copy-edit draft text to match Arcadia's style.
We used arcadia-pycolor (v0.73) 6 to generate figures before manual adjustment.
The results
Access the raw data on Zenodo (DOI: 10.5281/zenodo.20435074).
Neural network training and performance
Before applying ELM we must first train a set of G–P models, and then evaluate whether they have learned any meaningful biological signal from the training data. To achieve this we trained a series of neural networks using the environment-specific lead QTLs identified by Nguyen Ba et al. 3 as genotypic predictors of (environment-specific) growth rate. We evaluated model performance on 15% of withheld (test set) data. On average, our neural networks achieved an of 0.59 across all growth environments, with ynb (YNB without amino acids) exhibiting the poorest performance ( 0.48) and raff (raffinose) exhibiting the best ( 0.63). This closely mirrors the predictive performance of various models previously trained on this dataset, including the top/bottom ranking of ynb and raff 3, 5, 7. Given the dimensionality of the input space and levels of measurement/environmental noise previously estimated for these phenotypes, we suspect that our models are capturing the majority of learnable first and second-order G–P signal for these data (see Appendix 4 in Nguyen Ba et al. 3).
Summary statistic comparisons
Once we have obtained performant models, we are able to start applying ELM to our test set datapoints to explore the G–P mappings the neural networks have learned. ELM extracts per-sample effect estimates by decomposing each model prediction into a linear combination of its inputs via the Jacobian. This yields a sensitivity value for each QTL in each individual that approximates the contribution of that locus to the predicted phenotype, conditioned on that individual's genetic background 2. By calculating summary statistics of sensitivity values such as means, variances, and pairwise genotype conditioned means, ELM allows us to estimate standard quantitative genetics parameters such as additive and pairwise epistatic effect sizes. Such parameters, normally estimated by linear regression, are the standard currency of quantitative genetics, providing a natural first validation of whether ELM recovers biologically meaningful signal from models trained on real data. We compared our ELM-derived additive and pairwise epistatic effect estimates to the original linear regression coefficients estimated by Nguyen Ba et al. 3 For additive effects, since ELM doesn't allow us to easily estimate a conditional additive effect, we compared average sensitivity values to the authors' additive-only effect sizes; this way, both reflect the same marginal additive effect.
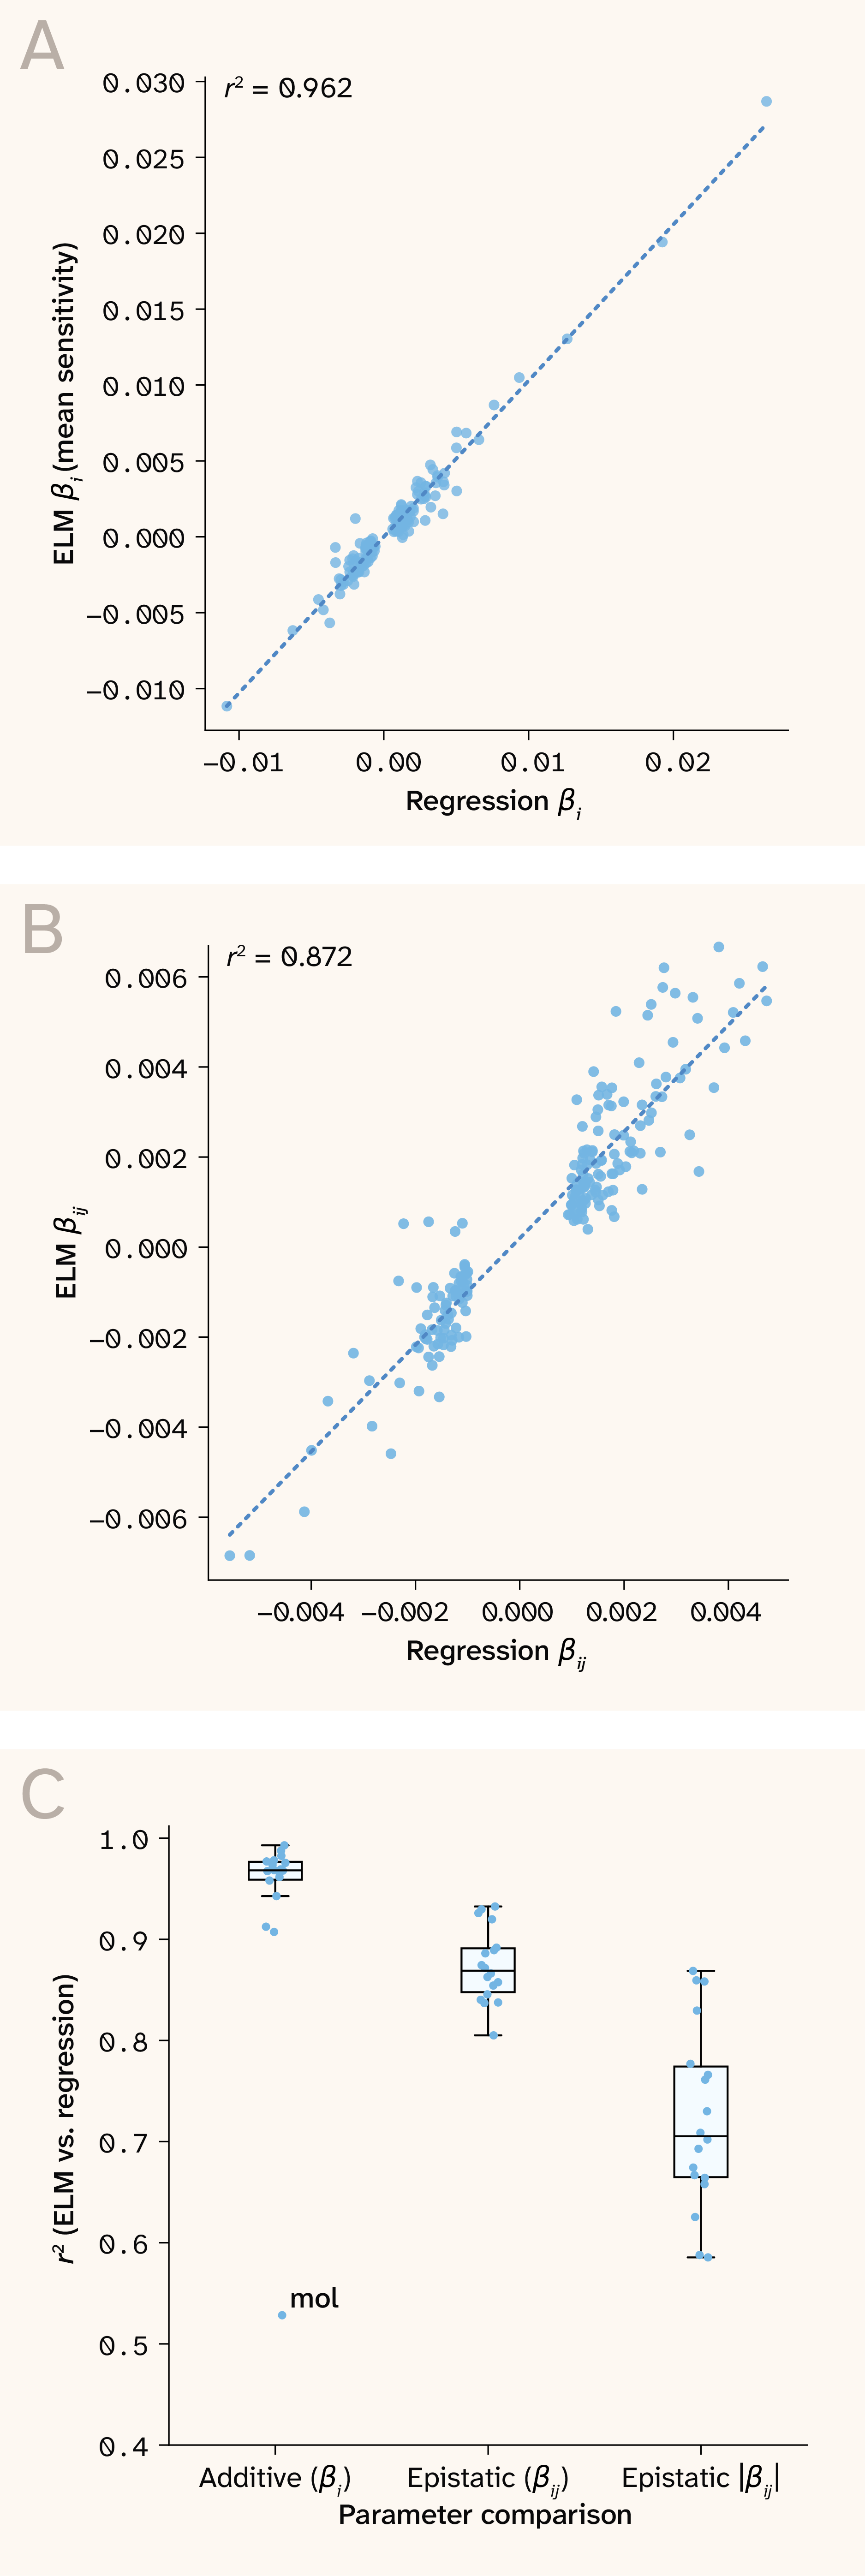
Figure 1. ELM recovers published additive and epistatic effect sizes from real yeast genotype–phenotype data.
A) Linear regression additive effect plotted against ELM mean sensitivity value in the 30C environment.
B) Linear regression pairwise epistasis estimates plotted against ELM-derived pairwise epistasis statistic in the 30C environment.
C) Correlation of linear regression parameters and ELM summary statistics across all growth environments.
Additive-effects estimates between the two approaches were highly concordant, with most growth conditions exhibiting values around 0.95 (Figure 1). The only exception was mol (molasses), which had a lower correlation driven by two aberrant QTLs with a strong mismatch. Upon closer inspection, we noted that these two QTLs are located within the same gene (ABZ1), ~50 bp apart, and in very tight LD. In the authors’ linear regression, each QTL was assigned a strong but opposite effect estimate, which was combined into a single averaged effect size in our model, suggesting that the discrepancy here is likely due to unstable coefficient estimates. Pairwise epistatic interaction terms estimated from ELM sensitivity values (see methods for details) were also highly concordant ( ~0.85 signed, 0.7 absolute), though weaker than those for additive effects (Figure 1). This is perhaps unsurprising, since the authors fit a sparse epistatic model which includes only a few hundred pairwise interaction terms, while our model implicitly learns across all possible QTL interactions. Overall, the high concordance in both additive and epistatic effects estimates we observe gives us confidence that our models have learned meaningful genotype–phenotype mappings and in the ability of ELM to recover interpretable signals related to them.
One convenient property of ELM sensitivity values is that the variance in the sensitivity of any focal QTL across a set of samples provides a natural marginal epistasis test: the more a sensitivity value changes across genetic backgrounds, the more it's influenced by epistatic interactions (see Estimating marginal effects for details). Visualizing the distribution of locus sensitivity variances reveals skewed distributions for all growth conditions, featuring a few hyper-variable "hub" QTLs that appear to participate in many epistatic interactions (Figure 2).
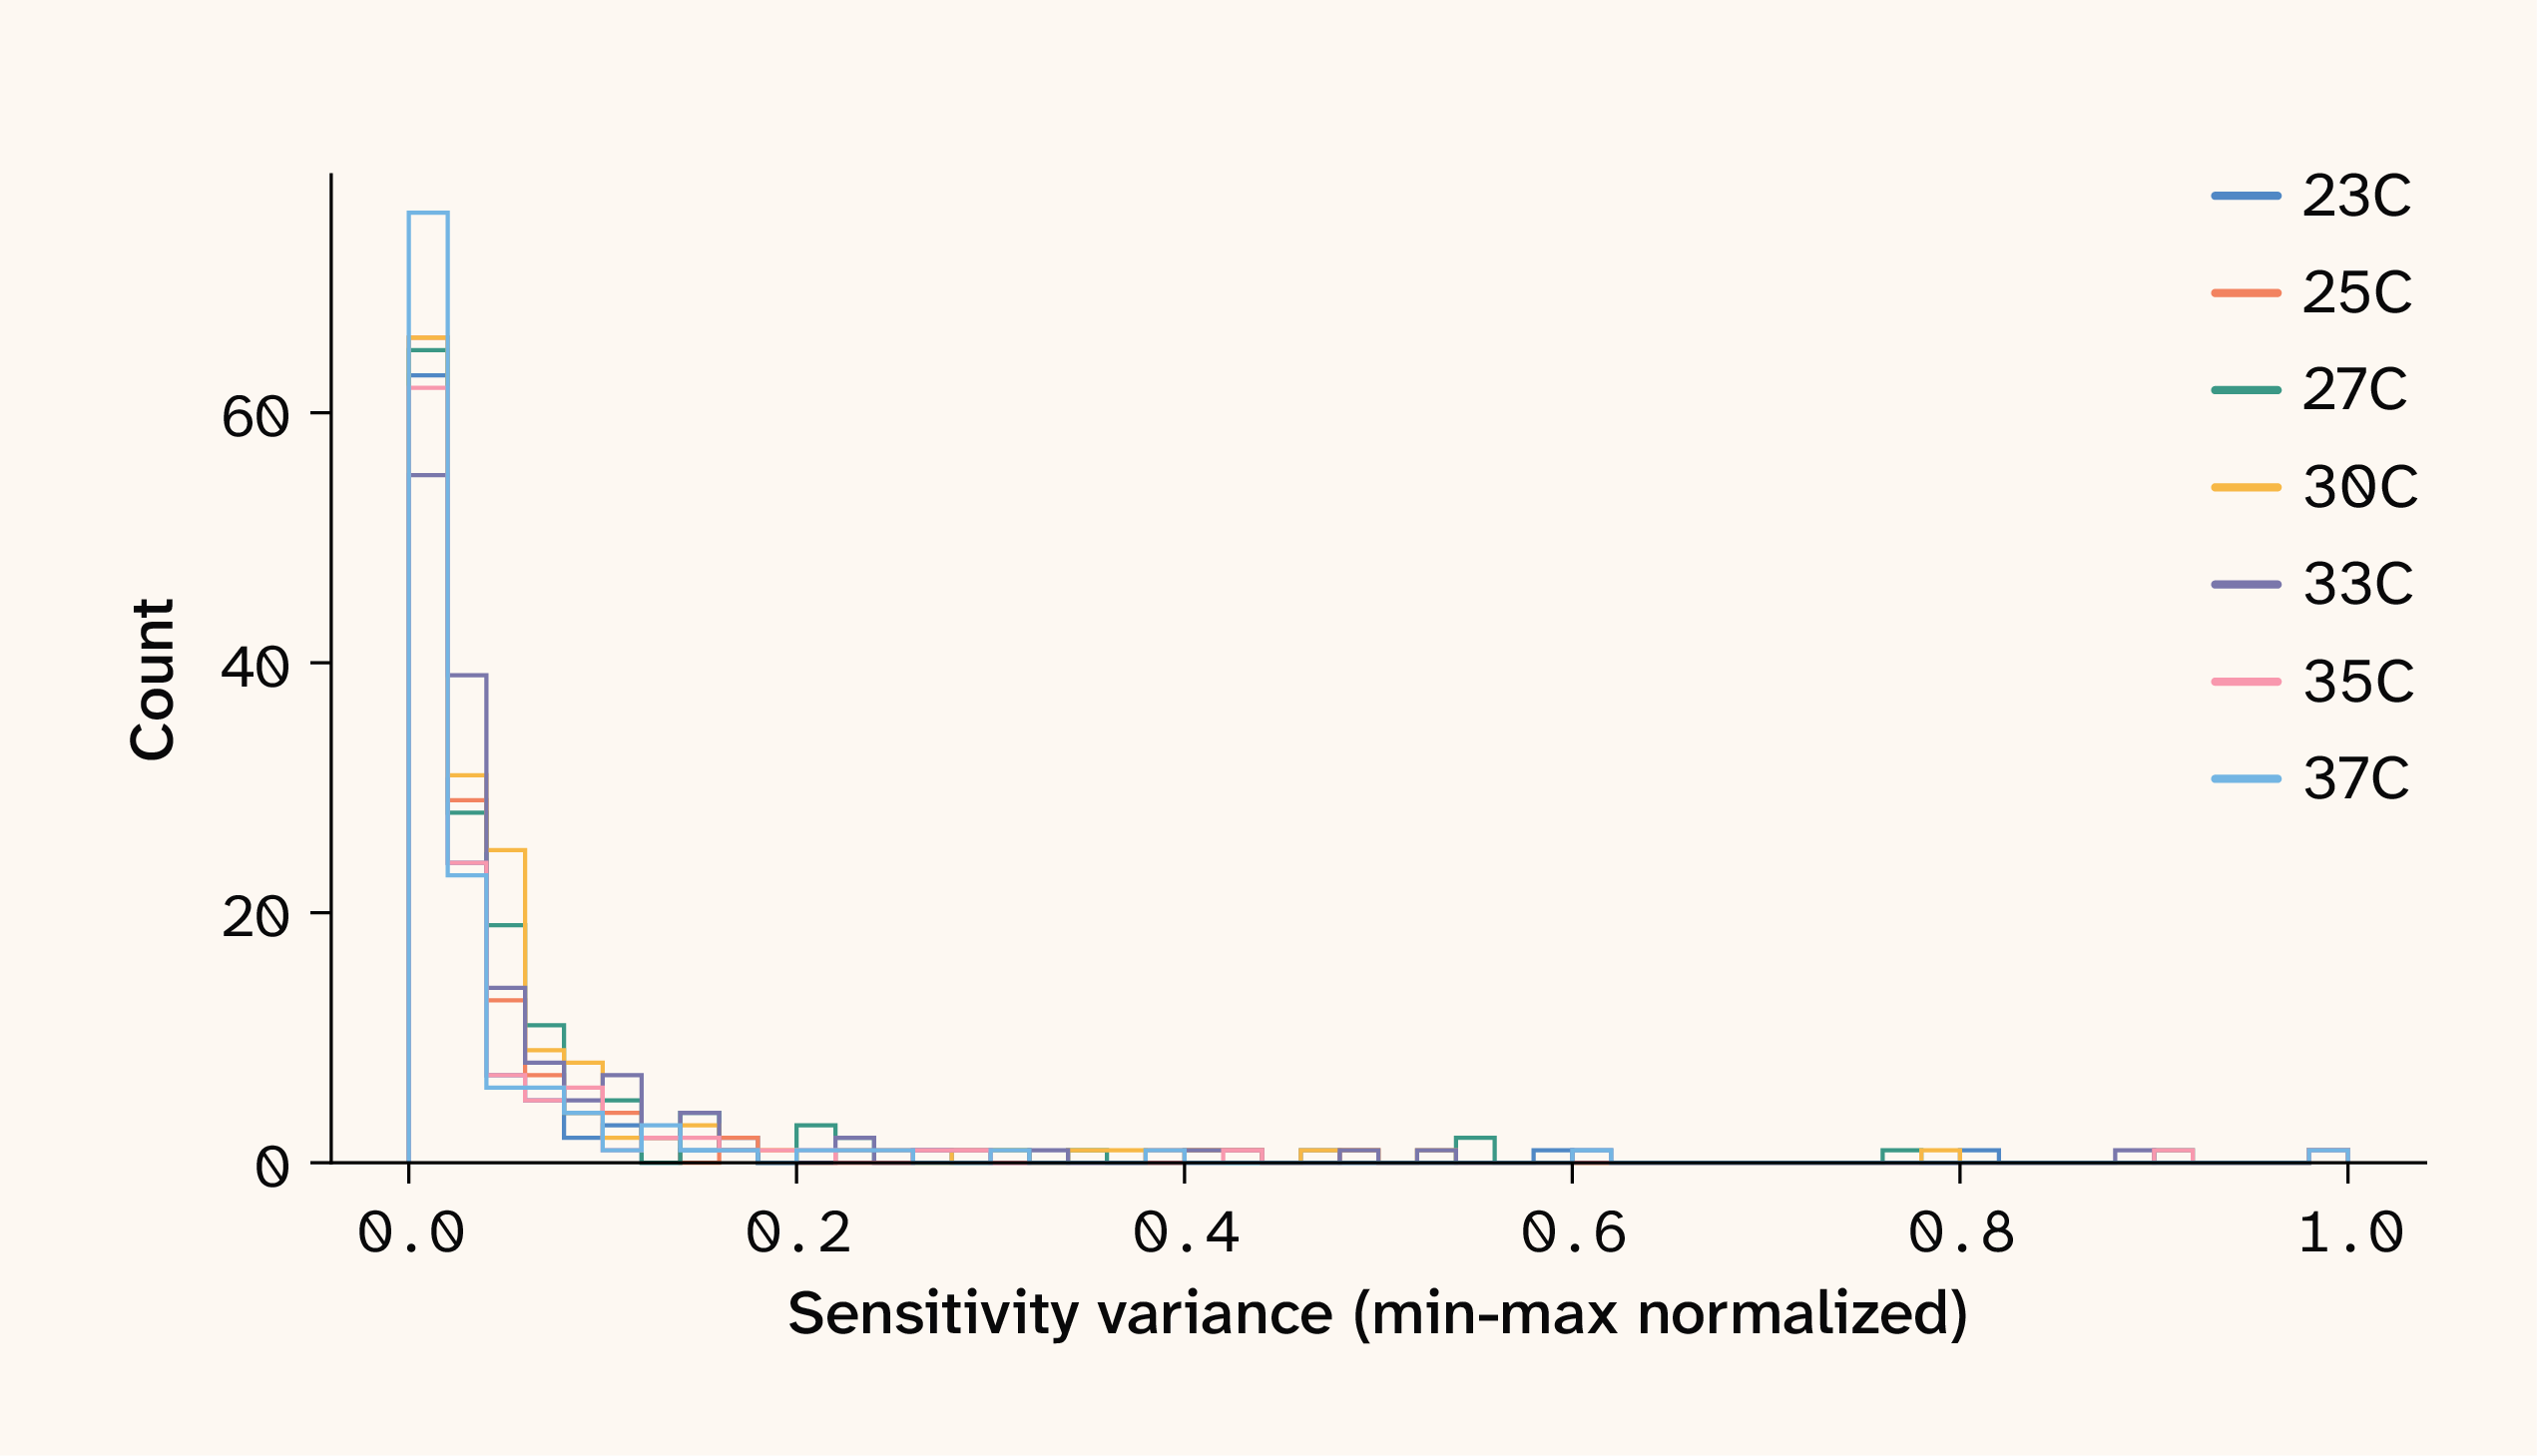
Figure 2. Normalized variance of ELM sensitivity values for seven temperature growth environments.
Unsurprisingly, the majority of the strongest pairwise interactions we estimate (among all possible pairwise interactions) involve at least one of these hub loci. In subsequent analyses, these hub loci serve as a convenient subset of QTLs when investigating epistatic signals in this dataset.
Sample-level sensitivity patterns
While summary statistics provide convenient heuristics for feature importance and model comparison, the real power of ELM lies in its ability to estimate individual-level genotype–phenotype mappings, a level of granularity not accessible to linear approaches. So how do we effectively make use of such fine-scale data? As a first pass, we fit PCA to the locus sensitivity values of a subsample (8,000) of our test set strains and overlaid strain metadata (fraction of ancestry, strain fitness) on top of the first two PCs.
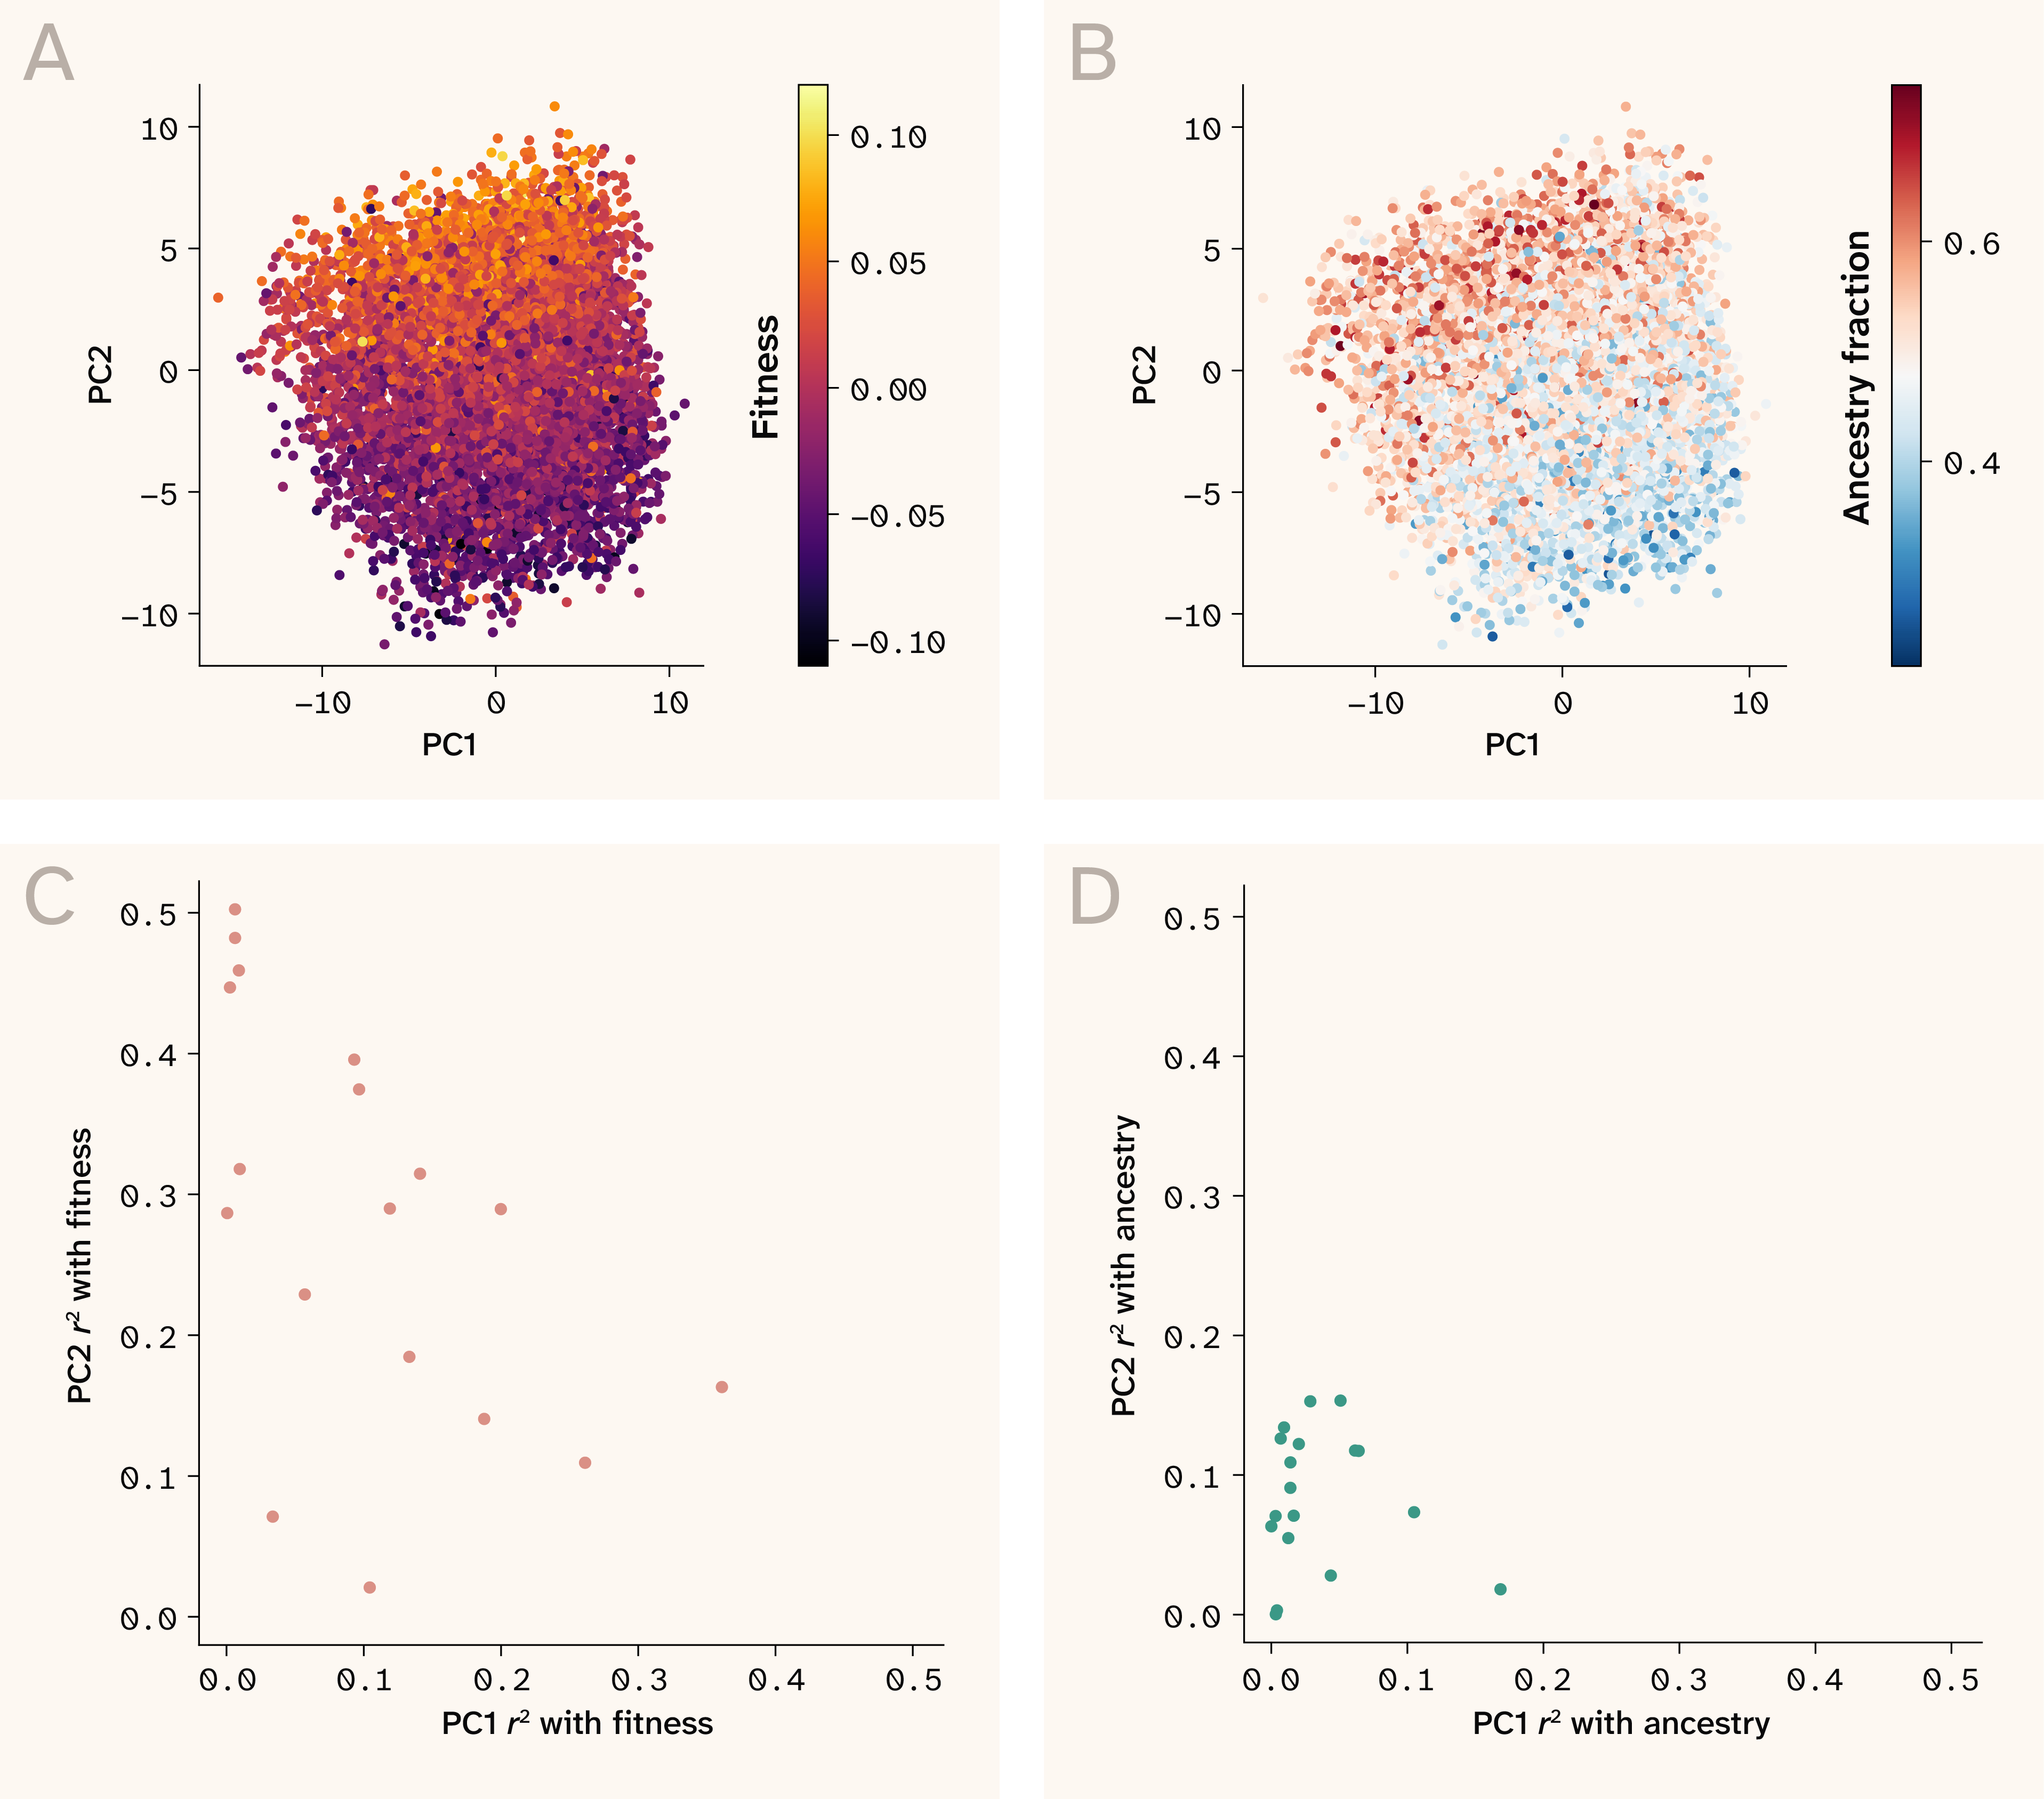
Figure 3. Fitness but not ancestry structure the first two principal components of ELM sensitivity space.
(A–B) PCA of ELM sensitivity values from 8,000 validation set samples from the 30C growth environment with strain fitness (A) and parental ancestry fraction (B) overlaid.
(C) Variance in fitness captured by PC1 and PC2 of each environment-specific sensitivity PCA.
(D) Variance in parental ancestry fraction captured by PC1 and PC2 of each environment-specific sensitivity PCA.
These visualizations revealed a fairly striking pattern: fitness exhibited clear gradients in sensitivity value PC space, while ancestry fraction seemed to only moderately align with PCs 1 and 2 (Figure 3, A–B). The exact manifestation of this pattern varied across growth conditions. The fitness gradient was sometimes captured by PC1 and at other times by a linear combination of PC1 and PC2 (Figure 3, C–D). In most cases, PCA revealed a global pattern in how strain sensitivity values changed with background phenotype.
These results seem puzzling at first. The sensitivity value for any given locus is technically "blind" to the genotype of said locus (as it’s a partial derivative with respect to locus genotype). If so, how can high and low fitness samples segregate onto different axes of sensitivity space if sensitivity values themselves don’t capture direction of locus contribution to fitness? The key is that the sensitivity value for a focal locus isn't blind to the genotypic state of epistatic partner loci (see the Applying ELM to extract locus sensitivities section). Consequently, we can think of the sensitivity value PC space as being structured by the epistatic interactions each locus experiences across genetic backgrounds in the dataset. The fact that fitness forms clear gradients in light of these locus-locus interactions matches the well-known phenomenon of global epistasis, where a mutation's effect is epistatically modulated by the fitness of the genetic background to which it's introduced (hence creating fitness gradients in PC space). In the next section, we explicitly test this framing.
ELM reveals environmentally mediated global epistasis
Global epistasis has been previously characterized across environmental and mutational contexts in yeast 8–11. Probing global epistasis usually involves comparing the effect of inserting a manually edited mutation across genetic backgrounds that differ in their (pre-mutated) fitness. Leveraging ELM-derived strain-level mutation effects, it becomes possible to probe global epistasis across alternative genetic contexts, including a genetically simple F1 cross such as the one we're working with here.
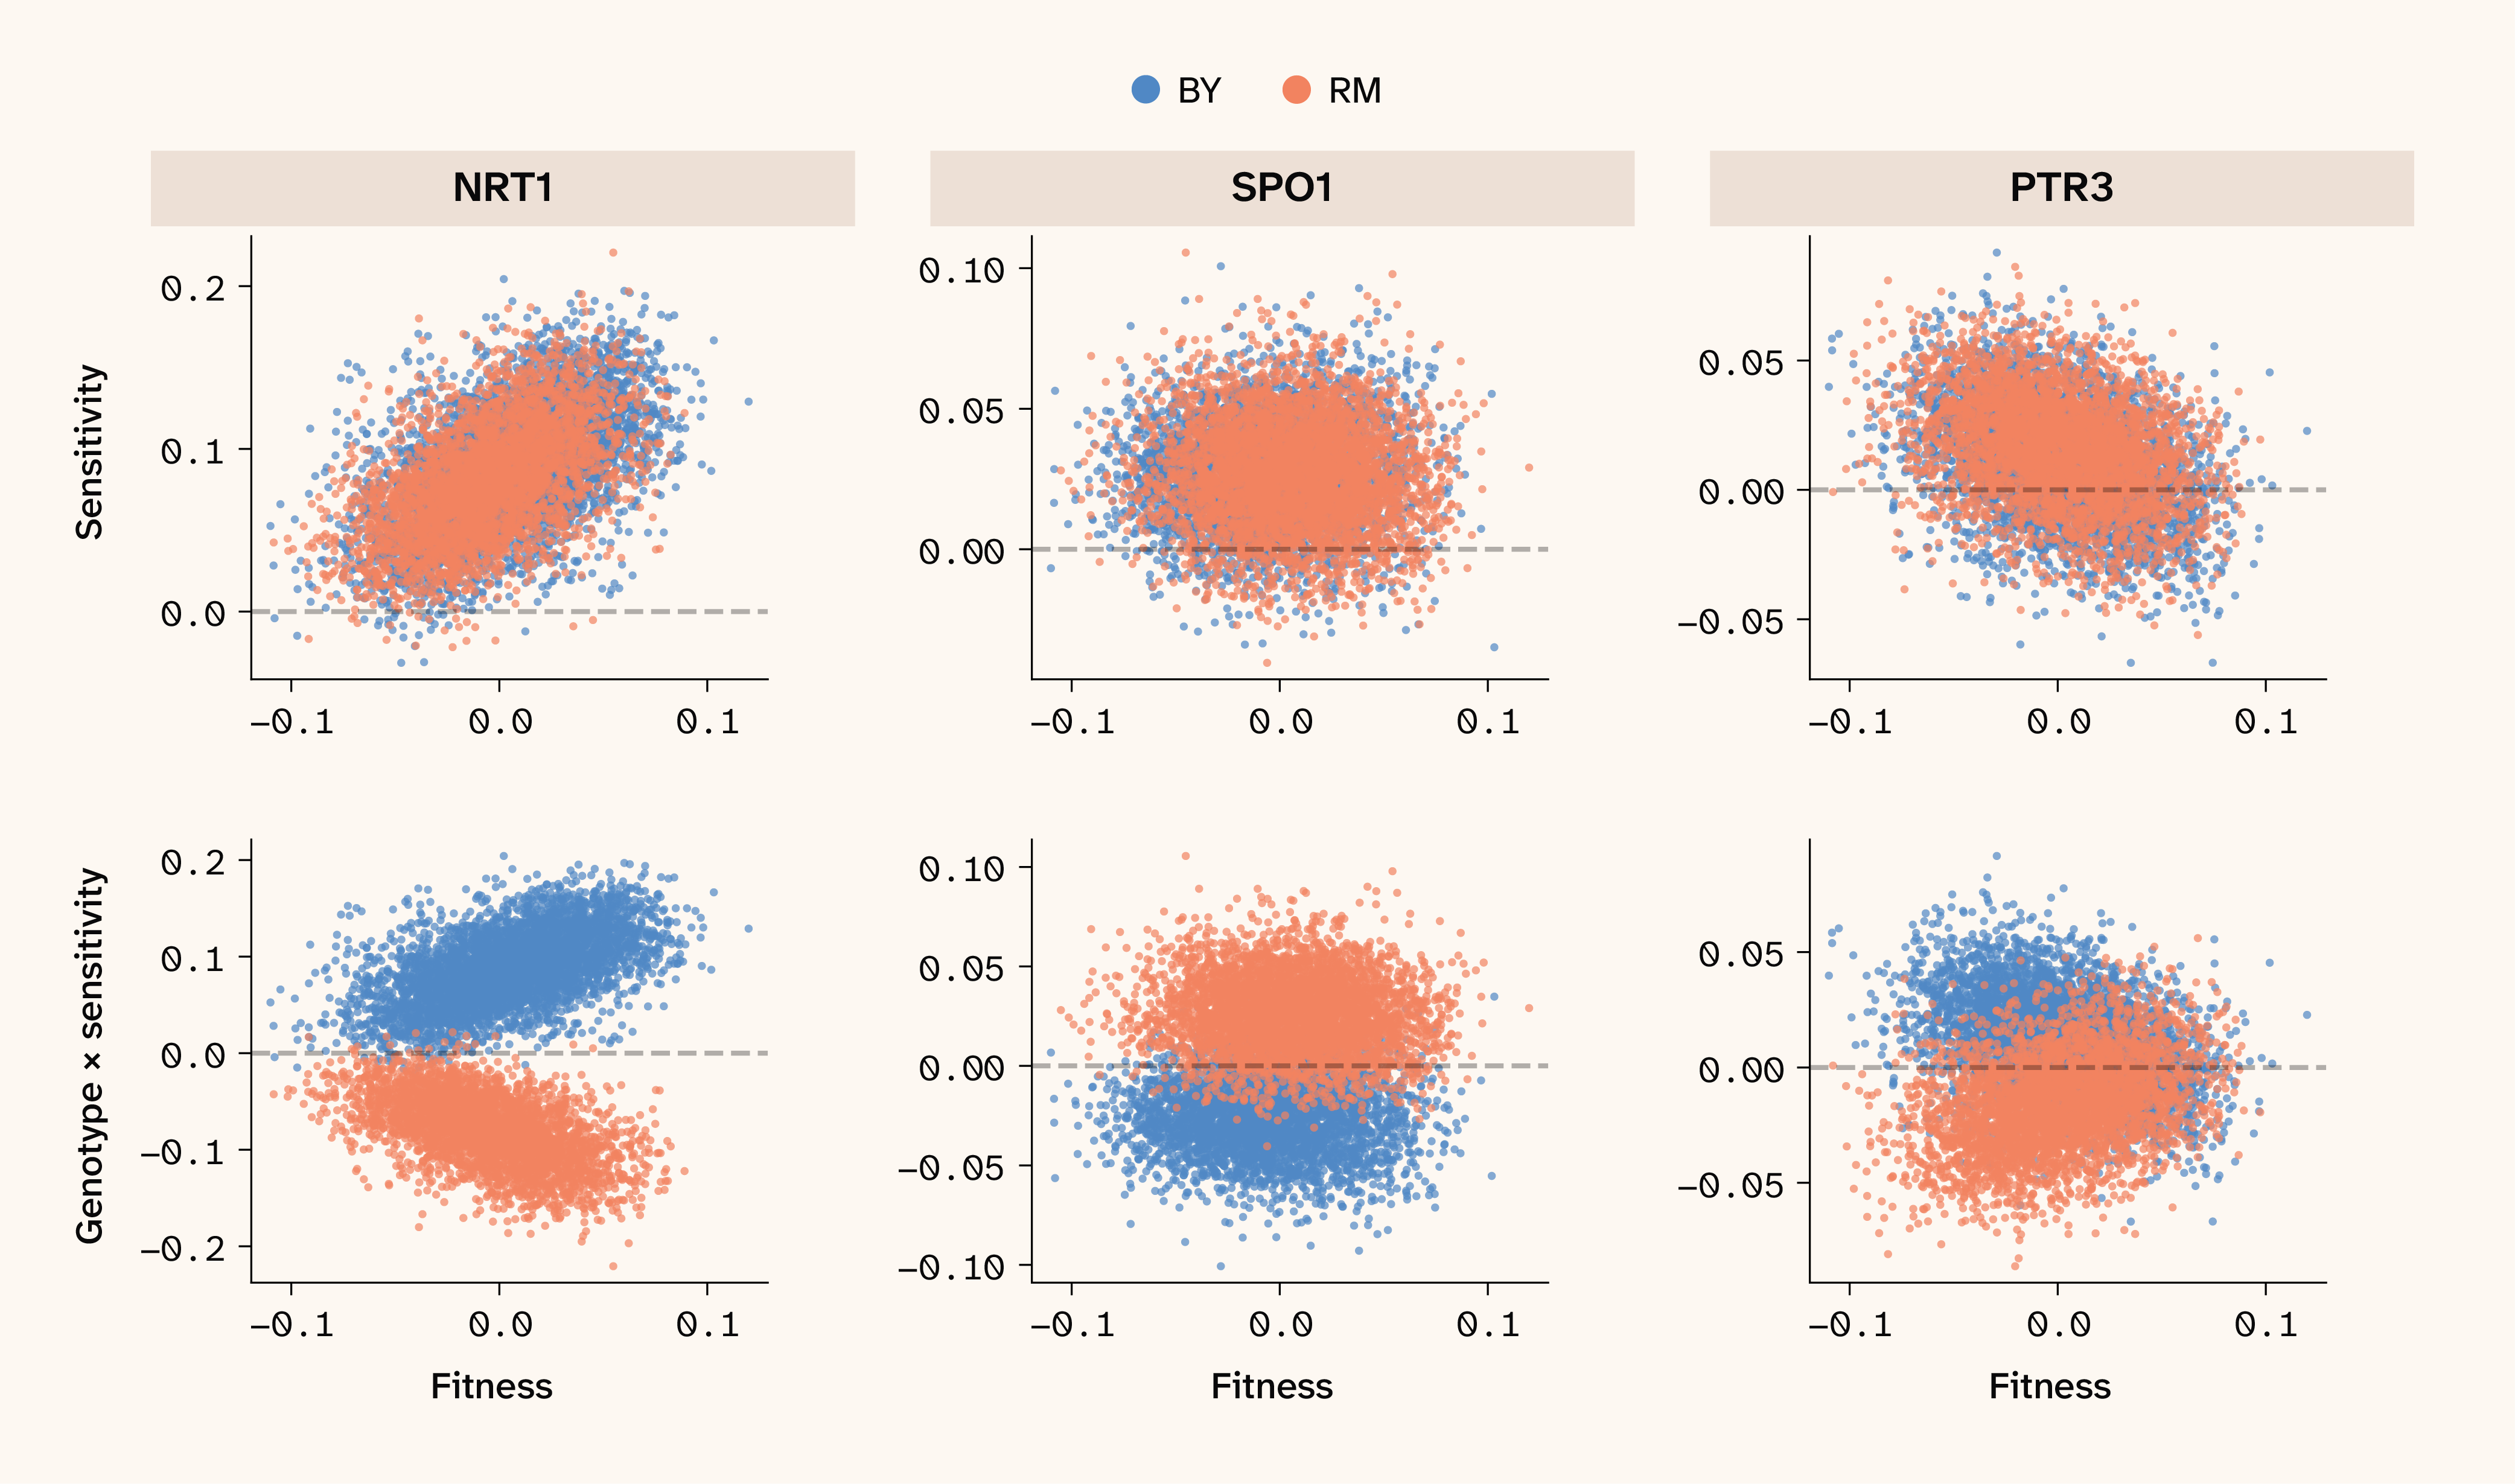
Figure 4. QTL sensitivity values reveal increasing costs, diminishing returns, and neutral global epistasis patterns in the 30C environment.
Scatter plots of sensitivity values of three representative QTLs in the 30C environment plotted against background fitness. QTLs display increasing costs, none, and diminishing returns epistasis patterns, respectively. Top showing the sign-corrected sensitivity value distribution plotted against background fitness, and bottom showing raw sensitivity value multiplied by genotypic state [-1,1].
We can directly test whether our neural networks have learned to capture global epistasis by inspecting the correlation of QTL sensitivity values vs. the fitness background from which they were obtained, with a sign correction (multiplying correlations by the sign of the QTL's marginal effect) to make slopes comparable across QTLs with negative vs. positive marginal effects. These sensitivity–fitness correlations reveal three classes of QTLs in our dataset: those with no fitness scaling (flat slope, see SPO1 in Figure 4), those with locus sensitivity increasing with background fitness (positive slope, see NRT1 in Figure 4), and those with locus sensitivity decreasing with background fitness (negative slope, see PTR3 in Figure 4). These latter two patterns appear to map neatly to increasing-costs epistasis (positive slope) — in which deleterious mutations appear more deleterious in fit backgrounds — and diminishing-returns epistasis (negative slope), in which beneficial mutations appear less beneficial in more fit backgrounds. Note that ELM sensitivity values are blind to substitution effect direction (beneficial vs. deleterious), an important aspect of classical global epistasis studies. Instead, we focus on whether substitution effects are amplified or attenuated as fitness background increases, regardless of marginal substitution effect. Since global epistasis varies locus by locus and isn’t a uniform property, all three classes of fitness scaling are represented simultaneously in any given environment, and their relative abundance is inherently not fixed. We therefore next asked which growth conditions consistently drive increasing costs and/or diminishing returns epistasis.
We identified substantial variation in the distribution of global epistasis across the 18 growth conditions. Using the correlation of sensitivity and fitness as a proxy, we identified environments associated with both increasing costs and diminishing returns (Figure 5). For example, the temperature growth conditions seemed to exhibit an excess of increasing costs epistasis (positive slopes), while a few conditions, such as intense chemical stressors, seemed to shift strongly to predominantly diminishing returns (negative slopes) epistasis. This result prompted us to ask whether we could find evidence of a relationship between the harshness of a growth condition and patterns of global epistasis.
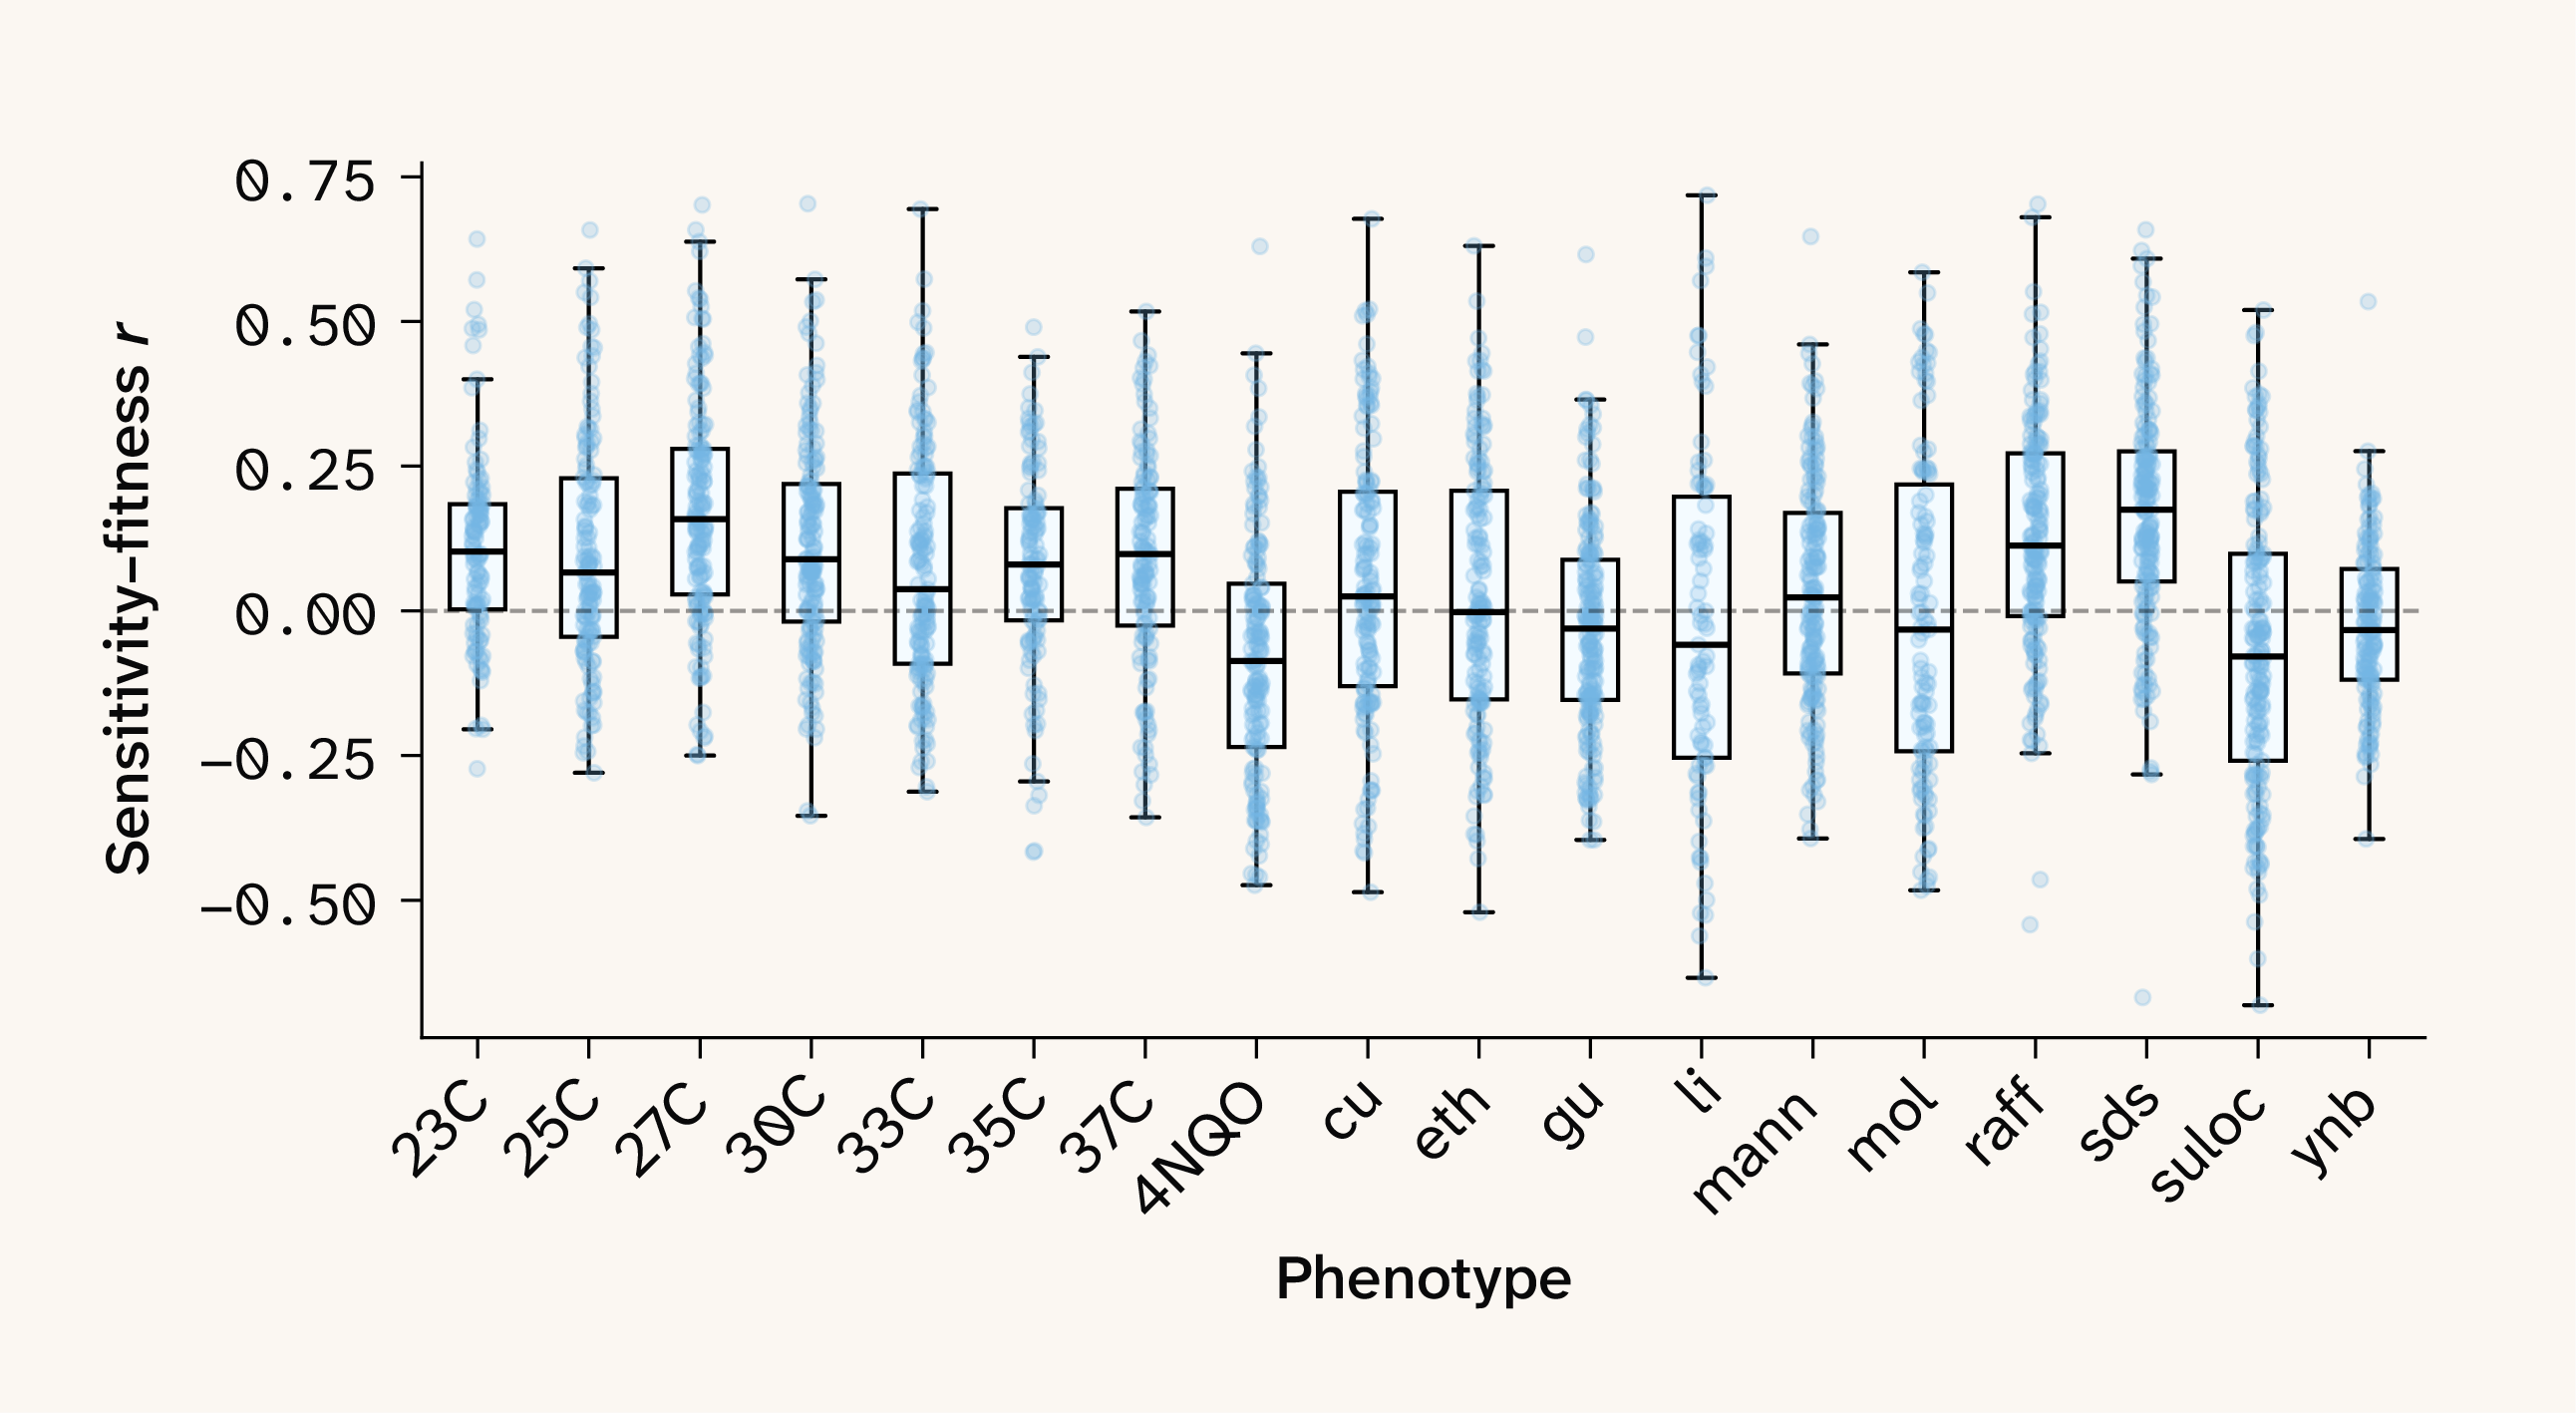
Figure 5. Distribution of sensitivity–fitness correlations for all QTLs in all growth conditions.
Evaluating growth condition harshness in this dataset requires care since the phenotypic measurements collected by Nguyen Ba et al. 3 consist of relative growth rates measured on environment-specific scales. Therefore, only statistics that are invariant to affine transformations of the phenotype — such as skewness and correlation — are comparable across environments. We noticed that environments expected to be particularly harsh (e.g., 4NQO, a DNA damage treatment) had phenotypic distributions characterized by a long tail of low-fitness lineages, recommending skewness to be an informative metric. Similarly, the phenotypic distributions across growth environments fall into two general classes: a highly correlated group centered on temperature conditions and a less correlated group associated with harsher perturbations (see Figure 3 in Nguyen Ba et al. 3). Taking advantage of this structure, we selected 30C as a reference growth condition (a growth environment both parents should be adapted to, as in Petti et al. 12), and calculated phenotypic correlations of all other phenotypes relative to this base condition as a second proxy for harshness. We found that both metrics were reasonably well aligned ( 0.65), giving us confidence that downstream analyses could tell us something meaningful about the relationship between global epistasis and environmental stress.
Does environmental harshness actually predict shifts in global epistasis? Strikingly, both metrics were strongly correlated with median sensitivity–fitness correlations ( 0.69, 0.72 for skewness and 30C correlation, respectively, Figure 6, A–B). What’s more, harsh growth conditions trended towards diminishing returns epistasis, while more benign growth conditions displayed increasing costs epistasis.
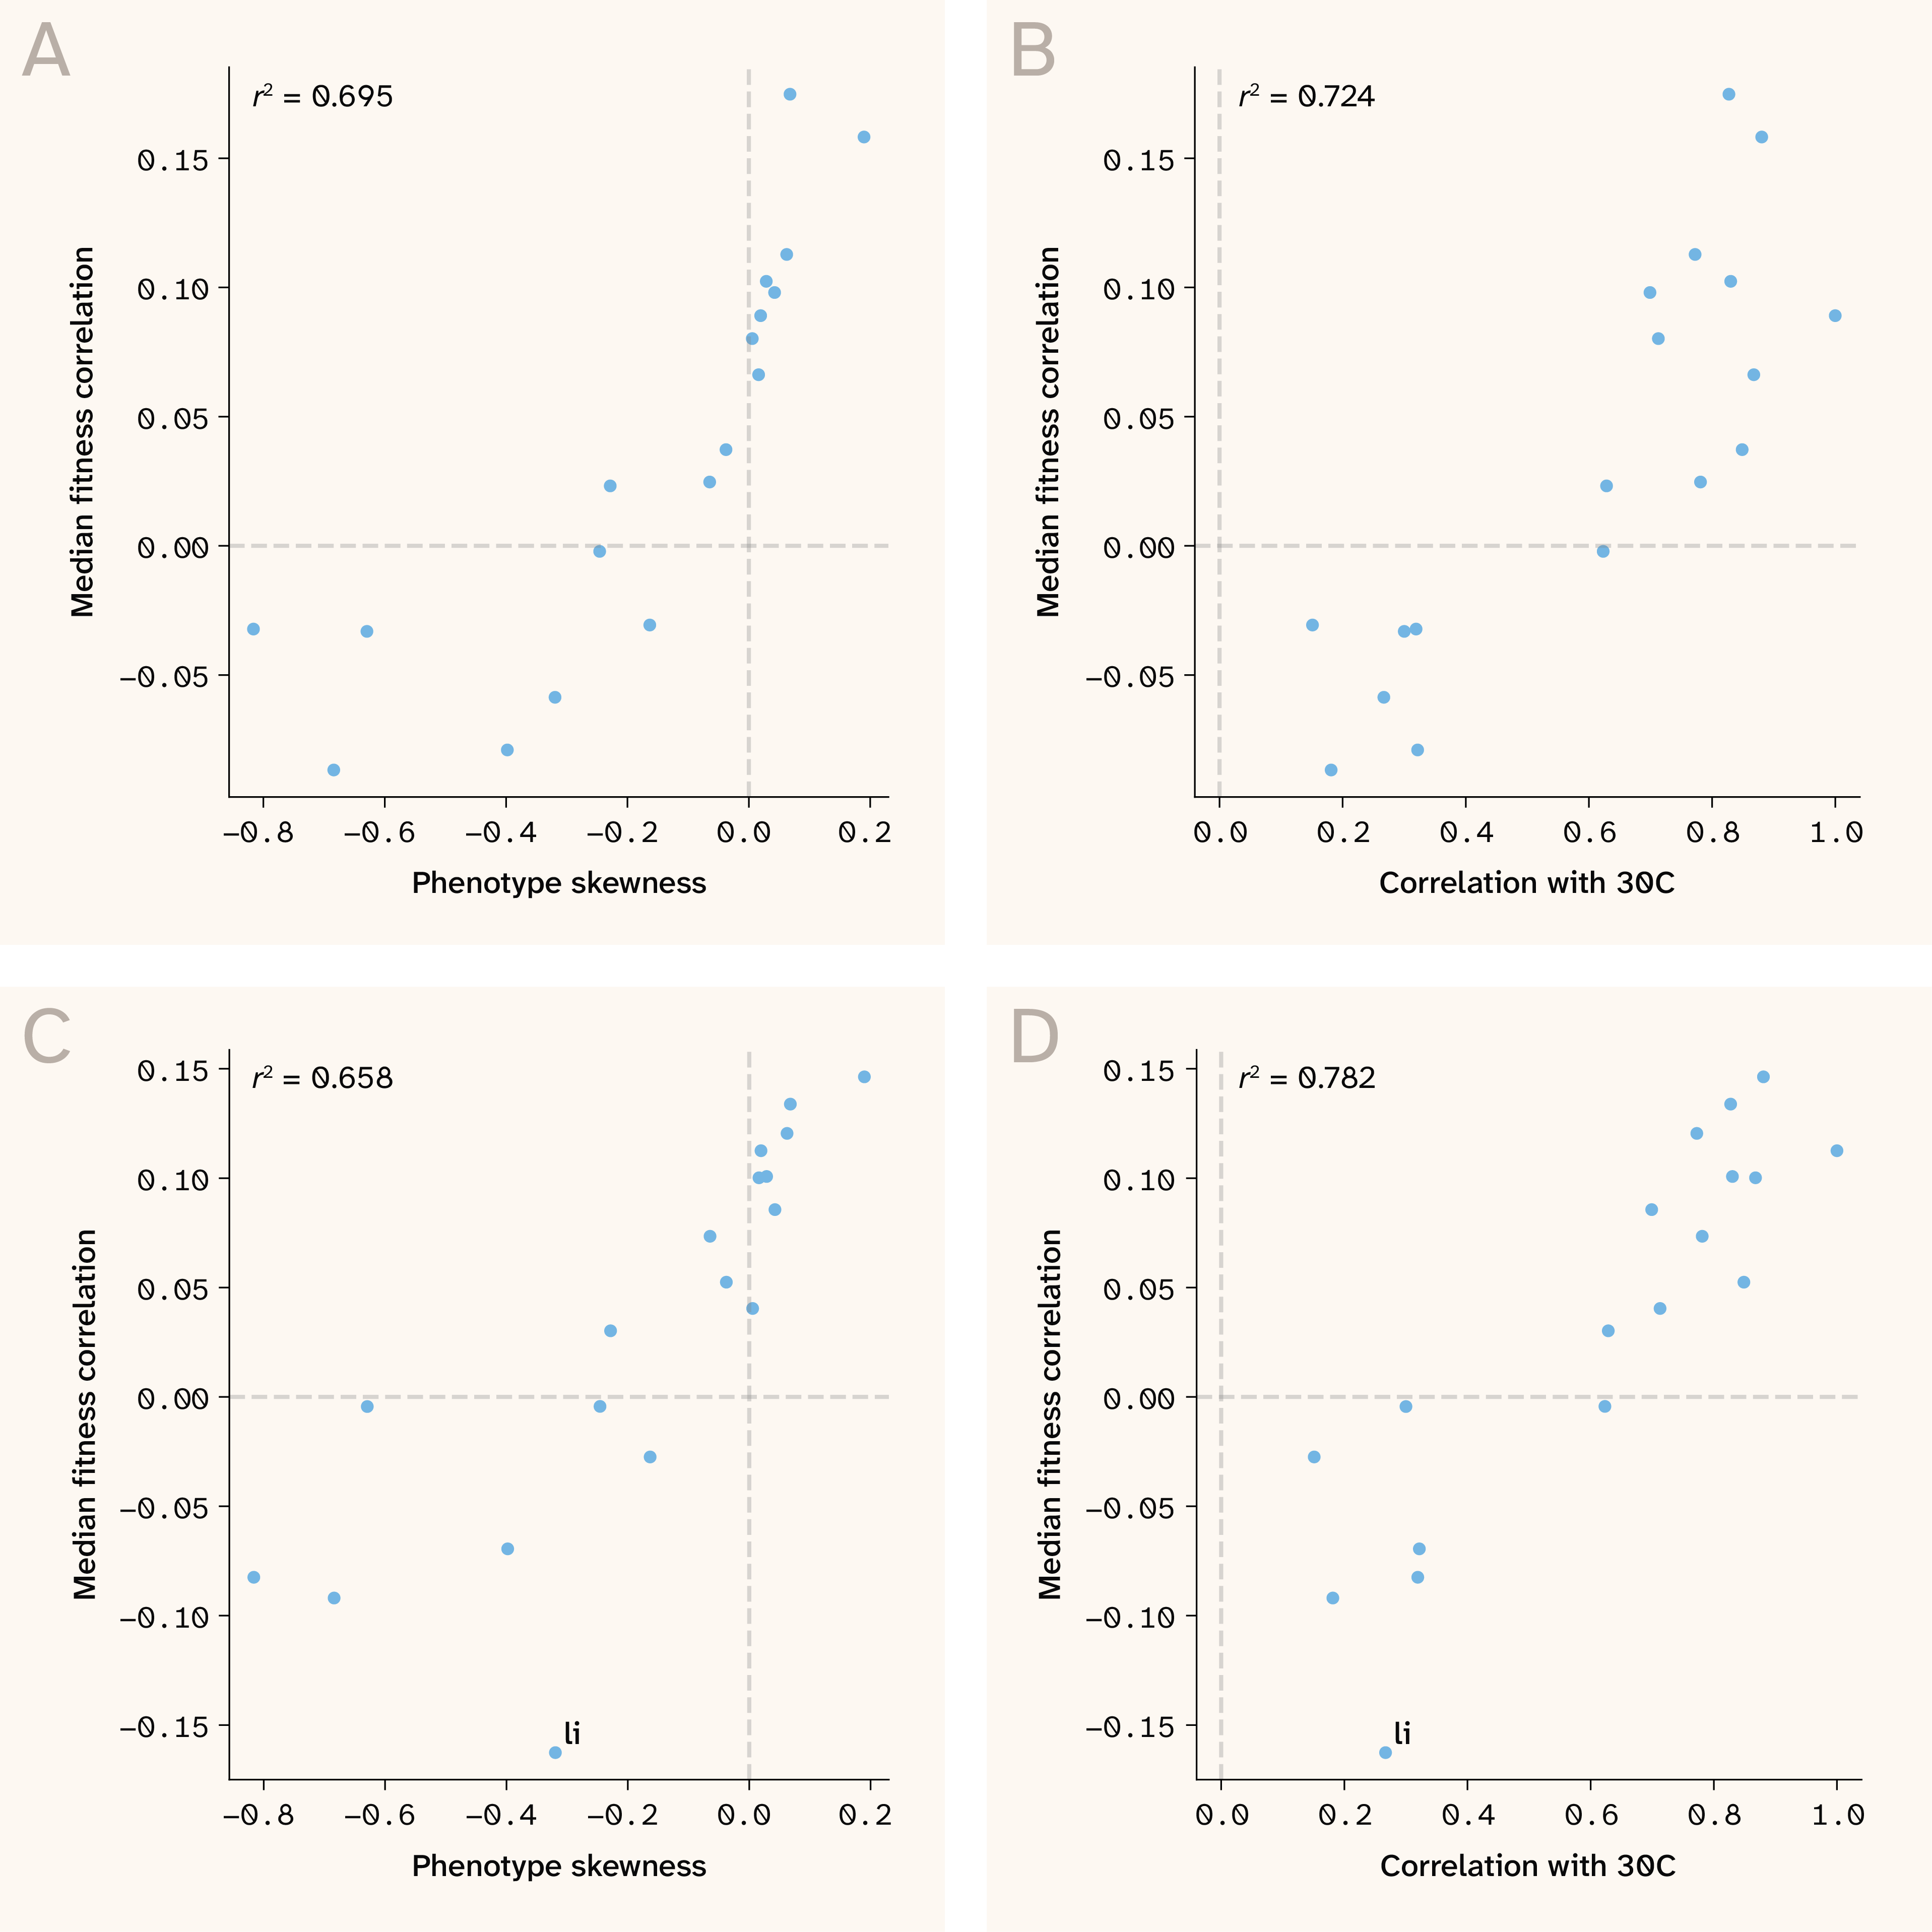
Figure 6. Environmental harshness predicts the direction of global epistasis across benign and stressful growth conditions.
(A) Scatter plot of fitness (growth rate) skewness plotted against median sensitivity–fitness correlation for all growth conditions.
(B) Same as A but using similarity of growth rate to base condition (r2 with 30C growth rates) as environmental differentiator.
(C–D) Same as A and B, but using sensitivity–fitness correlations derived from a single set of LD pruned QTLs, rather than environment-specific QTLs.
While this is a potentially exciting finding, one complication of comparing cross-environment global epistasis is that our models are trained on environment-specific QTLs, which could, in theory, lead to differences across growth conditions. To test this null hypothesis, we retrained all models using a single set of LD-pruned QTLs as identified by 5, enabling a true apples-to-apples comparison across growth conditions. This single set of QTLs generated an extremely similar pattern of cross-environment shifts in global epistasis (Figure 6, C–D), for both skewness ( 0.66) and 30C correlation ( 0.78). The linear pattern of epistatic shift actually seems cleaner for the LD pruned QTLs, with the exception of the lithium (li) growth environment, a pattern which makes sense given that growth rate in this condition is highly sensitive to one QTL in ENA1 (a sodium/lithium efflux pump), which is likely missing in the LD pruned QTL set. These findings confirm that the previous results weren't artifacts of environment-specific QTLs and provide confidence in using the condition-specific QTL sets for further analyses.
Uncovering the genetic determinants of global epistasis
Naturally, we next wanted to understand 1) where global epistasis arises in this dataset, and 2) why it shifts from increasing costs to diminishing returns across environments. Previous theoretical work has described how global epistasis at a focal locus arises from the product of epistatic interactions linking focal and non-focal loci, as well as from the marginal effects of those non-focal loci 13–14. Building on this framework, we derived the expected slope from a regression of the sensitivity of a focal locus on background fitness. We hereafter refer to these as sensitivity–fitness slopes (see Theoretical prediction of sensitivity–fitness slopes for details). We switch to slopes here (rather than correlation as in the previous section) as the theoretical prediction derived in the methods (and previous work) is expressed as a regression coefficient, making slope the natural statistic for testing quantitative agreement between observed and predicted epistatic scaling within a given environment. In agreement with previous results, we found that sensitivity–fitness slopes should arise from the summed products of epistatic interactions, and marginal effects at non-focal QTLs:
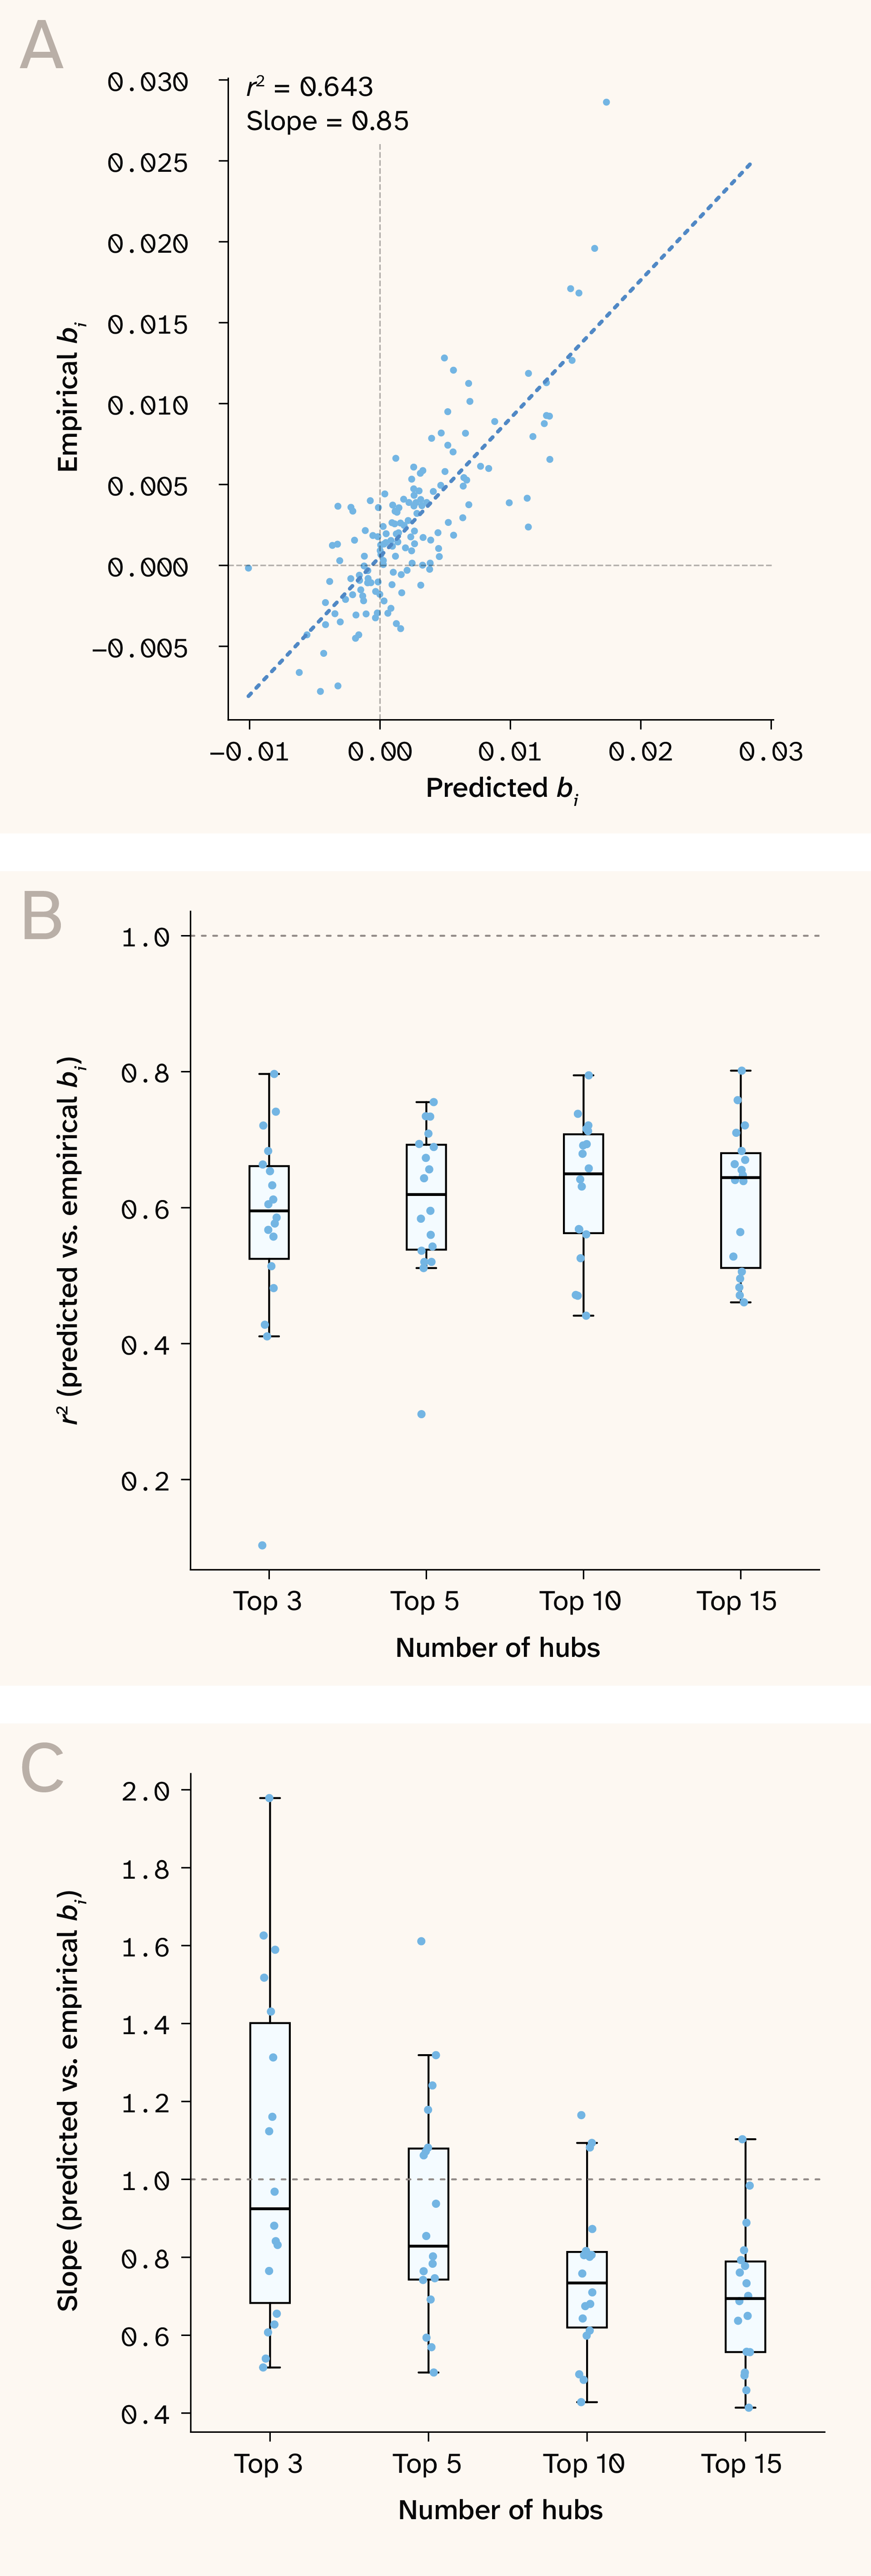
Figure 7. Hub loci predict sensitivity–fitness slopes with near-unit scaling using as few as five hubs.
A) Predicted vs. observed sensitivity–fitness slopes in the 30C growth condition, using five epistatic hub QTLs.
B) between predicted vs. observed sensitivity–fitness slopes using different numbers of hubs for calculation.
C) Same as B but displaying slope instead of .
As we noted earlier, a small subset of hub QTLs in this dataset appears to harbor the vast majority of epistatic signal (as assessed by variance in sensitivity value). Taking advantage of this structure, rather than calculating expected slopes by summing over all interactions between all QTLs, we predicted sensitivity–fitness slopes for non-hub QTLs only, using the top 3, 5, 10, or 15 largest epistatic hubs for each growth condition.
This analysis validated our approach to predicting sensitivity–fitness slopes. The overall correlation was strong, and the scaling between observed and predicted slopes was close to 1:1 (Figure 7). This suggests that we captured the dominant sources of global epistasis and strongly implies that a large fraction of the global epistasis we observe across this dataset is fairly oligogenic. For example, slopes could be predicted with ≈ 0.6 using just five hub genes in most growth conditions. We also noted that using different numbers of hubs pushed prediction fits either closer or further from a 1:1 relationship, suggesting that the core ‘global epistasis’ hubs do differ in identity and number among growth conditions.
To visualize this more explicitly, we plotted the mean and variance of hub-specific global epistasis contributions (see methods for details) for all phenotypes, using the top five hubs of each growth condition. This confirmed our earlier intuition: the vast majority of global epistatic signal is driven by a small number of QTLs in hub genes (Figure 8). Genes MKT1 and HAP1 are the most notable hubs in benign environments. This isn't only because they're the source of the largest contributions to global epistasis slopes, but also because their contributions tend to be biased towards positive values (i.e., their marginal and interaction effects are sign aligned, leading to increasing costs epistasis). MKT1 and HAP1 also contribute a positive bias to moderately stressful growth conditions like eth (ethanol) and cu (copper), but their effects are countered by IRA2, which, while neutral in 30C, starts contributing towards diminishing returns epistasis with the addition of chemical stress and renders the slopes neutral. Finally, harsh environments were characterized by distinct hubs. For example, 4NQO displayed a strongly negative bias dominated by RAD5 (although we also note that the canonical hubs like HAP1 were also negatively biased in this condition), while suloc (suloctidil) had a more diffuse architecture with HAL9, VPS70, and PHO84 contributing to negative slopes (with HAP1 also present but retaining its positive bias). Together, these results suggest that interactions among a small set of core hub genes drive increasing-costs epistasis under benign growth conditions but are rewired under harsher conditions, leading to diminishing returns.
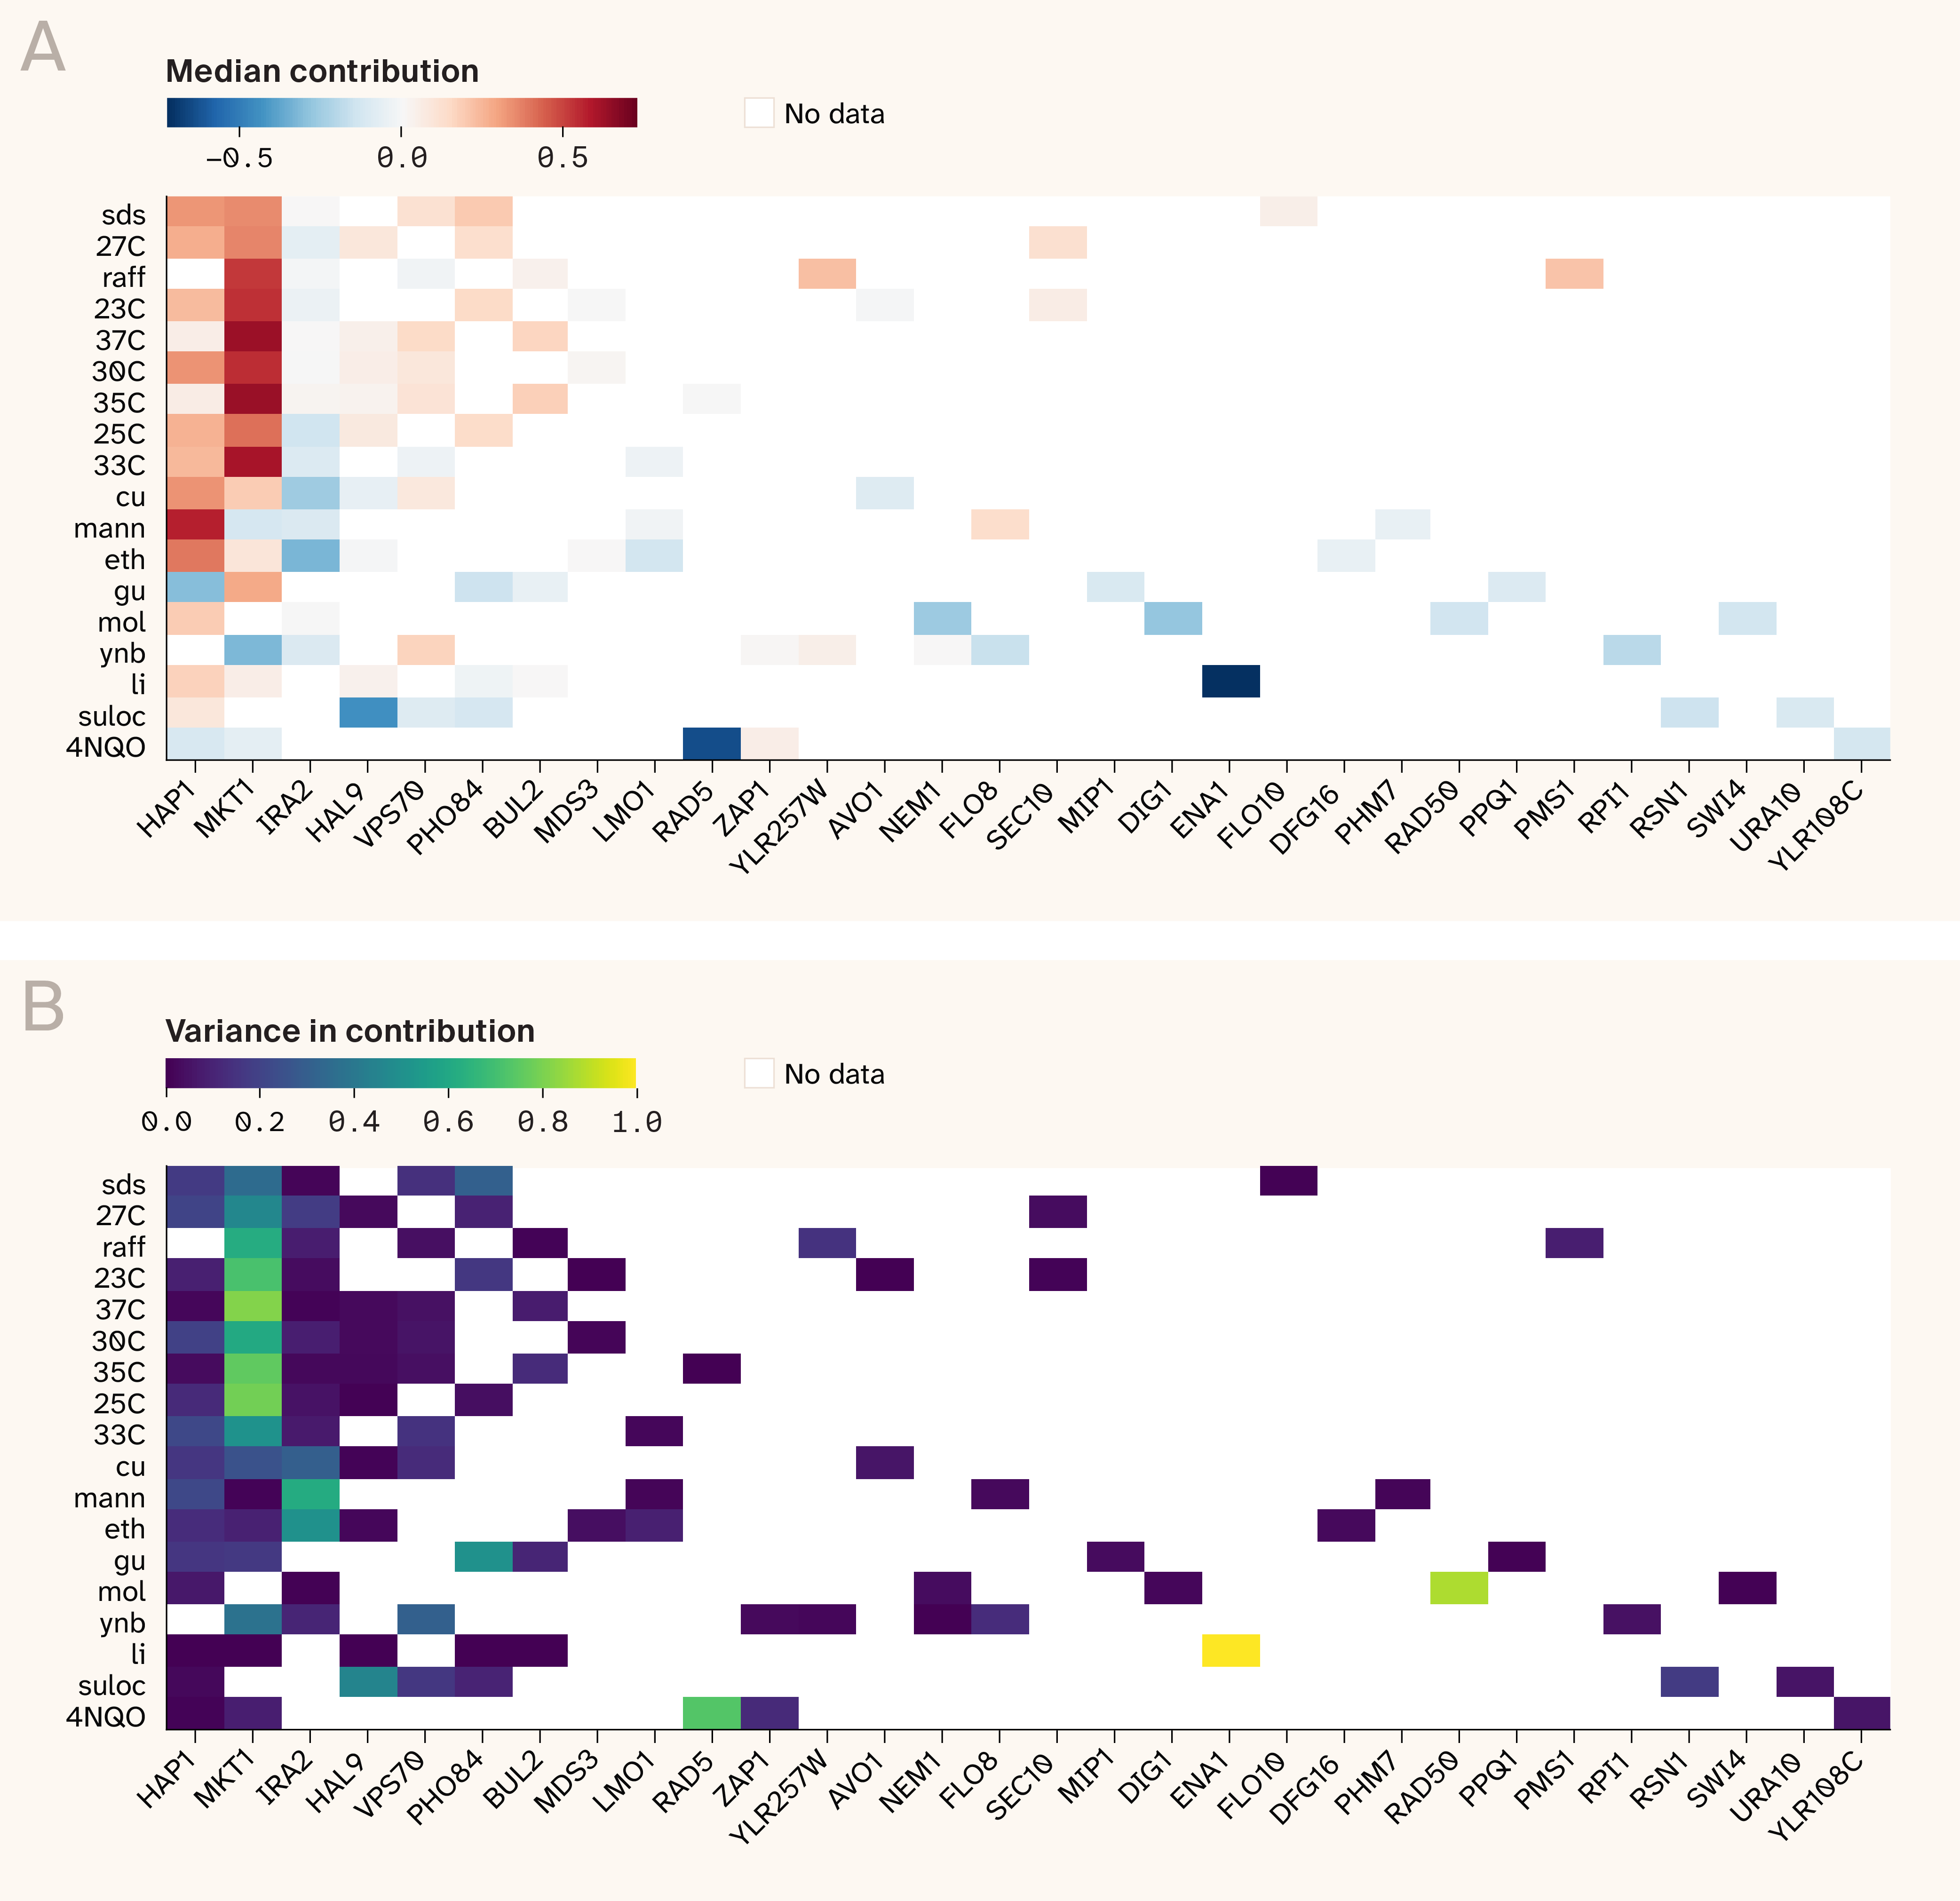
Figure 8. MKT1 and HAP1 drive increasing costs epistasis in benign environments, with a shift toward condition-specific hubs causing diminishing returns under chemical stress.
(A) Normalized median contribution of top five hubs to each QTL's predicted sensitivity–fitness slope. Environments are sorted top to bottom by phenotypic distribution skewness (least to most harsh).
(B) Same as A, but showing normalized variance in contribution instead.
Why are the signs of hubs biased in such stark ways? Most theories of global epistasis assume that additive marginal effects and epistatic interactions are drawn at random 13–14, whereas our data suggest that this may not be the case. Why? For one, the ‘benign’ conditions we identified are, in a sense, benign only because the parental genotypes are at least somewhat adapted to them from years of maintenance under standard lab conditions (i.e., media such as YPD and temperatures around 30 °C) 12. On the other hand, the harsh growth conditions are genuinely novel environments for the genetics of both parental strains. Given this, we may expect the F1 strains to straddle different areas of the fitness landscape across growth conditions. In benign environments, they may be scattered around a fitness peak, while in harsh environments, they're likely closer to a fitness valley. If we view each F1 segregant as a series of genetic perturbations of the parental strains, then a well-adapted, high-fitness genotype will contain an overabundance of fitness-aligned epistatic interactions, making it particularly sensitive to deleterious substitutions. This should thus lead to increasing costs patterns in benign environments 13.
We can explicitly test this idea by inspecting the sign of our estimated pairwise epistatic interaction terms. Positive terms indicate synergism among same-parent alleles, a pattern we should expect if parental alleles are co-adapted to each other from past selection in some environment. On the other hand, we have no specific expectation on the epistatic sign for environments where neither parent is adapted. To investigate this empirically, we calculated the fraction of positive values for the largest 10% (absolute) epistatic interaction terms in each growth condition. In agreement with the fitness landscape hypothesis, benign environments (those correlated with the 30C growth condition), where increasing costs predominate, show a consistent overenrichment of positive epistatic interactions. In the harsher (uncorrelated) environments (li, 4NQO, suloc, ynb, mol, gu), where diminishing returns predominate, there was a random spread, with some growth conditions showing a positive bias and others a negative bias (Figure 9, A). There was also overall a positive relationship between the median global epistasis slope and the fraction of strong positive interactions ( = 0.48), further suggesting a link between increasing-costs epistasis and parental genotype adaptation (Figure 9, B). These patterns show that same-parent allelic combinations are fitter specifically in benign environments, suggesting that the increasing costs epistasis observed in these conditions is a result of perturbing already adapted parental genetic combinations.
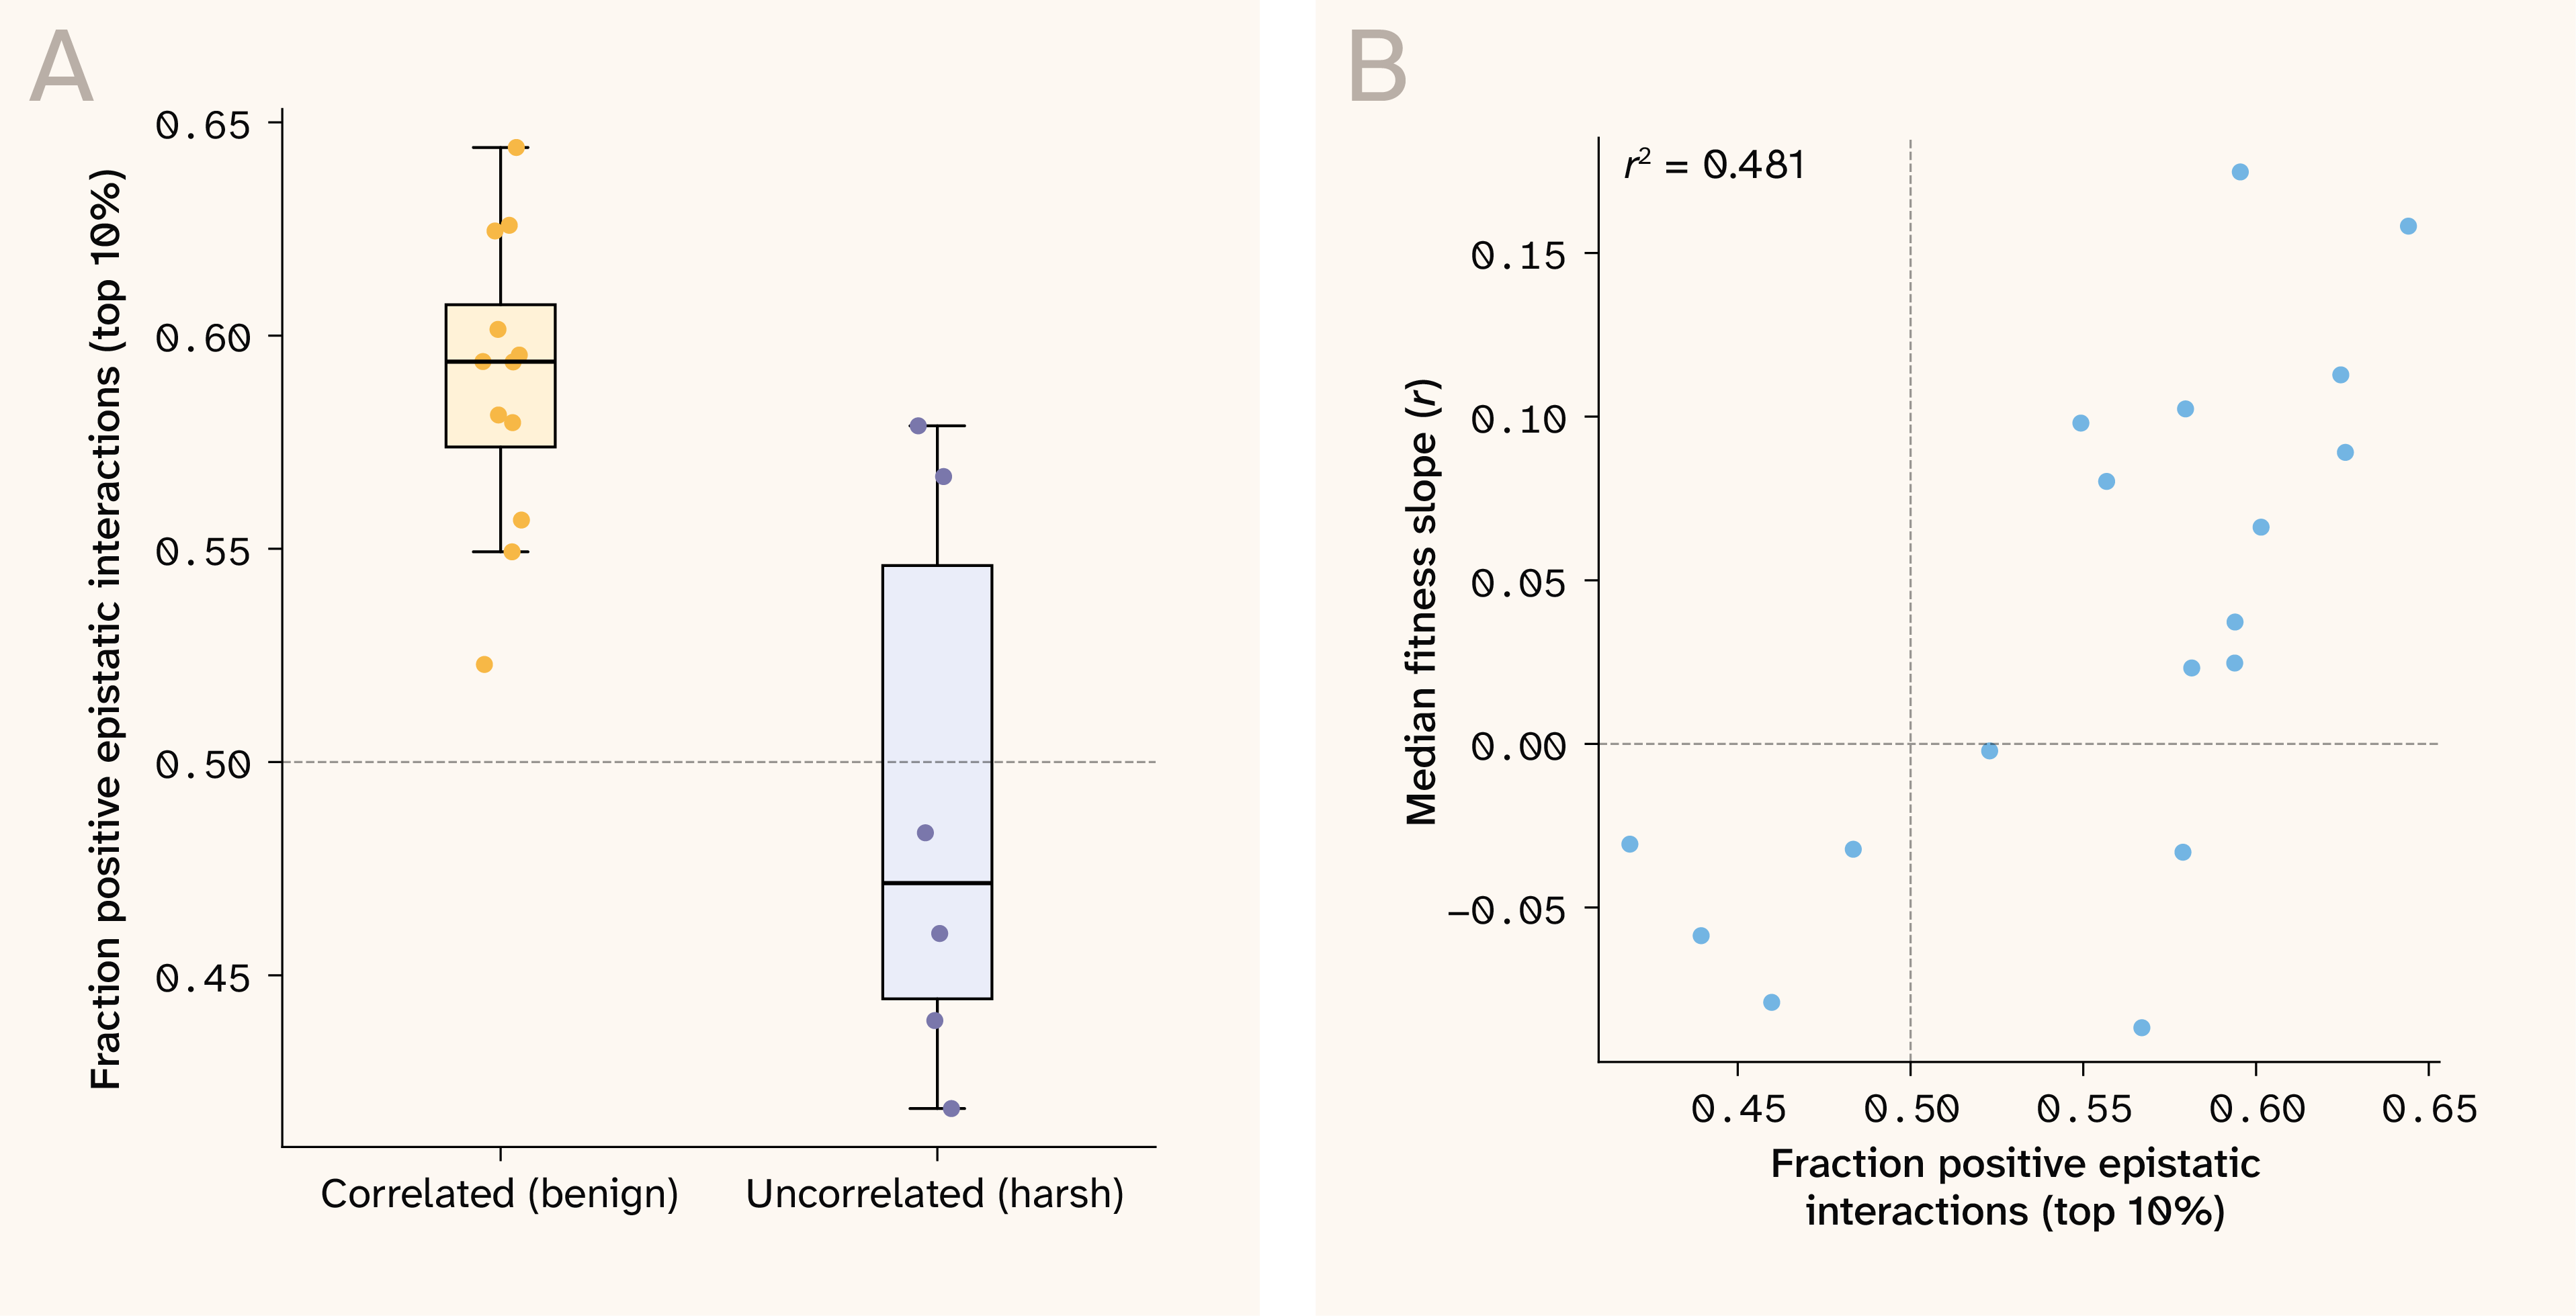
Figure 9. Enrichment of strong positive pairwise interactions in benign environments links increasing costs epistasis to parental co-adaptation.
(A) Fraction of positive strong pairwise epistatic interactions (top 10% absolute values) plotted for benign (correlated with 30C growth rate) vs. harsh (uncorrelated with 30C growth rate) environments.
(B) Median sensitivity–fitness correlation plotted against fraction of positive strong pairwise epistatic interactions for each environment.
Comparison to perturbation-based global epistasis inference
Our approach to detecting global epistasis using interpretable deep learning is distinct compared to conventional genetic perturbation-based approaches. Yet despite this, our results complement previously published work in many ways. For example, Johnson et al. 9 first reported increasing costs epistasis in a yeast cross with identical parental strains (BY × RM), under growth conditions analogous to the 30C condition in the dataset we use. While Johnson et al. employed a transposon mutagenesis library (selected for high-impact mutations), we focused on QTLs identified from standing genetic variation; yet, in both cases, we observe similar patterns of global epistasis, including evidence that QTLs near MKT1 and IRA2 drive global epistasis in this environment. Our results are in agreement with a suite of other work published on global epistasis showing that pairwise interactions with large-effect QTLs can explain much of the global epistatic signal, that such interactions are biased in direction, and that they shift between environments 8, 11, 15.
Previous work has also examined the interaction between global epistasis and proxies of environmental quality. Like us, Wei and Zhang 16 used a BY × RM F1 yeast cross to probe global epistasis across an even larger number of environments. However, these authors report a negative correlation between environmental quality and the absolute mean effect of a QTL substitution, suggesting that diminishing returns epistasis was stronger in higher-quality environments. While this is counter to our findings, we're cautious about directly comparing our results, as their study analyzed epistasis by comparing mean differences among fitness-segregated subpopulations of segregants, rather than direct comparisons of substitutions within specific genomes, which we achieve statistically, and other studies achieve through experimental manipulation.
Another key study by Ardell et al. 10 investigated the effects of ~100 transposon insertion mutations (from Johnson et al. 9) across six environments in a BY × RM yeast cross. The authors found that a remarkably simple linear model sufficed to explain mutational effects: within any given environment, lower fitness segregants had access to more beneficial mutations, while between environment differences were captured by a "pivot point" — the mean growth rate at which a typical mutation switches sign from beneficial to deleterious. Crucially, harsher environments were characterized by lower pivot points, placing the majority of segregants above the pivot and thereby enriching the available mutational supply for deleterious effects. This framework poses an interesting but unresolved comparison to our results. Within environments, our findings are broadly consistent with Ardell et al.: harsh environments harbor an abundance of low-fitness lineages whose mutational neighborhoods should be enriched for beneficial mutations (displaying diminishing returns epistasis). However, taking a cross-environment perspective, a tension emerges. Lower pivot points in harsh environments imply a predominance of deleterious mutations and therefore increasing costs epistasis — the opposite of both our cross-environment observations and the within-environment dynamics Ardell et al. themselves describe. Notably, Ardell et al. do not mechanistically resolve this apparent within- versus cross-environment inconsistency in their own framework, leaving its origin unclear. One resolution specific to our setting is parental co-adaptation. Unlike transposon insertions, the QTL alleles we study are standing genetic variants that have been subject to selection in their respective parental backgrounds. In benign environments — conditions closer to those under which the parental strains were maintained — we observe a significant enrichment of positive pairwise epistatic interactions, consistent with co-adapted allelic combinations that are synergistic within parental backgrounds. This sign-biased epistatic architecture, rather than pivot position alone, plausibly drives the increasing costs pattern we observe in benign environments, and its absence or disruption under chemical stress conditions may explain the shift toward diminishing returns. The cross-environment shift in global epistasis we document, therefore, likely reflects a genuine reorganization of the epistatic architecture across environments, rather than a simple pivot shift of the kind characterized by Ardell et al.
Key takeaways
We show that ELM is able to infer relevant biological signals — including expected quantitative genetic parameters — from neural networks trained on a yeast F1 genotype–phenotype dataset. The real power of this approach, however, is highlighted by the individual-level variant effect predictions which ELM allows us to estimate. Taking advantage of this resolution, we use ELM to reveal widespread global epistasis across 18 growth environments. Notably, the dominant mode of epistasis shifts depending on environment: benign conditions are associated with increasing costs, while chemical and metabolic stressors induce diminishing returns epistasis. Further, we show how this environmental shift is largely explained by a small set of epistatic hub loci whose pairwise interaction terms are sign-enriched in benign environments, consistent with co-adaptation of parental alleles under standard lab conditions. The global epistatic regime of a trait is, therefore, shaped by environmental context in predictable ways. These results highlight the potential of coupling deep learning with mechanistic interpretability to uncover biologically meaningful signals invisible to conventional approaches.
Next steps
There are several extensions to our work on interpretability with ELM that we are interested in pursuing.
First, we are designing an experiment to validate the global epistasis detected by ELM for a few target QTLs. We are confident our findings are meaningful, as we can link our global epistasis signal to previously reported pairwise epistatic patterns in these data. However, experimental verification of QTL effect scaling will be the most direct way we can verify that our use of ELM-derived sensitivity values isn't contaminated by artifacts of model training or data quality.
Next, we're excited to apply this approach to other G–P mapping datasets. In particular, we hope to uncover novel and useful associations between genetic variation and disease phenotypes by strategically combining feature selection, simple DL models, and ELM on human biobank data. In particular, we're curious to see whether our approach here can translate to genotype-by-environment interactions, which should be more prevalent in such data and are just as amenable to analysis in the ELM framework.
Finally, we encourage biologists to consider how ELM could be applied to other areas of biology, leveraging DL models. For example, ELM could potentially be used to probe the mappings learned by protein language models. We see no reason why ELM couldn’t be used to uncover within-protein epistatic interactions learned by such large-scale models, analogous to how we use ELM here to probe genome-wide epistasis. The creative application of mechanistic interpretability approaches, such as ELM, to models that have learned meaningful signals from their training data presents an exciting opportunity to uncover novel biology from DL models.
Be the first to comment on this publication.