Purpose
Protein structures inferred by structure prediction algorithms can be leveraged to address numerous biological questions. However, blindly using structures output by these models can be problematic. Since input sequences are rarely individually scrutinized, spurious amino acid sequences that result from genome misassembly or annotation can percolate through models and into protein structure databases.
By analyzing a published set of putatively conserved protein structures across 36 Drosophila species, we show that seemingly spurious protein structures are present in protein databases. Surprisingly, these structures include tandem dimers and even tandem trimers (proteins with two or three repeated domain copies, respectively), some of which appear to comprise two different genes. We employ a protein sequence and structure processing approach to investigate the composition of these tandem-domain structures, assess whether they're real or more likely assembly or annotation artifacts, and discuss how these findings should guide the increasing use of archived protein sequences and structures inferred by structure prediction algorithms.
This pub is intended for anyone using inferred protein structures in their research, particularly researchers inferring protein structures across non-model clades, and anyone interested in developing scalable tools to integrate information across levels of biological organization.
Background
Protein structural prediction has massively expanded over the last five years 1–3. While the success of these models has been contingent on the evolutionary breadth of the public sequence databases used to train them, substantial taxonomic biases in sequence archives and subsequently in training sets likely influence the accuracy of these models 4. Another source of error in model outputs comes from our own starting sequences for which we want to predict structures, since archived genomes and proteomes vary substantially in quality. These constraints ultimately hinder our ability to map, predict, and discover useful protein biology 5. Assessing and, if necessary, mitigating their potential effects should become a crucial component of protein structural prediction. Despite being aware of these constraints, their prevalence, downstream impacts, and the extent to which we currently need case-specific analytical frameworks to address them are unknown.
The problem
We stumbled upon a scenario that allowed us to start to address these questions. By analyzing an archived protein dataset containing highly variable protein structures within a putatively structurally conserved group of proteins, we identified, assessed the impact of, and mitigated these errors. Wu et al. recently generated a protein structure database spanning 824 insect species (TIPS) that contains 1.66 million existing protein structures from the AlphaFold database and 11.63 million new protein structures predicted by ESMFold 2, 6. In their paper, they included a figure showing that the D. melanogaster protein Takeout (To; Q9VBV3; the product of a clock-regulated gene involved in feeding) is structurally very similar to a Takeout-like D. mojavensis protein (B4KE22), despite having very different sequences (reported sequence similarity = 0.222, reported structural similarity = 0.927). This relationship was striking and seemed to lie at the extreme end of detectability, potentially falling within the sequence similarity “twilight zone” 7.
While Takeout in this context refers to the protein encoded by a single specific gene, takeout, the takeout gene family contains many members. Over 20 homologs have been described in some insect species 8–9. Members of the takeout family are sequence-diverse (except for two conserved defining motifs) but structurally similar 10, and they underpin aspects of behavior, aging, and metabolism 8. takeout genes have also been shown to be sequence-similar to genes in other gene families, most notably those in the juvenile hormone binding protein gene family 10–11.
Given this apparent diversity, we wondered what we’d find if we expanded beyond Wu et al.’s specific pairwise example 6 to a broader set of sequences. As an exploratory analysis, we searched for proteins with sequences similar to Q9VBV3 in the TIPS database. This search identified 1,000 proteins. We then filtered these hits to retain only proteins from species in the paraphyletic genus Drosophila (reducing the set to 73 proteins; an arbitrary choice to reduce the number of taxa in our protein set while maintaining a broad macroevolutionary timespan, > 50 MY 12), and set out to calculate the relationship between amino acid sequence differentiation and protein structural variation across proteins.
However, we quickly ran into a roadblock. Aligning our Drosophila protein sequence hits revealed that some sequences were 2–3 times longer than others, introducing problematic gaps in the alignment. While we knew that molecular conservation in Takeout and Takeout-like proteins was proposed to be predominantly at the structural level rather than the sequence level, this variation still seemed extreme. Digging deeper into the sequence and structure of these problematic sequences revealed that they comprised tandem dimers or tandem trimers of the putatively conserved focal domain in D. melanogaster (Q9VBV3) highlighted by Wu et al. 6 (Figure 1).
It's worth noting that these putatively erroneous structures included both novel ESMFold-derived structures and AlphaFold database entries. What’s more, searching the AlphaFold database for proteins similar in sequence to Q9VBV3 returned archived tandem dimers (UniProt ID: A0A9P9YYW2), the tandem trimer we observe in our dataset (UniProt ID: A0A6P4I8V4), and even tandem tetramers (UniProt ID: A0A0L0BU65 and A0A1I8M4H0)! Additionally, our alignment suggested that, despite searching for sequences using the starting gene takeout, we appeared to have also returned hits from additional, different, genes.
Figure 1. An interactive gallery of different Takeout protein structures, including the focal single-domain structure and additional tandem-domain structures.
This includes:
(1) A single focal Takeout domain (P005083008910 in Drosophila melanogaster)
(2) A tandem dimer (P005100011380 in Drosophila takahashii)
(3) A tandem trimer (P005081003743 in Drosophila kikkawai)
(4) A partial domain (P005102009207 in Drosophila virilis)
We needed to get to the bottom of what was going on, since the presence of unexpected tandem-domain structures in a putatively structurally conserved protein family has serious implications for the increasing use of structures inferred by structure prediction algorithms. We set out to address a number of questions:
- What sequences and structures are present across our dataset?
- What are the tandem-domain structures shown in Figure 1 made up of?
- Are the tandem-domain structures likely to be real, or are they assembly and annotation artifacts?
Determining whether these protein structures represent erroneous sequences that have percolated through protein structural inference into data archives is key to guiding the future use of archived structures. Protein structural inference is increasingly being run on a broader array of protein sequences and non-model taxa, for which we have far less (if any) a priori knowledge. Therefore, evidence that erroneous protein structures have resulted from the archiving of erroneous amino acid sequences from assembly or annotation necessitates that we develop and deploy methods to identify and rectify these errors prior to structural inference.
Our approach
To address these questions, we developed a pipeline to better define and compare like-for-like protein sequences and structures, avoiding our naive comparison of single-domain structures to tandem dimers or tandem trimers. We started with the same 73 amino acid sequences from our search of the TIPS database (which used D. melanogaster Q9VBV3 as the query) and added the sequences for the two reference proteins compared by Wu et al. 6, Q9VBV3 and B4KE22, to aid interpretation of our analysis.
Sequence alignment and domain-splitting
First, we coarsely separated our input 75 sequences into putative monomers and putative tandem-domain proteins. To do this, we produced a kernel density estimate of sequence lengths from our raw protein sequences, which detected peaks at different lengths. Using the logic that if monomers are ~L residues long, dimers should cluster near ~2L, and trimers near ~3L, we calculated length ratios between the detected peaks, designating a putative monomer peak, a dimer peak, and a trimer peak. The sequence closest to the monomer peak was selected as a reference monomer, and a Smith-Waterman local alignment 13 was carried out, using our reference monomer to search each additional sequence for hits. If a match was found, that section was masked, and the matching run was repeated until no additional good matches were found. Where two good hits were found, a sequence was labeled as a putative dimer, and for three, the sequence was labeled as a putative trimer. This was repeated with four separate reference monomers to cross-check sequence assignment (accounting for the possibility that the sequence closest to our monomer peak was not representative), and the test yielding the most successful hits was retained. Short putatively incomplete domains were also removed.
Monomer sequences were written to a new FASTA file and aligned using MAFFT (v7.525; with default parameters 14). Next, we used HMMER (v3.4 15) hmmbuild to create a profile hidden Markov model (HMM) that captures shared sequence characteristics across our aligned monomers, which we could then use to break tandem-domain sequences into their constituent parts. To do this, we aligned our input 75 sequences using MAFFT (v7.525; with default parameters 14), generating the same problematic alignment that alerted us to unusual protein structural variation. Next, we used hmmsearch from HMMER (using E-value threshold of 0.001) and our monomer-trained profile HMM to sweep through our aligned input sequence data to identify and designate comparable domains. Our profile HMM identified a key domain within protein sequences that represents a like-for-like unit we could then use as the unit of analysis. In our case, this domain averaged 244 amino acids in length. We then extracted comparable domains across our original FASTA file using these domain envelope coordinates (with Biopython v1.86 16). This process effectively split tandem dimers and tandem trimers into new sequences corresponding to their constituent domains, and minimally trimmed single-domain sequences, resulting in 85 directly comparable domain sequences that we used for further analyses. We then used Biopython (v1.86) to extract new protein structures corresponding to each domain found in our search using the sequence coordinates of domains in our original sequences and protein PDB files returned in our original TIPS search as input. Proteins shorter than the mean length − 2 × SD were removed (excluding two partial domains from further analyses).
Domain alignment, phylogenetics, and protein identification
The new single-domain sequences were then realigned into a domain alignment using MAFFT as before, this time reducing the alignment gaps, as tandem dimers and tandem trimers were now split. To disentangle the composition of tandem-domain proteins and the evolutionary relationships between sequences and protein structures, we produced a phylogenetic tree from these sequences using an approximate maximum-likelihood method implemented in FastTree (v2.2.0, default parameters). The resulting tree was midpoint rooted and visualized using Biopython’s (v1.86) Phylo module and FigTree (v1.4.4). To interrogate variation across our tree, we assigned sequences to clusters corresponding to the main clades in our tree. To help determine the constituent domains within tandem-domain proteins, we highlighted links between the resulting sub-domains in our tree. Wanting to better understand the deep branching and clustering structure in our tree, we used BLASTp (v2.17.0) to identify which proteins each cluster contained. We did this by first downloading the Drosophila melanogaster reference proteome (UniProt proteome ID: UP000000803) from the UniProt REST API and constructing a local BLAST protein database using makeblastdb from the NCBI BLAST+ suite (v2.17.0), with sequence ID parsing enabled (-parse_seqids). This database was then used as the reference for a series of BLASTp searches spanning the 3 D. melanogaster sequences in our dataset (present in Cluster 1 and Cluster 2 and the Q9VBV3 reference sequence) along with 4 D. obscura sequences (spanning Cluster 1, Cluster 2, and Cluster 3), and our single D. mojavensis sequence (which constituted Cluster 4 and was present as the second reference sequence B4KE22). BLASTp searches were performed with an E-value threshold of 1 × 10⁻⁵. Gene names and protein descriptions were retrieved by cross-referencing BLAST hits against the local copy of the D. melanogaster proteome.
Pairwise analysis of protein sequences and structures
To quantify differences within and between clades, and within and between single-domain proteins and tandem-domain proteins, we calculated a series of pairwise statistics across our data. First, sequence differentiation was calculated using Biopython’s AlignIO module (v1.86). We calculated identity between the pair of sequences, the proportion of matching residues across aligned positions (excluding sites where either sequence had a gap), and then calculated sequence divergence as 1-identity. Patristic distances (the sum of branch lengths between each pair of tips in the tree) were then calculated from our midpoint rooted tree using Biopython’s Phylo module (v1.86). Since pairwise sequence divergence and patristic distances are the same regardless of the direction in which they are calculated across a pair of sequences, we calculated only the upper triangle of the pairwise distance matrix. To compare these values against protein structural similarity, we calculated pairwise protein structural similarity using TM-align 17, which performs structure-based sequence alignment and returns TM-score, which represents a length-normalized similarity score (from 0 to 1, where 1 represents a perfect structural match). Since TM-scores are asymmetric, TM-scores were calculated in both directions. All three metrics were integrated into a single dataframe using Pandas (v3.0.0 18) for future analyses.
To test the relationships between sequence divergence, patristic distances, and TM-scores, we calculated Pearson correlations between all combinations of the three metrics using pearsonr from SciPy (v1.17 19) and carried out linear regression using np.polyfit from NumPy (v2.4.2 20). Pearson r2 and p-values were reported for each, and the relationship between sequence divergence and TM-score was plotted using matplotlib (v3.10.8 21). We also produced boxplots using matplotlib (v3.10.8) to illustrate the variation in these three statistics. First, to compare within-cluster variation in sequence divergence, patristic distances, and TM-scores, we extracted pairwise comparisons from our dataframe that were between two proteins in Cluster 1, two proteins in Cluster 2, two proteins in Cluster 3, and then all between-cluster pairwise comparisons, and plotted these alongside the comparisons representing the reference sequences Q9VBV3 and B4KE22. To help elucidate whether our tandem-domain sub-domains looked similar or different to those genes annotated and folded separately, we also compared sequence divergence, patristic distances, and TM-scores. This time, we identified pairwise comparisons in which a given species had separately annotated proteins in Cluster 1 and Cluster 2, and compared statistics between those, and the subdomains of different split tandem dimers, and the tandem trimer (separating the three types of dimers — C1–C1, C2–C1, and C1–C3).
Pub preparation
We used Claude Opus 4.6 to refine our methodology, write and refactor code, and suggest wording for the “Our approach” section, which we then revised. We used Grammarly Business to suggest wording ideas and then chose which small phrases or sentence structure ideas to use.
The results
All code and data are available in our GitHub repo (DOI: 10.5281/zenodo.19196287).
Defining and analyzing like-for-like protein domains
Identifying tandem-domain proteins and splitting them into like-for-like domains is critical to being able to implement comparative tools to assess variation across proteins with different numbers of domains. This process also constitutes the first step in determining if tandem-domain structures have been inferred erroneously. Out of our starting set of 75 sequences, 64 comprised a single domain, eight comprised two tandem domains, and a single sequence comprised three tandem domains. We also observed two partial domains, which were removed from subsequent analyses. All subsequent results describe analyses carried out on these individual constituent domains resulting from our HMM-profile-based domain-splitting approach, i.e., each split tandem dimer has two sequences and structures, and each tandem trimer, three.
After splitting our tandem-domain protein sequences and structures of interest into comparable domains, we leveraged phylogenetics to identify the constituent proteins in our dataset and to determine whether tandem-domain structures comprise a single or multiple discrete proteins. Our phylogenetic analysis separated our domains into discrete clades (Figure 2, A), which our BLASTp results indicated corresponded with different proteins (Figure 2, B). Cluster 1 contains 44 sequences (blue in Figure 2) and includes Takeout proteins (Drosophila melanogaster protein P005083008910 had a top BLASTp hit to Q9VBV3, Takeout To; Identity: 100.0%, E-value: 0.00e+00). Cluster 2 contains 35 sequences (orange in Figure 2) and contains Juvenile hormone binding protein 7 (Jhbp7) proteins (Drosophila melanogaster protein P005083008909 had a top BLASTp hit to Q9VBV4, Jhbp7; Identity: 100.0%, E-value: 0.00e+00). Cluster 3 contained only three sequences (green in Figure 2), which we believe to represent a third protein, since taxa in this clade also had additional proteins placed in Cluster 1 and Cluster 2 (Drosophila obscura protein P005088004859 had a top BLASTp hit to CG11854, which is annotated as an unspecified Takeout-like protein; Identity: 64.5% E-value: 1.46e-118). Cluster 4 contains only a single sequence, the reference protein B4KE22 (yellow in Figure 2), which appears to be an additional Takeout-like protein (Drosophila mojavensis protein B4KE22 had a top BLASTp hit to CG31189; Identity: 52.4%, E-value: 3.19e−93).
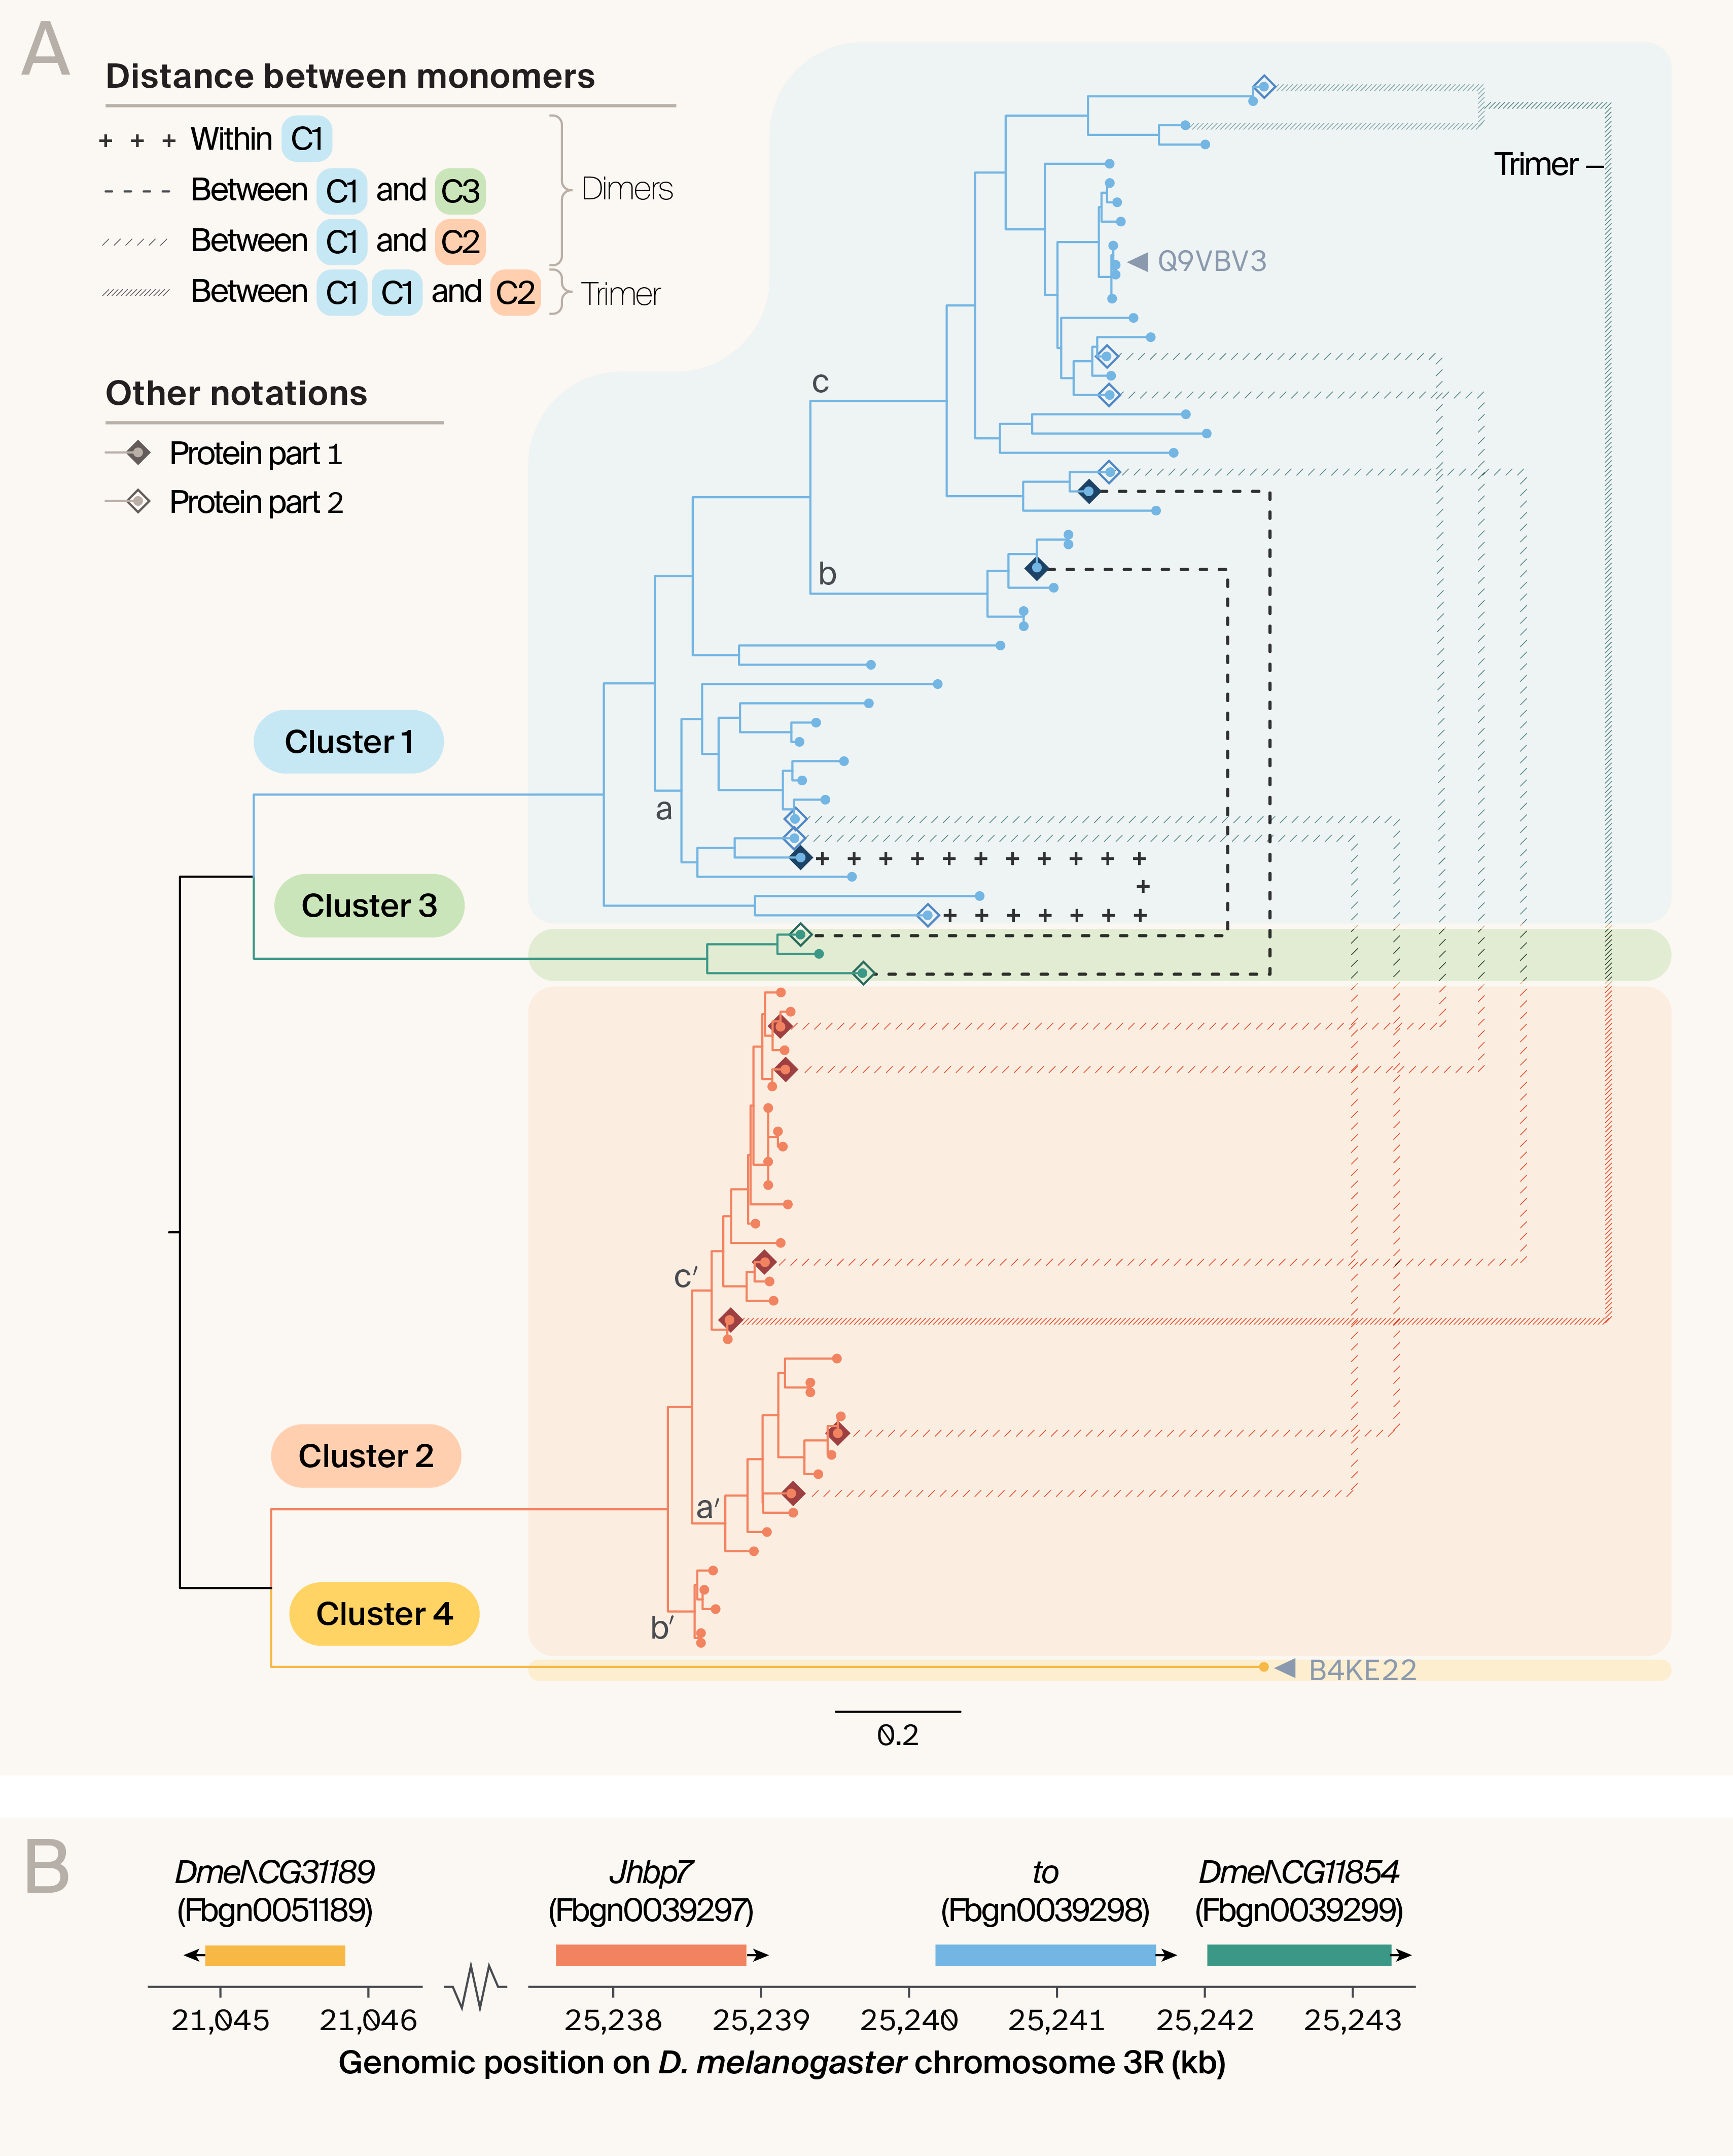
Figure 2. Phylogenetic analysis reveals that tandem-domain proteins are mostly composed of two distinct proteins.
To determine the composition of the tandem-domain proteins in our dataset, we produced:
(A) A gene tree of the 81 domains resulting from our original 85 input sequences, showing the discrete clustering of domains into Cluster 1 (which also contains the reference protein Q9VBV3), Cluster 2, Cluster 3, and Cluster 4 (which just comprises the reference protein B4KE22). Domains that resulted from split dimers and trimers are linked to one another, with the line type denoting the type of tandem dimer they originated from. For these split dimers and trimers, diamonds denote whether or not that domain was part 1 (filled diamond) or part 2 (unfilled diamond). Three core clades in the tree that highlight different branching structures are labeled a, b, and c in Cluster 1 and a′, b′, and c′, in Cluster 2 (a fully annotated tree with species and protein IDs for each domain can be found in the associated Jupyter Notebook in the pub GitHub repository).
To better understand the identity of each cluster, we plotted:
(B) The relative locations of genes that putatively correspond to each cluster along the Drosophila melanogaster genome, including Dmel\CG31189 (Cluster 4), Jhbp7 (Cluster 2), takeout (Cluster 1), and Dmel\CG11854 (Cluster 3).
Since our phylogenetic analysis confirmed that our domains spanned additional proteins to Takeout, we used the branching structure of our phylogeny and the sequence and structural characteristics of each cluster to reveal evolutionary differences between proteins. The clusters corresponding to takeout and Jhbp7 (Cluster 1 and Cluster 2, respectively) have distinctive branching patterns in our phylogenetic tree (i.e., the arrangement of clades in Cluster 1 — (a,(b,c)) varies from their corresponding clades in Cluster 2 — (b′,(a′,c′)) in Figure 2). takeout genes also span greater evolutionary distances than the Jhbp7 genes, shown by our analysis of within-cluster pairwise sequence variance and patristic distances (Figure 3; C1 vs. C1 mean sequence divergence and patristic distance = 0.3982 and 0.8364, respectively, compared to C2 vs. C2 mean sequence divergence and patristic distance = 0.1503 and 0.2308, respectively). These results confirmed that, although sequence-similar, Takeout proteins and Jhbp7 proteins have distinctive evolutionary histories and sequence characteristics.
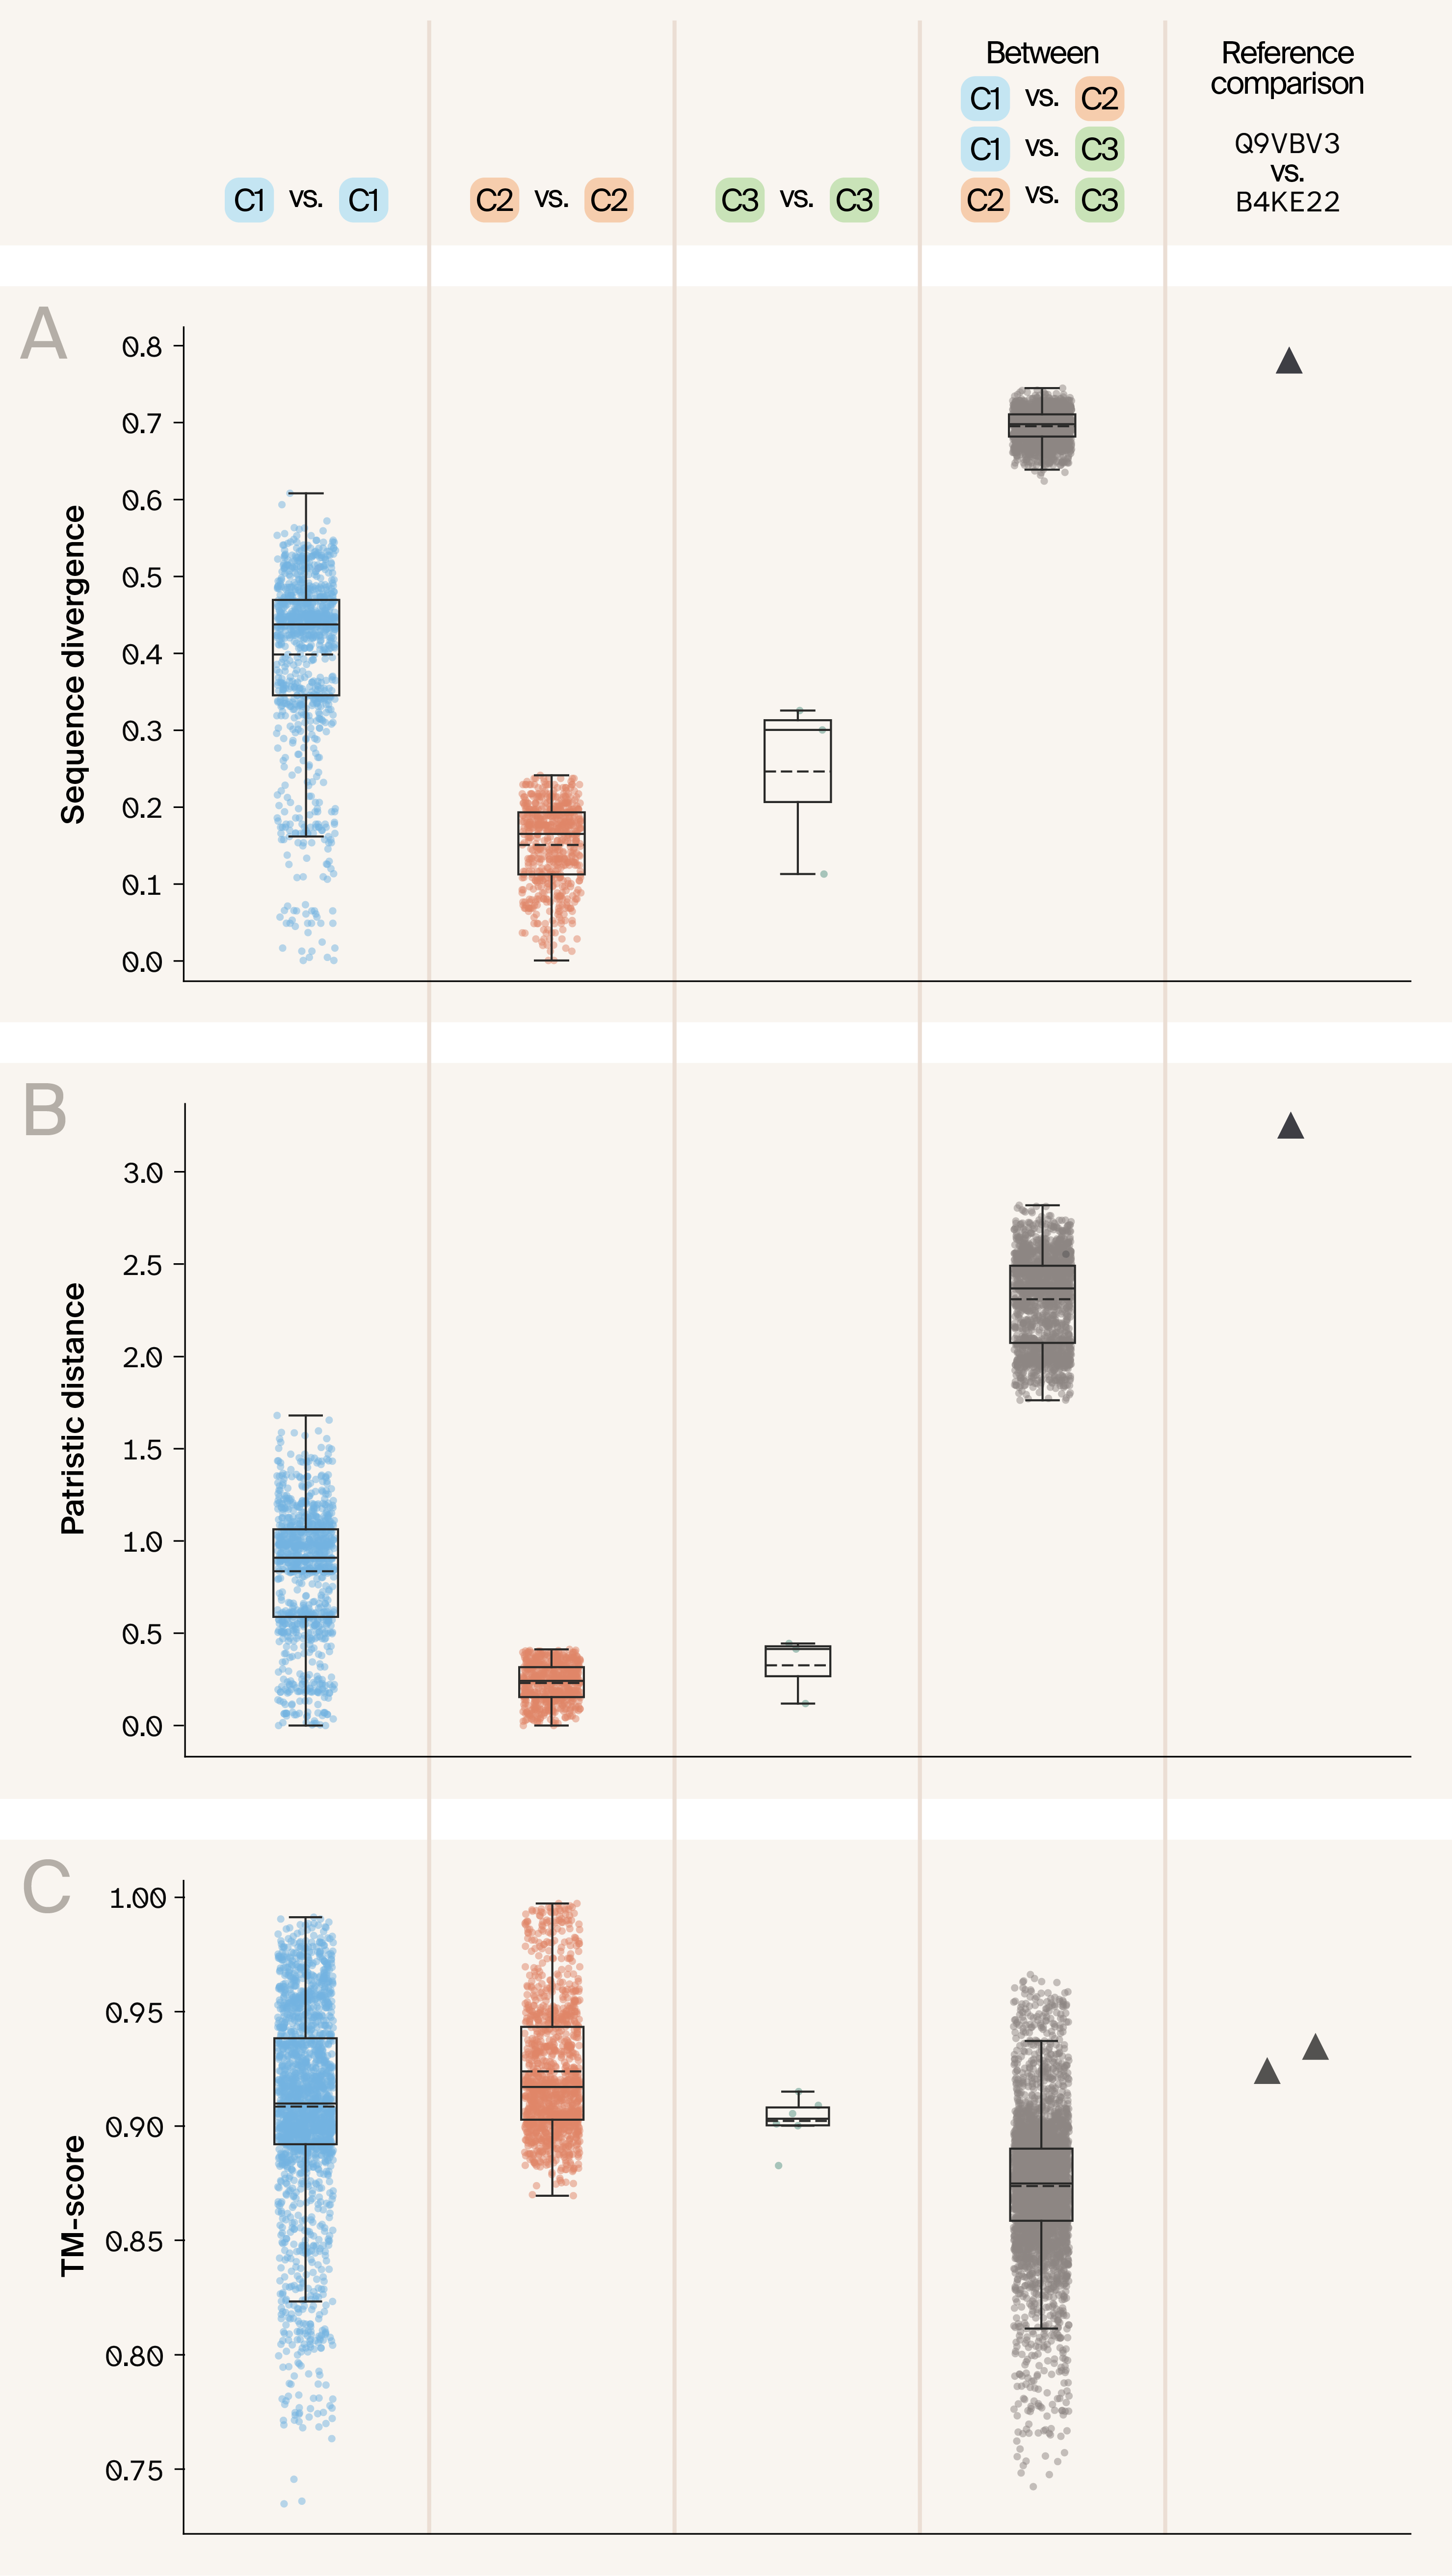
Figure 3. Protein domains from different clusters vary in sequence similarity and patristic distance, but have similar protein structures.
To confirm that different clusters include sequences from different proteins with different evolutionary histories and patterns of sequence variation, for each pair of domain sequences (i.e., split dimers/trimers had multiple sequences corresponding to one per domain), we plotted:
(A) Pairwise sequence divergence
(B) Pairwise patristic distances
(C) Pairwise protein structural similarity (TM-score).
Each plot includes protein pairs with both members from Cluster 1 (blue), both from Cluster 2 (orange), both from Cluster 3 (green), and pairwise comparisons between proteins in different clusters (black). Additionally, we show the same metrics for the comparison between D. melanogaster Q9VBV3 and D. mojavensis B4KE22 from Wu et al. 6 (triangle). Sequence divergence and patristic distances are represented as a single value for each pair, since they are the same when calculated in either direction, whereas TM-scores are directional (based on target/query comparison) and thus, in the TM-score plot, two points are present for each pair of proteins. For each box, the top and bottom of the box represent the bounds of the interquartile range, the solid line represents the median value, the dashed line represents the mean value, and the whiskers extend to 1.5 times the interquartile range beyond the box.
To be able to compare these patterns of sequence diversity with protein structural similarity, we calculated TM-scores, a measure of structural similarity between pairs of proteins, both within and between our protein clusters, using TM-align 17. Pairwise within-cluster TM-scores were very similar within Cluster 1 and Cluster 2, with Jhbp7 domains (Cluster 2; orange points) having only minimally higher mean TM-scores than Takeout domains (Cluster 1 vs. Cluster 1 comparison mean = 0.9085, compared to Cluster 2 vs. Cluster 2 comparison mean = 0.9239), indicative of more conserved protein structure. As expected, pairwise statistics calculated between domains in different clusters (grey points in Figure 3) showed substantially higher sequence divergence and patristic distances, and accordingly, lower TM-scores. Across our full dataset, we observe that sequence divergence and patristic distances are inversely correlated with TM-scores, as expected (Figure 4). Our results also support the Wu et al. 6 finding that the decline in TM-scores with increasing sequence divergence or patristic distance in Takeout and Takeout-like proteins is remarkably small, reflecting strong structural, and likely functional, conservation.
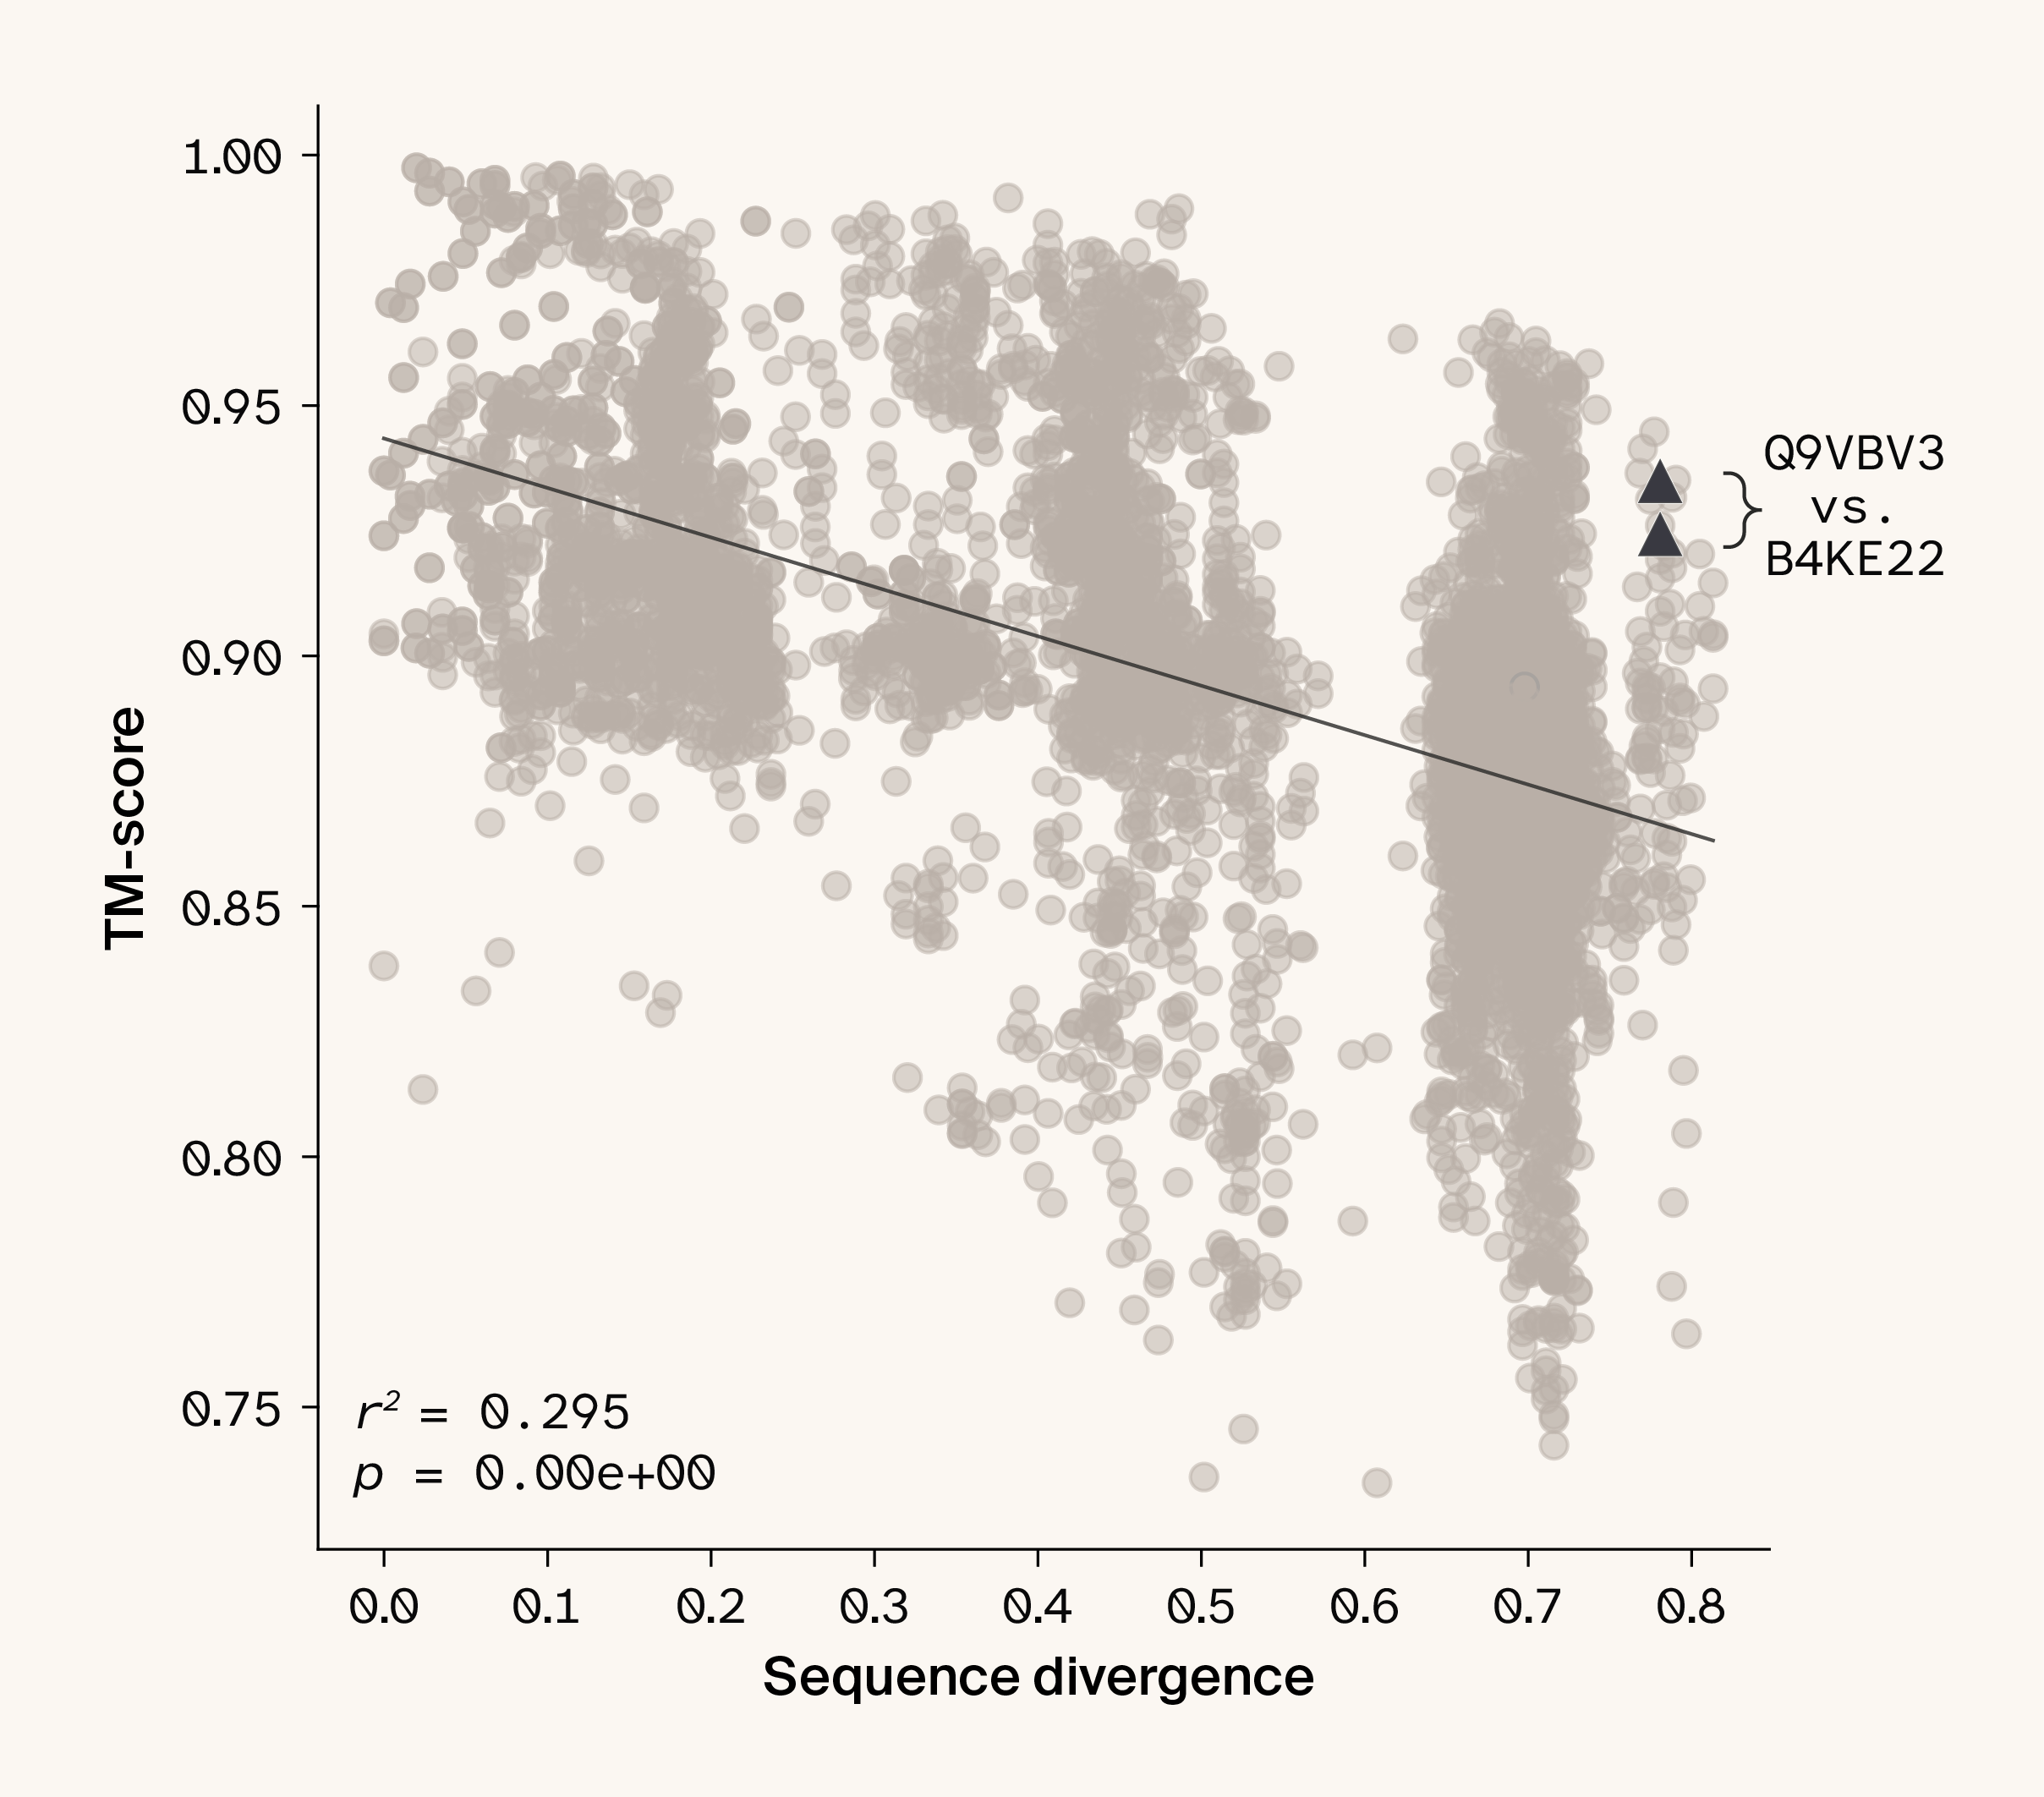
Figure 4. Protein structural similarity decreases only slightly as sequence divergence increases.
Plotting all pairwise comparisons of protein domains in our dataset shows that as sequence divergence increases, protein structural similarity decreases, albeit only minimally (Pearson correlation r2 = 0.295, p < 0.001). The two reference proteins highlighted by Wu et al. 6 are indicated with triangles. Since TM-score is directional, each pairwise comparison has two associated points.
What are the tandem-domain proteins made up of?
After confirming that tandem-domain proteins were present in our dataset and revealing that the domains appeared to represent multiple discrete proteins, we used our phylogenetic tree to identify the constituent proteins of each tandem-domain structure. Splitting the eight tandem dimers in our dataset into their constituent domains revealed three discrete arrangements:
- A tandem dimer of the protein Takeout. That is, where both domains are placed in Cluster 1 (Takeout-Takeout/C1–C1 dimers; observed only once, in Drosophila albomicans; +++ line in Figure 2, A).
- A tandem dimer linking one Jhbp7 domain (Cluster 2) to a Takeout domain (Cluster 1) Jhbp7-Takeout/C2–C1 dimers; observed five times; /// line in Figure 2, A), observed across even distantly related Drosophila species, including D. takahashii, D. subpulchrella, D. bipectinata, D. arizonae, and D. innubila.
- A tandem dimer linking one Takeout domain (Cluster 1) and a protein domain in Cluster 3 (Takeout–CG11854/C1–C3 dimers; observed twice; dashed line in Figure 2, A), observed in two different species, D. ananassae and D. subobscura.
The tandem trimer comprised one domain in the Jhbp7 cluster connected to two domains that clustered into the Takeout group (i.e., a Jhbp7–Takeout–Takeout/C2–C1–C1 arrangement; labeled in Figure 2, A).
To get a more granular view of variation across tandem-domain proteins, we calculated sequence and protein structural similarity between the sub-domains of each tandem dimer, and compared this to cases where, in a given taxon, takeout and Jhbp7 were annotated separately. To do this, we compared pairwise inter-domain patterns of sequence divergence, patristic distance, and TM-scores across proteins in different categories. We found that C2–C1 dimers had comparable distributions of inter-domain sequence divergence and patristic distance to pairwise comparisons between discrete intra-specific Jhbp7 and Takeout domains located in C2 and C1, respectively Figure 5. C1–C3 dimers had slightly lower sequence divergence, as reflected in the clustering of C3 domains as sister to C1 in our phylogeny. Unsurprisingly, given that we think they constitute two copies of the protein Takeout, sequence divergence was much lower in the C1–C1 dimer. Patterns of variation in TM-scores reflected an inverse relationship to sequence divergence, although variance as a whole was much lower, as TM-scores were high across comparisons. C2–C1 pairwise TM-scores again reflected those of monomeric C1 and C2 domains, with both C1–C1 dimers and C1–C3 dimers having higher TM-scores. These results confirm that, in general, protein structural similarity is high across our domains but remains inversely correlated with sequence divergence.
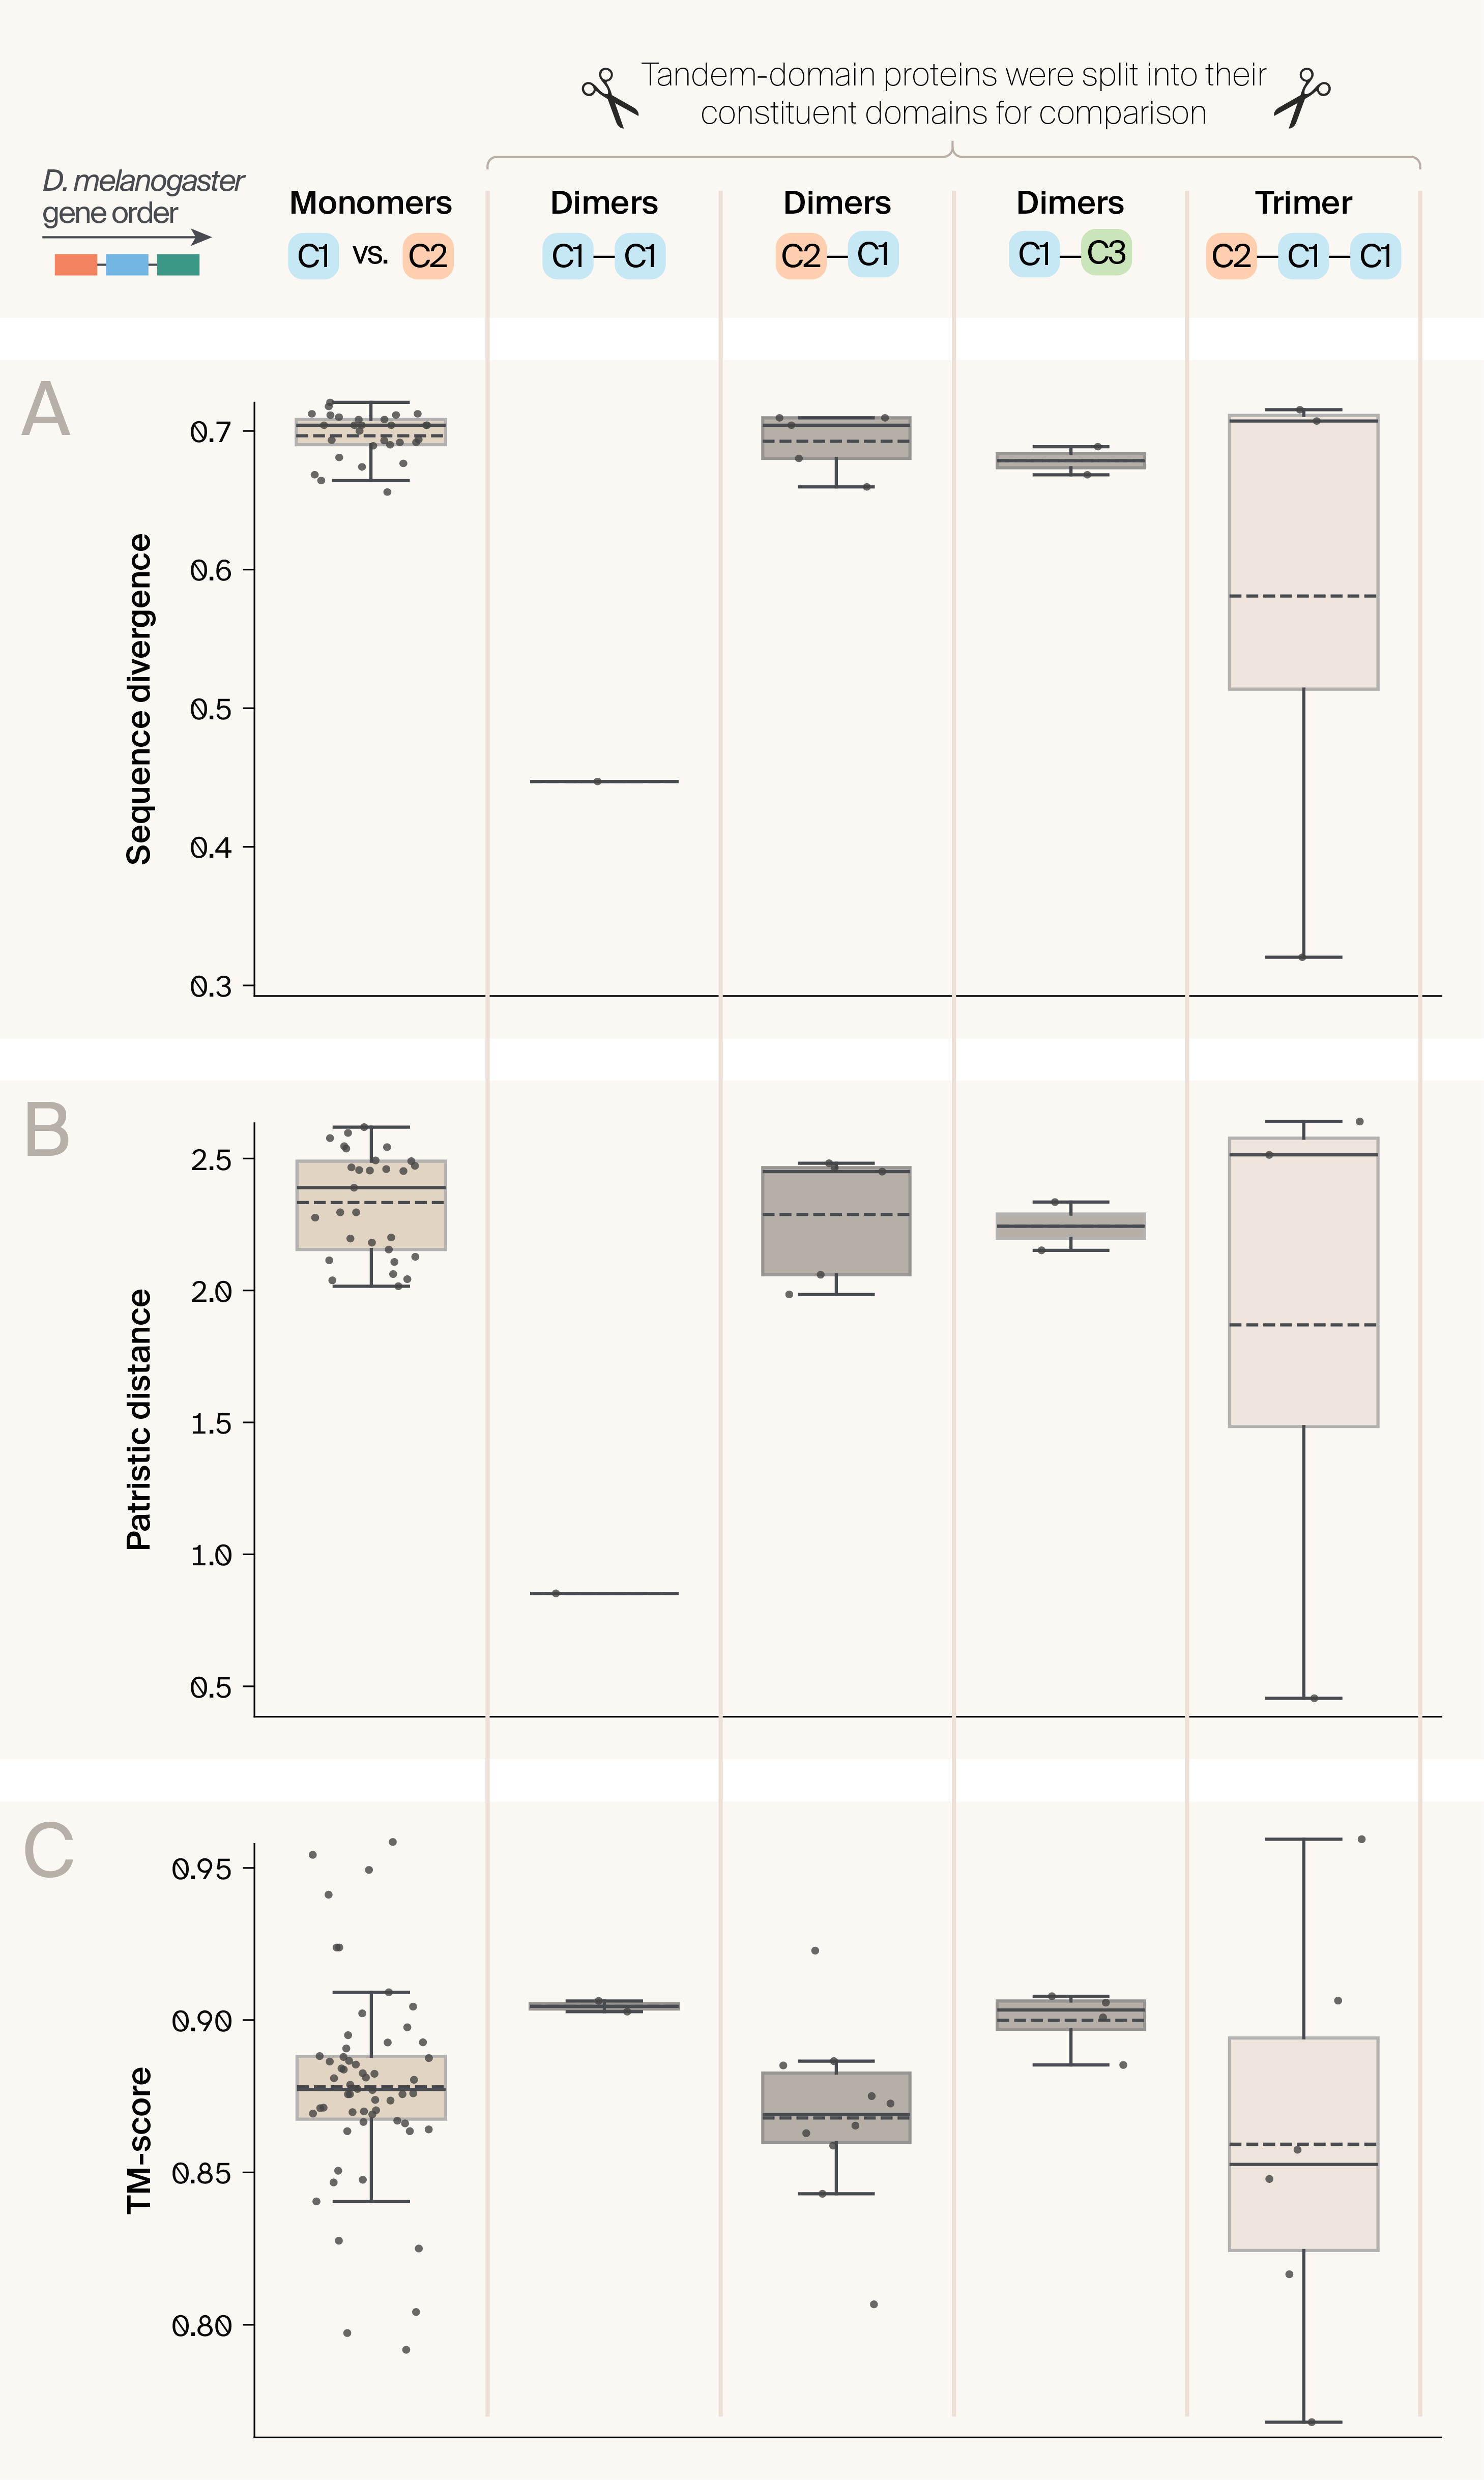
Figure 5. The constituent domains of tandem-domain proteins have similar characteristics to those annotated as discrete domains.
Patterns of intra-specific pairwise (A) sequence divergence, (B) patristic distance, and (C) TM-scores are similar between single-domain proteins present in our dataset (leftmost box; pairwise comparisons for each Drosophila species with a protein in Cluster 1 and a protein in Cluster 2), and tandem-domain proteins we split into their constituent domains (four rightmost boxes). For each box, the top and bottom of the box represent the bounds of the interquartile range, the solid line represents the median value, the dashed line represents the mean value, and the whiskers extend to 1.5 times the interquartile range beyond the box.
Are the tandem-domain proteins in our dataset real?
While we cannot fully rule out that tandem-domain proteins in our dataset are real, we believe our results provide compelling evidence that they likely represent artificial structures. Given their composition, we believe they are most likely the product of genome misassembly or incorrect annotation. Most critically, not all tandem-domain proteins comprise the same sub-domains. While this alone is not conclusive, since different true tandem-domain protein structures could have arisen multiple times, the constituent domains of these proteins have the same characteristics as other non-tandem versions of the same proteins. In other words, we do not find that domains within the same dimer-type cluster are clustered together in the phylogenetic tree, indicating they are unlikely to have a single shared evolutionary origin. Additionally, pairwise patterns of sequence divergence and structural similarity between constituent domains of tandem dimers are similar to those of their monomeric/non-tandem counterparts, suggesting they’ve evolved similarly, which we think would be unlikely if tandem dimers were under positive selection (in this case, we might expect reduced variance in sequence and structural variation among constituent domains).
If these proteins aren't real, then what do we think could cause these structures, and the sequences that initiated their inference to be present in data repositories? Our BLASTp results and phylogenetic analysis might suggest a simple explanation: sequence misassembly and/or misannotation. The most compelling evidence for this is that across our tandem-domain proteins, the order of the sub-domains in the dimer always matches that of the gene order in the D. melanogaster genome (Figure 2; excluding the one C1–C1/Takeout–Takeout dimer we observe). This holds true for the dimers from seven different species spanning the two most abundant categories. Genome misassembly or incorrect annotation could easily lead to this observation if protein start and/or end designations either run through Jhbp7 and takeout concurrently (observed five times) or takeout and then a CG11854-like sequence concurrently (observed two times).
What about the C1–C1 dimer? We hypothesize that sequencing a heterozygous Drosophila albomicans individual and the production of a haploid genome assembly from this data could result in two distinct takeout alleles being erroneously combined into a single sequence. The subsequent annotation of this region (or possibly transcript reconstruction of RNA-seq data using this reference) could result in an artificial Takeout–Takeout amino acid sequence and subsequent protein structure similar to the one we observe (although this is speculative). The misassembly and misannotation of two heterozygous takeout alleles might also help explain why the constituent domains of the C1–C1 dimer are not sister to one another in the tree. Although we observed only one tandem trimer in our dataset, it combines the C1–C1 and C1–C3 arrangements observed separately. Our observation of multiple discrete arrangements of tandem-domain proteins perhaps suggests that this protein family or genomic region may be particularly challenging to assemble correctly. Future work should aim to highlight whether other spurious tandem-domain proteins in data archives are more likely to comprise adjacent proteins in the genome than distantly situated proteins.
Outlook
So what does this mean for those of us trying to leverage protein structures inferred by structure prediction algorithms to address biological questions? First, our results highlight the need to consider the array of scales over which we want to compare protein sequences and structures. This will be critical for developing tools to search across the entire protein universe, where extensive, real protein structural variation is prevalent. While we believe the Drosophila tandem-domain structures analyzed here are likely misassembly or misannotation artifacts, multi-domain proteins are prevalent. We will need to refine approaches to effectively split up sequences and structures into meaningful, comparable constituent units before analyzing, as we did here. While comparing like-for-like domains is common practice in protein biology, it is less common in evolutionary biology, where we typically resist over-trimming or subsetting sequences to retain power for evolutionary inference 22. Developing analysis pipelines with cross-domain expertise will be essential to develop scalable analysis frameworks that can handle an increasing number of structurally variable and unstudied protein structures from non-model taxa.
It also appears that evolutionary-scale structural prediction will always risk influence from variation in genome and proteome quality. Since mistakes in archived genome and protein sequences can percolate silently through these models, mechanisms that rigorously verify data quality and accuracy will be of great utility. This is all the more important given that models are aggressively expanding into unknown areas of biology 23–24. As it stands, erroneous protein sequences and their subsequently incorrect structures are likely limiting our ability to describe general patterns of biological variation. Better processing of input protein sequences and the development of scalable tools to identify and process tandem-domain proteins in datasets will be critical to asking broad questions about protein novelty, bio-utility, and evolutionary variation.
Update
Following the release of this pub, a colleague informed us that one of our putatively erroneous tandem dimers (P005100011380 in Drosophila takahashii; Figure 1; gene ID: LOC108064419) appears to have now been correctly resolved into its constituent genes. Wondering what led to the amendment of these gene annotations, we did some digging.
Supplementary Table S2 from Wu et al. 6 shows that the genome accession used for Drosophila takahashii was GCF_000224235.1, Dtak_2.0, an assembly from 2013. Looking up the sequence of gene LOC108064419 in this assembly indeed shows the 523 amino acid (aa) sequence [XP_017007418.1] that comprises the tandem dimer (corresponding to structure P005100011380 in TIPS). However, looking up the gene ID alone in NCBI now links to the gene Jhbp7 in a newer assembly, GCF_030179915.1, DtakHiC1v2, uploaded in 2023. This more up-to-date genome assembly and annotation (which also uses RNA-seq data) indeed resolves Jhbp7 and takeout as two separate genes. Jhbp7 (Gene ID 108064419; XP_044251536.1) has a length of 251 aa, in the range of our identified monomers, and takeout (gene ID 123003336; XP_044251535.1) is similarly annotated as a 248 aa protein. The gap sequence between constituent gene sequences changed substantially between the two genomes. Comparing the tandem dimer sequence to the updated sequences of each gene, we found that there is a "linker" sequence of 24 aa in the tandem dimer sequence. However, in the contemporary assembly, Jhbp7 ends at position 31,703,820, and takeout starts at position 31,705,667 (chromosome 3R), a gap of 1847 bases (equivalent to ~616 aa in length; both constituent protein sequences are exactly the same length as in the previous assembly), which may explain why the updated assembly/annotation correctly resolves the two genes separately.
This genome and annotation update adds extra empirical evidence supporting our hypothesis that erroneous tandem-domain protein structures can easily stem from assembly/annotation artifacts (particularly when non-coding inter-gene regions are poorly resolved) and that assessing the quality of assemblies, annotations, and gene sequences is essential to trust the structures inferred by structure prediction algorithms.
Be the first to comment on this publication.