Purpose
Many of the most widely used drugs on the market are derived from natural sources, but systematically discovering therapeutically active small molecules from natural products is challenging. The key challenge is collecting enough consistent biomaterial for chemical analysis, multiple rounds of in vivo testing, and structural identification for manufacturing — all critical components for a drug to reach market. Accelerating natural product discovery requires techniques that can guide decision-making by identifying chemical properties of bioactive small molecules and reducing experimental variability, all with limited material.
We propose that Raman spectroscopy could address key aspects of these challenges by providing rapid chemical fingerprints from small sample volumes. We do this by (1) tracking bioactive compounds through successive rounds of fractionation to accelerate molecule identification and (2) applying machine learning to identify common features of therapeutic molecules and diagnose sources of batch-to-batch variability.
We demonstrate initial feasibility by collecting spectra from whole tick lipophilic extract and a therapeutically active fraction. The goal was to identify small molecules in ticks with anti-itch therapeutic properties. We're no longer pursuing the therapeutic indication that prompted this work, so we can't fully validate these ideas experimentally. Nevertheless, the concepts and approach may be a useful starting point for others working on naturally derived pharmaceuticals in general, and small molecules in particular.
We’ve put this effort on ice! 🧊
#StrategicMisalignment #TechnicalGap
We have wrapped up the therapeutic program that prompted this project (see details here). The difficulties we encountered in obtaining high-quality spectra from therapeutic fractions prevented us from deploying this solution as quickly as we would have liked.
Learn more about the Icebox and the different reasons we ice projects.
Motivation
Drug discovery using natural products (NPs) is a practice that dates back to antiquity. Traditional medicines involving herbs, roots, extracts, and stews weren't always effective, but they paved the way for modern medicine by offering the first plausible remedies for many illnesses. Centuries later, many folk remedies have been validated and turned into potent drugs, including some of the most widely consumed like aspirin 1–2.
The idea of using NPs as starting points for drugs still makes sense today. Because NPs evolved within living organisms for specific functions, they pass an evolutionary bioactivity screen, whereby an NP produced by an organism is typically safe for that organism and effective for the specific function it serves. Because NPs are already enriched for bioactivity, they are potentially a more attractive starting point than a naive small-molecule library that has not passed a similar filter. There are many examples of NP-derived drugs on the market, such as tetracyclines (antibiotics derived from soil bacteria 3), Taxol (chemotherapy drug originally derived from the Pacific yew 4), and famously, statins (ubiquitous cholesterol-lowering drugs originally isolated from fungi 5). Today, both large pharma companies and biotech startups are seeking to capitalize on the NP opportunity.
One of the main challenges in NP-based drug discovery is isolating the therapeutic portion of the NP and determining its chemical structure so it can be manufactured at scale. Typically, this process begins by extracting organic material from an organism and separating it into distinct subsets, or fractions, often using liquid chromatography (LC). Each fraction is then tested for biological activity, and the active fraction is carried forward and separated again. This iterative process, known as fractionation, is repeated over multiple rounds until a pure therapeutically active compound is isolated. While conceptually straightforward, every step of this process presents challenges that make it laborious and error-prone:
- Organic material extraction: organisms with even slight variations in taxonomy or habitat may contain NPs with varying degrees of activity. Even material collected from the same organisms at different times of year can vary in function, making it difficult to obtain reproducible starting material for follow-up fractionation.
- Bioactivity assay: a reliable, predictive assay is crucial to success; however, highly informative assays (e.g., in vivo phenotypic assays in mammals) are typically time-consuming, expensive, and prone to noise. In vitro assays are only feasible when the disease mechanism of action is well-characterized, and the results may not translate to in vivo application.
- Compound isolation: isolating the therapeutic fraction usually requires multiple rounds of fractionation. Collecting enough organic material can be challenging, especially if the source material is scarce or difficult to obtain (see #1). Detection is also a challenge — many small molecules, particularly lipids and other compounds lacking chromophores, are difficult to track reliably with standard UV-based LC detectors.
We recently stopped our effort to discover antipruritic NPs in ticks due to the challenges above 6. In the final stage of that effort, we realized that Raman spectroscopy (RS) could be a valuable tool for similar bioprospecting efforts, helping to mitigate the challenges of NP discovery and increasing the likelihood of success for future projects.
The ideas
Raman spectroscopy is a label-free technique for identifying chemical bonds. As an analytical technique in the life sciences, it's less used than mass spectrometry (MS) or nuclear magnetic resonance (NMR), but it's growing in popularity in biology for label-free phenotyping 7, disease diagnostics 8–9, quality control 10, and other applications. Compared to MS and NMR, Raman instruments can be significantly cheaper ($20k vs. > $200k), require minimal sample preparation, and can be deployed in-line, eliminating the need to send samples to a core facility and reducing turnaround time from days to minutes. RS also requires far less starting material per measurement, which is critical when working with scarce NPs that are being further fractionated. RS alone can't determine unknown molecular structures de novo, so it isn't a replacement for MS or NMR. Instead, it complements them by providing rapid, low-cost chemical fingerprints that are particularly valuable for iterative fractionation workflows.
We propose to use RS to address some of the challenges associated with fractionation-based small-molecule NP discovery. We'll first present two ideas for how RS can overcome some of the challenges above, then present our preliminary results from applying the molecular identification workflow to NP discovery in ticks.
Idea 1: LC-RS for compound identification
Our first idea is to couple RS to liquid chromatography (LC)-based fractionation 11–12, which is traditionally used in small-molecule NP drug discovery. The goal is to narrow down the active fraction to a minimal set of active molecules, with RS simplifying the process by providing fast, actionable information about each fraction. We envision the process working as follows (Figure 1):
- Process the natural product (entire organisms, tissues, cells, or extracts) into a liquid using one of many techniques (typically, solvent extraction 2) and fractionate using LC.
- Collect Raman spectra from all fractions.
- Independently, perform the gold-standard assay to determine the activity of each fraction (e.g., in vivo) and identify the therapeutically effective fraction(s).
- Fractionate the active fraction(s).
- Repeat steps 2–4 until a single compound (or small group of highly similar compounds) remains in the fraction.
- Analyze the Raman spectra to find spectral features consistently present in the therapeutically active fractions.
- Use the information from step 6, possibly in tandem with traditional MS or NMR analysis to identify the active molecules.
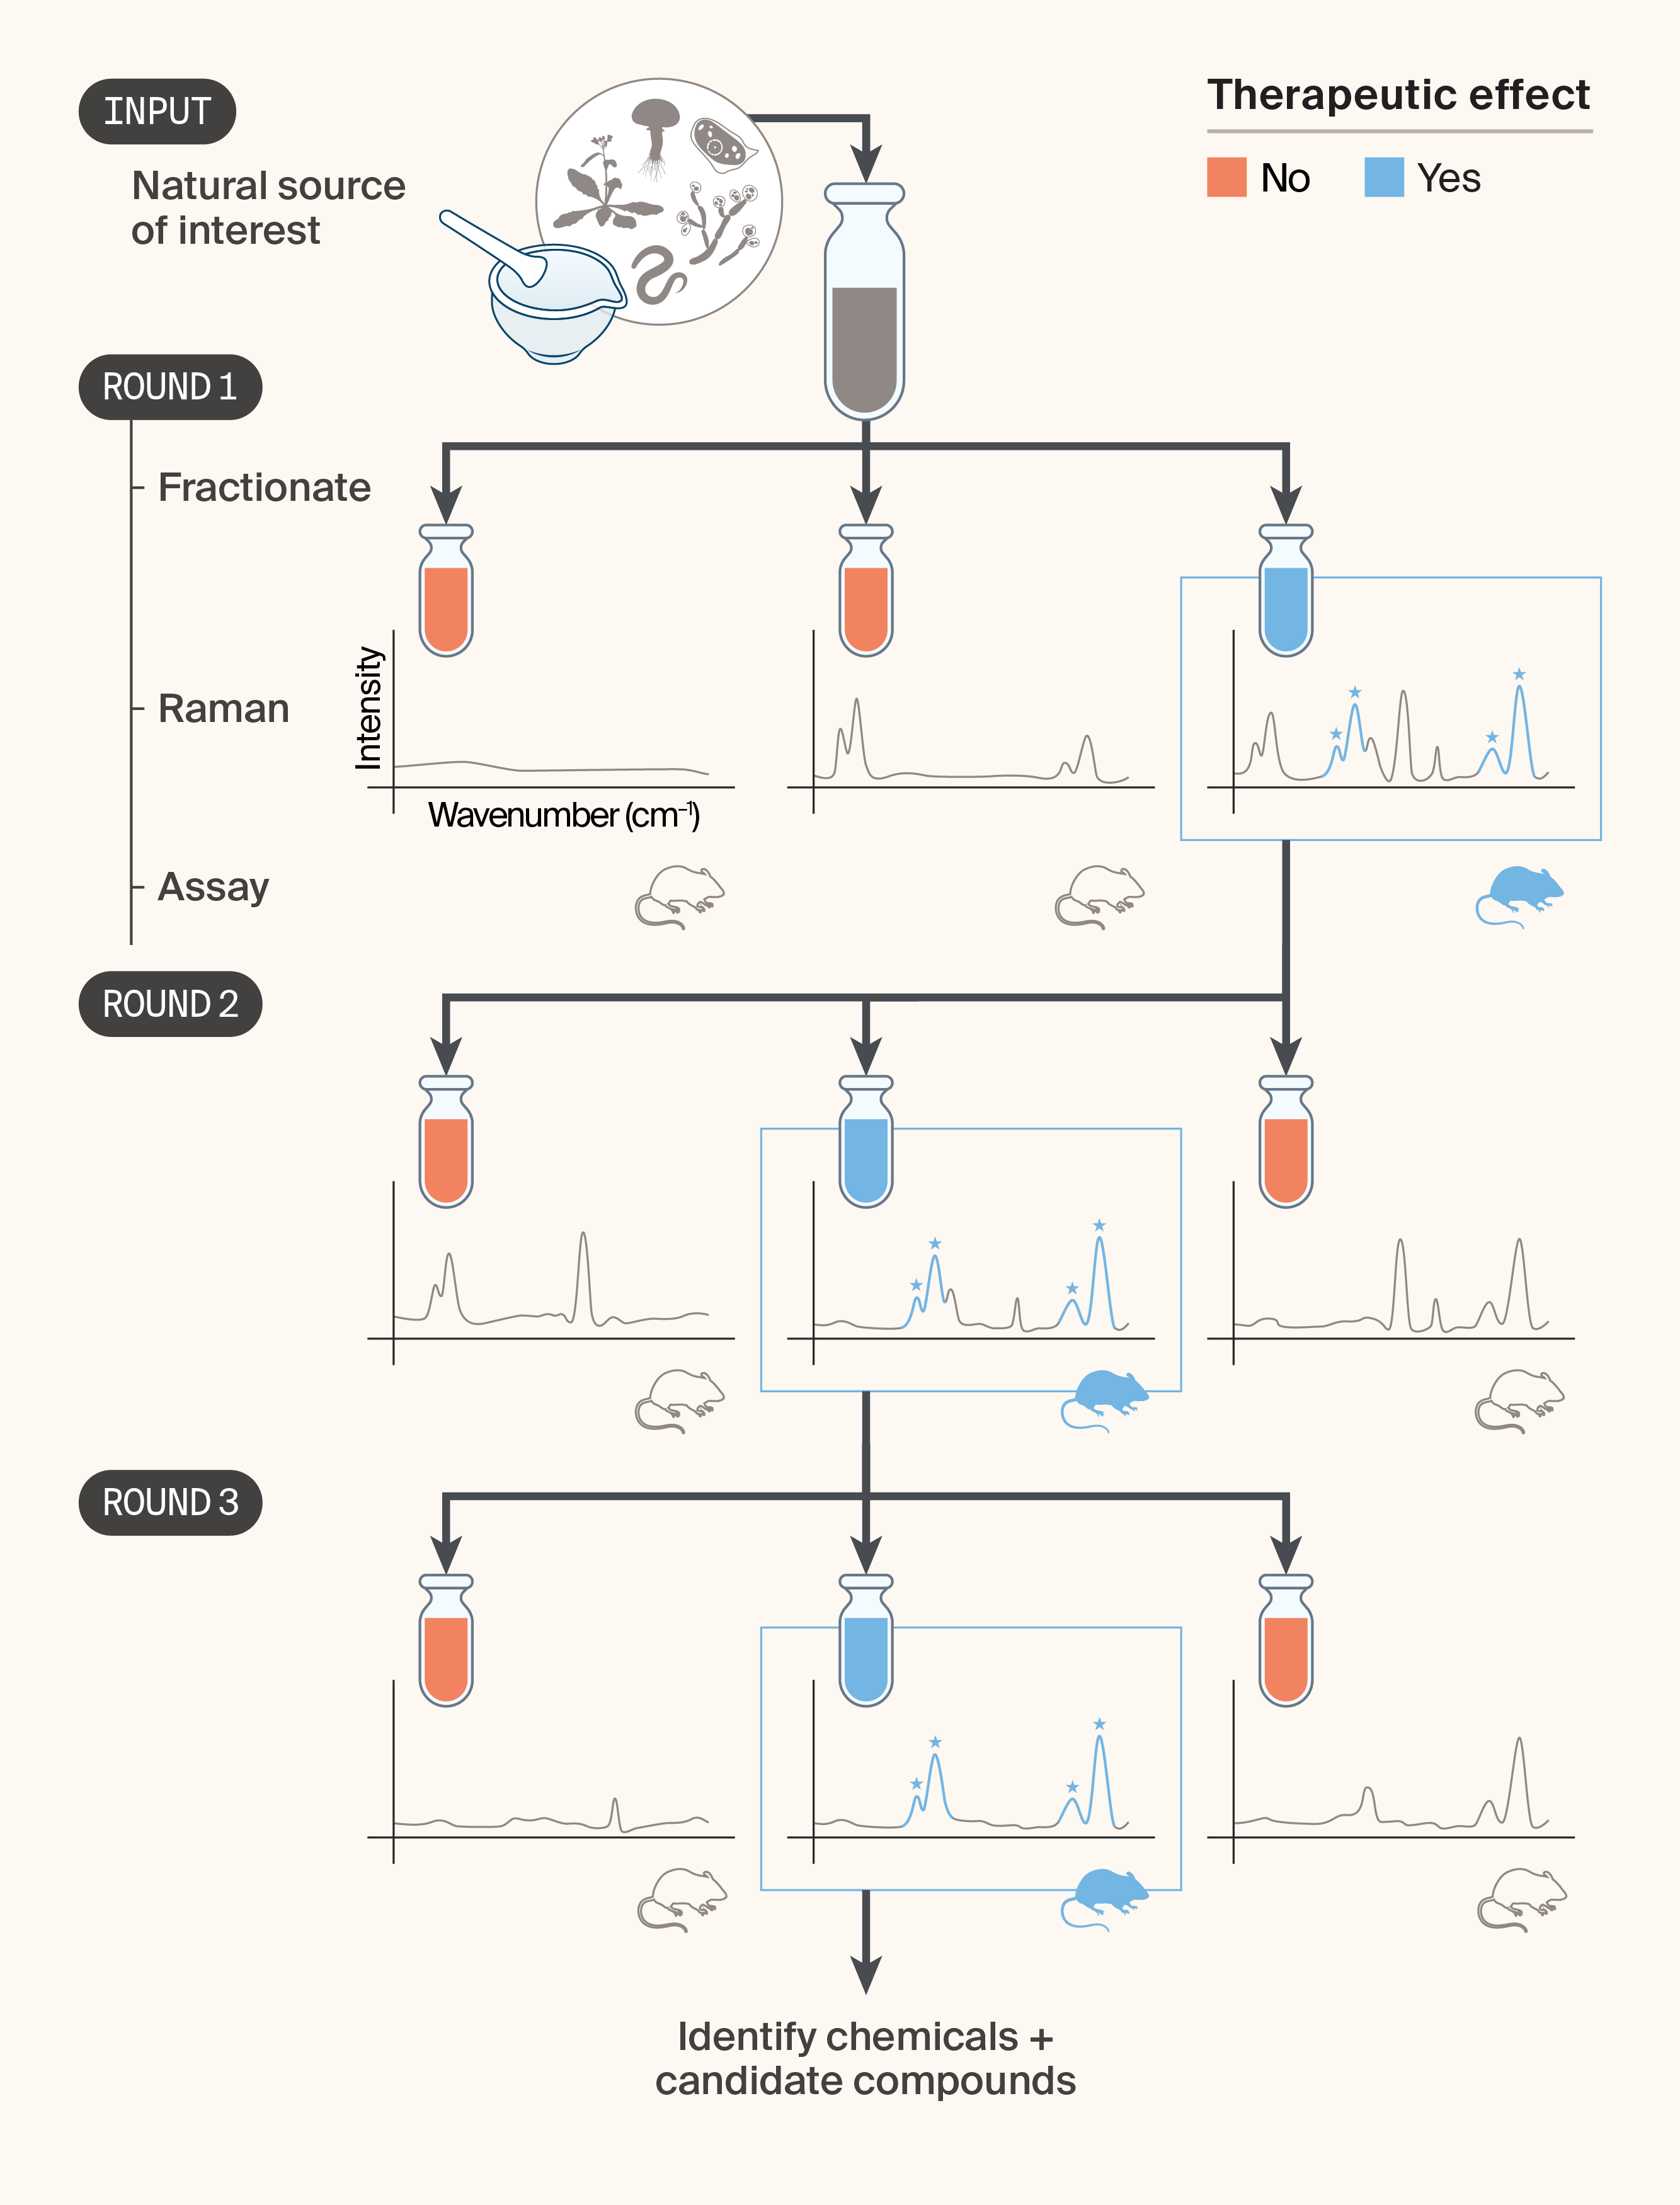
Figure 1. Iterative natural product fractionation using Raman spectroscopy to identify candidate therapeutic compounds from natural sources.
In this concept, a complex extract from a natural source of interest (e.g., plants, fungi, marine organisms) is fractionated by LC and the resulting fractions are characterized by Raman spectroscopy and evaluated in an in vivo bioassay. In each round, the fraction showing a therapeutic effect (blue) is carried forward and subfractionated. Starred peaks in the Raman spectra denote signals enriched in the active fraction and serve as markers to track candidate compounds across rounds. After three rounds of fractionation and bioassay testing, the active subfraction is sufficiently purified for chemical identification and nomination of candidate compounds. Note: Raman spectra are schematic and not derived from experimental data.
Idea 2: Reducing experimental complexity
The workflow in Figure 1 is highly idealized; in reality, natural product drug discovery and compound isolation can be a months- to years-long effort, replete with challenges such as batch-to-batch variability in the NP, assay variability, and inconclusive results.
Our second idea is to use RS to quickly and inexpensively reduce the complexity of the real-world experimental effort. We present two hypothetical cases. In the first, multiple NP fractions produce the therapeutic effect, as measured using a slow and/or costly secondary assay (Figure 2, A). To identify common chemical features of the effective fractions, one could perform RS on all fractions and reduce the spectral dimensionality in a supervised manner — e.g., using linear discriminant analysis (LDA). The feature importance or loading vector of the analysis should reveal peaks common to the therapeutic fractions, which could be informative for downstream analysis. One important assumption is that the biological mechanism underlying the therapeutic effect is identical across all fractions.
Another ubiquitous experimental challenge is batch-to-batch variability. In the context of NP drug discovery, this could manifest as batches of NP-derived fractions producing inconsistent therapeutic results. The approach we propose is to collect Raman spectra from all fractions and perform unsupervised dimensionality reduction (e.g., principal component analysis (PCA)) to determine the likely source of the variability (Figure 2, B). There are three informative outcomes:
- The same fractions from different batches cluster together in low-dimensional space: This would be expected if there were no chemical difference between the batches, and would suggest a problem with the assay used to determine the therapeutic effect.
- The two batches are well-separated in low-dimensional space: This is indicative of a global batch effect where the overall chemical composition of the NP differs between batches. This could be caused by natural variation in the starting material as a function of collection methodology, physical location, or organism state.
- The inactive fractions cluster separately from the active fractions from both batches: This suggests sample contamination and likely rules out an overall batch effect.
Of course, a fourth possible outcome is that the fractions from the two batches are intermixed in the low-dimensional space. This suggests either multiple sources of variability, insufficient sampling density, or the presence of a non-Raman-detectable contaminant.
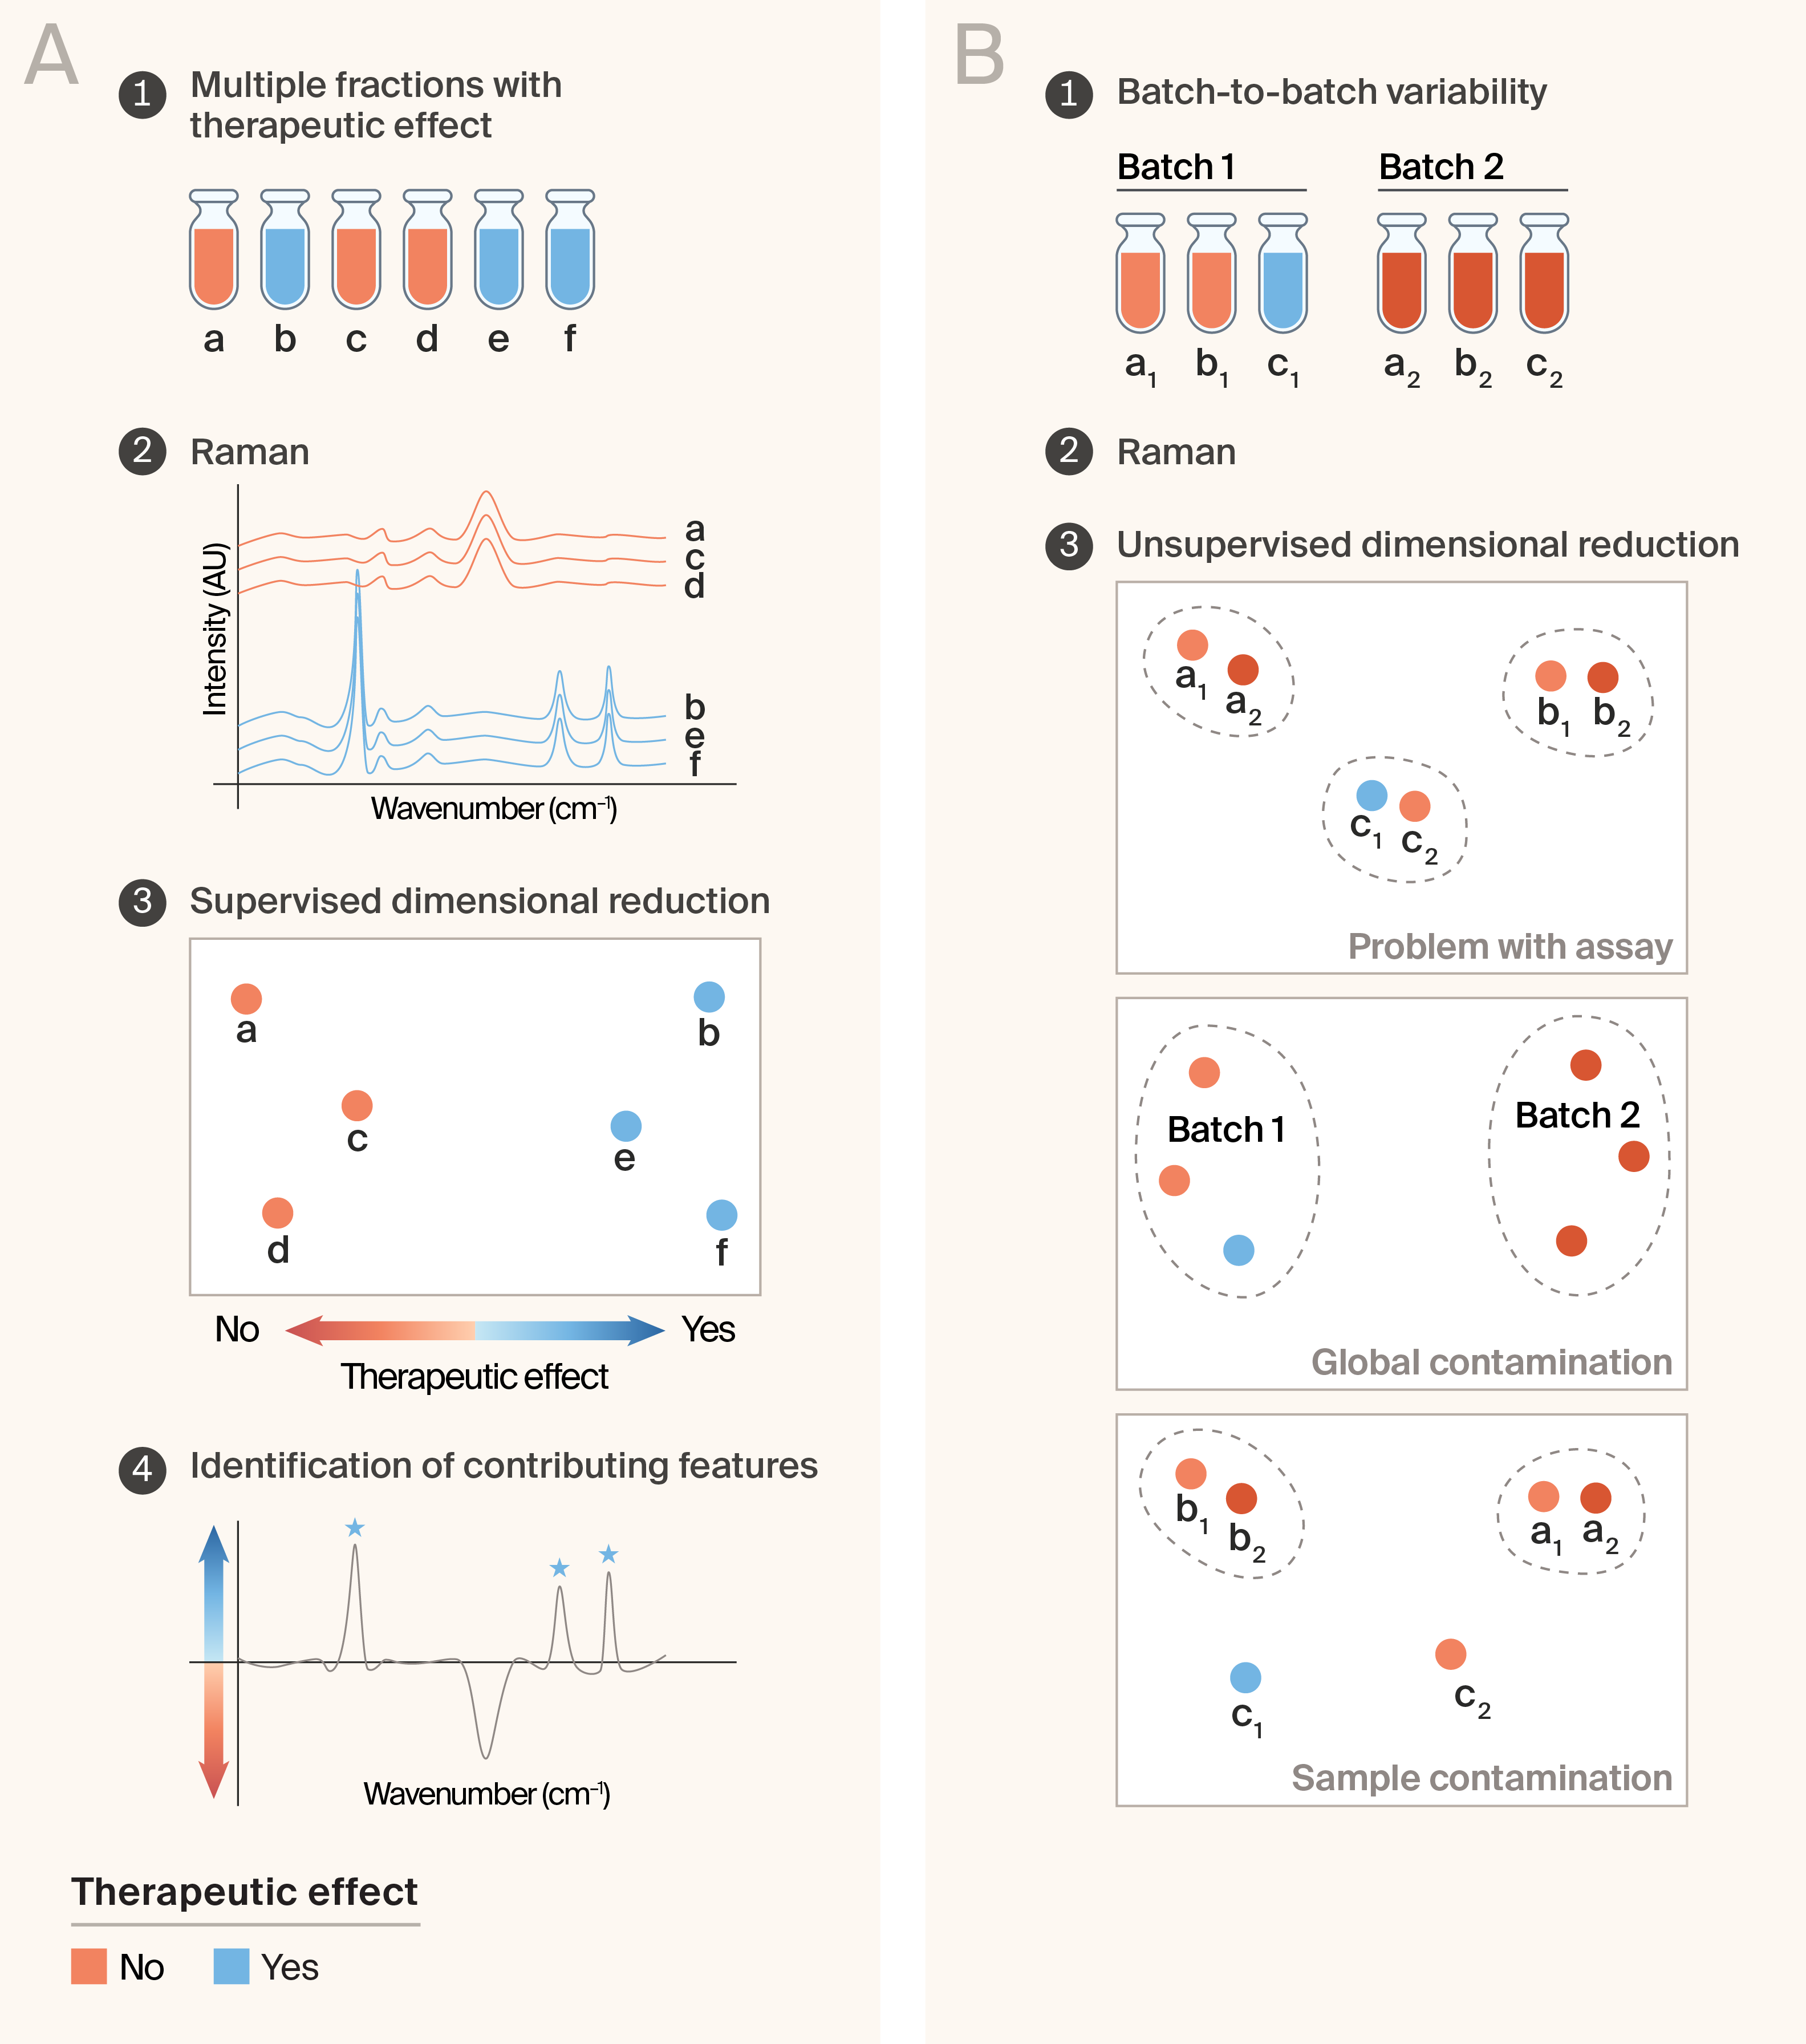
Figure 2. Tracking experimental complexity.
(A) When multiple fractions show therapeutic activity, Raman spectra of active (blue) and inactive (orange) fractions can be compared using supervised dimensionality reduction to separate fractions by therapeutic effect and identify the spectral features that contribute most to activity.
(B) When different batches of natural material give conflicting assay results, unsupervised dimensionality reduction of Raman spectra can distinguish between possible sources of variability: a problem with the assay (fractions cluster by fraction identity across batches), global contamination (fractions cluster by batch), or sample contamination (a subset of fractions from one batch behaves anomalously).
Preliminary work to test these ideas and where we stopped
We wanted to see if LC-RS could help us identify small molecules with itch-reducing properties present in tick extract. We started this effort to support the experimental pipeline of Trove, our pharmaceutical spin-out company. While the bulk of our ideas still need to be de-risked, we're sharing our initial data here in case it's useful to others.
The motivation, experimental methods, and results of Trove’s efforts are documented in our previous pub 6. Briefly, we were looking at extracts from human-biting ticks to find small molecules that could reduce pathological itch. To do this, we fractionated organic material from dried whole ticks and performed RS alongside our mouse itch assay to see if RS can shed light on the molecules that drive the anti-itch effect we observed in vivo. We successfully obtained Raman spectra of the whole tick extract using standard RS. However, standard RS wasn't sensitive enough for the subfractions, so we used a related technique, surface-enhanced Raman spectroscopy (SERS), and successfully obtained Raman spectra. Importantly, this subfraction retained anti-itch activity in the mouse in vivo assay, confirming that the bioactive compound(s) survived the first round of fractionation.
Raman spectroscopy of whole tick extract
We first performed RS on whole tick extract. We lyophilized the organic matter, resuspended it in acetonitrile, and blotted 20 μL of the material onto a mirror-polished stainless steel plate. We then acquired spectra from three positions in the blot and from a procedural blank using a probe-based Raman spectrometer with a 785 nm excitation source (WP-785X-F13-R-ILC, Wasatch Photonics). Procedural blanks were produced by performing the end-to-end extraction and fractionation without tick homogenate. The acquisition parameters were:
- Excitation power: 245 mW (measured at the sample)
- Acquisition time: 10 s
- Averaging: 3
We processed the spectra as follows using RamanSpy (v0.2.10) 13:
- Dark spectrum subtraction: We subtracted the dark (no-laser) signal from all spectra
- Cropping: We cropped the spectra to 700–1,800 cm−1
- Cosmic ray removal: We used the Whitaker–Hayes algorithm with default parameters 14.
- Smoothing: We applied the Savitzky–Golay filter (window length: 5, polyorder: 3) to de-noise the spectra 15–16.
- Baseline subtraction: We fit a 5th-order polynomial to the cropped spectrum and subtracted it to remove fluorescence artifacts.
The acquired spectra exhibited features consistent with a lipid profile, as expected from the extraction technique (Figure 3, round 1). The observed peaks are summarized in Table 1. These assignments are based on published reference spectra for common lipids 17 and should be considered tentative. Together, these peak assignments suggest that the material contains esterified, long-chain lipids with at least some unsaturation.
| Wavenumber (cm−1) | Vibrational mode | Tentative assignment |
|---|---|---|
| 972 | =C–H out-of-plane wag | Associated with alkene groups; supports presence of unsaturated lipid chains |
| 1,080 | C–C skeletal stretch / C–O stretch | Indicates conformational disorder in alkyl chains; may include contributions from lipid headgroups |
| 1,119 | C–C skeletal stretch (all-trans) | Characteristic of ordered, extended hydrocarbon chains in lipids |
| 1,267 | =C–H in-plane bend | Marker of cis double bonds in unsaturated fatty acyl chains |
| 1,303 | CH2 twist / wag | Reflects methylene chain conformation and packing order |
| 1,441 | CH2 scissor (bend) | Common lipid band from long alkyl chains; correlates with total lipid content |
| 1,656 | C=C stretch | cis double bonds in unsaturated lipids |
| 1,745 | C=O stretch (ester) | Diagnostic of esterified lipids (e.g., triacylglycerols, phospholipids) |
| 2,854 | CH₂ symmetric stretch | Long saturated hydrocarbon chains |
| 2,899 | CH₂ asymmetric stretch | Reflects alkyl chain length and packing in lipid acyl chains |
| 3,011 | =C–H stretch | Olefinic C–H stretch; confirms unsaturated lipid components |
Table 1. Characteristic Raman bands of the whole tick lipophilic extract with putative assignments.
All tentative assignments are from Šimáková et al. 17
Surface-enhanced Raman spectroscopy of fractionated samples
We next sought to acquire spectra from the first round of fractionation. We focused on a subfraction shown to be therapeutically active in the mouse in vivo assay.
Unfortunately, we did not observe any Raman peaks distinct from the procedural blank with either 785 nm excitation or 532 nm excitation, likely because the concentration of any individual compound in a fraction is far lower than in the crude extract and below the detection limit of our instrument.
We therefore turned to SERS to increase the sensitivity of the measurement. SERS works by enhancing light scattered by molecules adsorbed onto a metallic surface 18–19 and has previously been used for analyzing lipids 17, 20. We used commercially available SERS substrates consisting of ITO (indium tin oxide) glass coated with gold and silver nanoparticles (SS01110672SER, Amerigo Scientific). We incubated the substrates in either the sample or procedural blank for 3 h at room temperature, dried them in ambient air for approximately 10 min, and performed RS measurements. Using the 785 nm instrument, the acquired Raman signal was dominated by fluorescence from the glass substrate. We therefore used the 532 nm system (WP-532X-F13-R-IC, Wasatch Photonics) with the following parameters:
- Excitation power: 34 mW (measured at the sample)
- Acquisition time: 20 s
- Averaging: 4
We processed the SERS spectra in the same way as the Raman spectra above. The spectra exhibited broad autofluorescence but did show distinct Raman peaks, distinct from the blank (Figure 3, round 2). Notably, both the sample and the blank exhibited broad peaks in the 1,200–1,600 cm−1 region stemming from the glass substrate of the SERS material. The clearest signs of lipid-like molecules remaining in the fraction are the strong peaks in the CH stretch region: 2,880 cm−1, 2,913 cm−1, and 2,940 cm−1, likely arising from CH2 and CH3 symmetric and asymmetric stretch modes 21. Exact assignments in the fingerprint are difficult due to the complex interaction between the molecules and the substrate, and the contaminating fluorescence signal.
Code and raw data are available on our GitHub (DOI: 10.5281/zenodo.20451259).
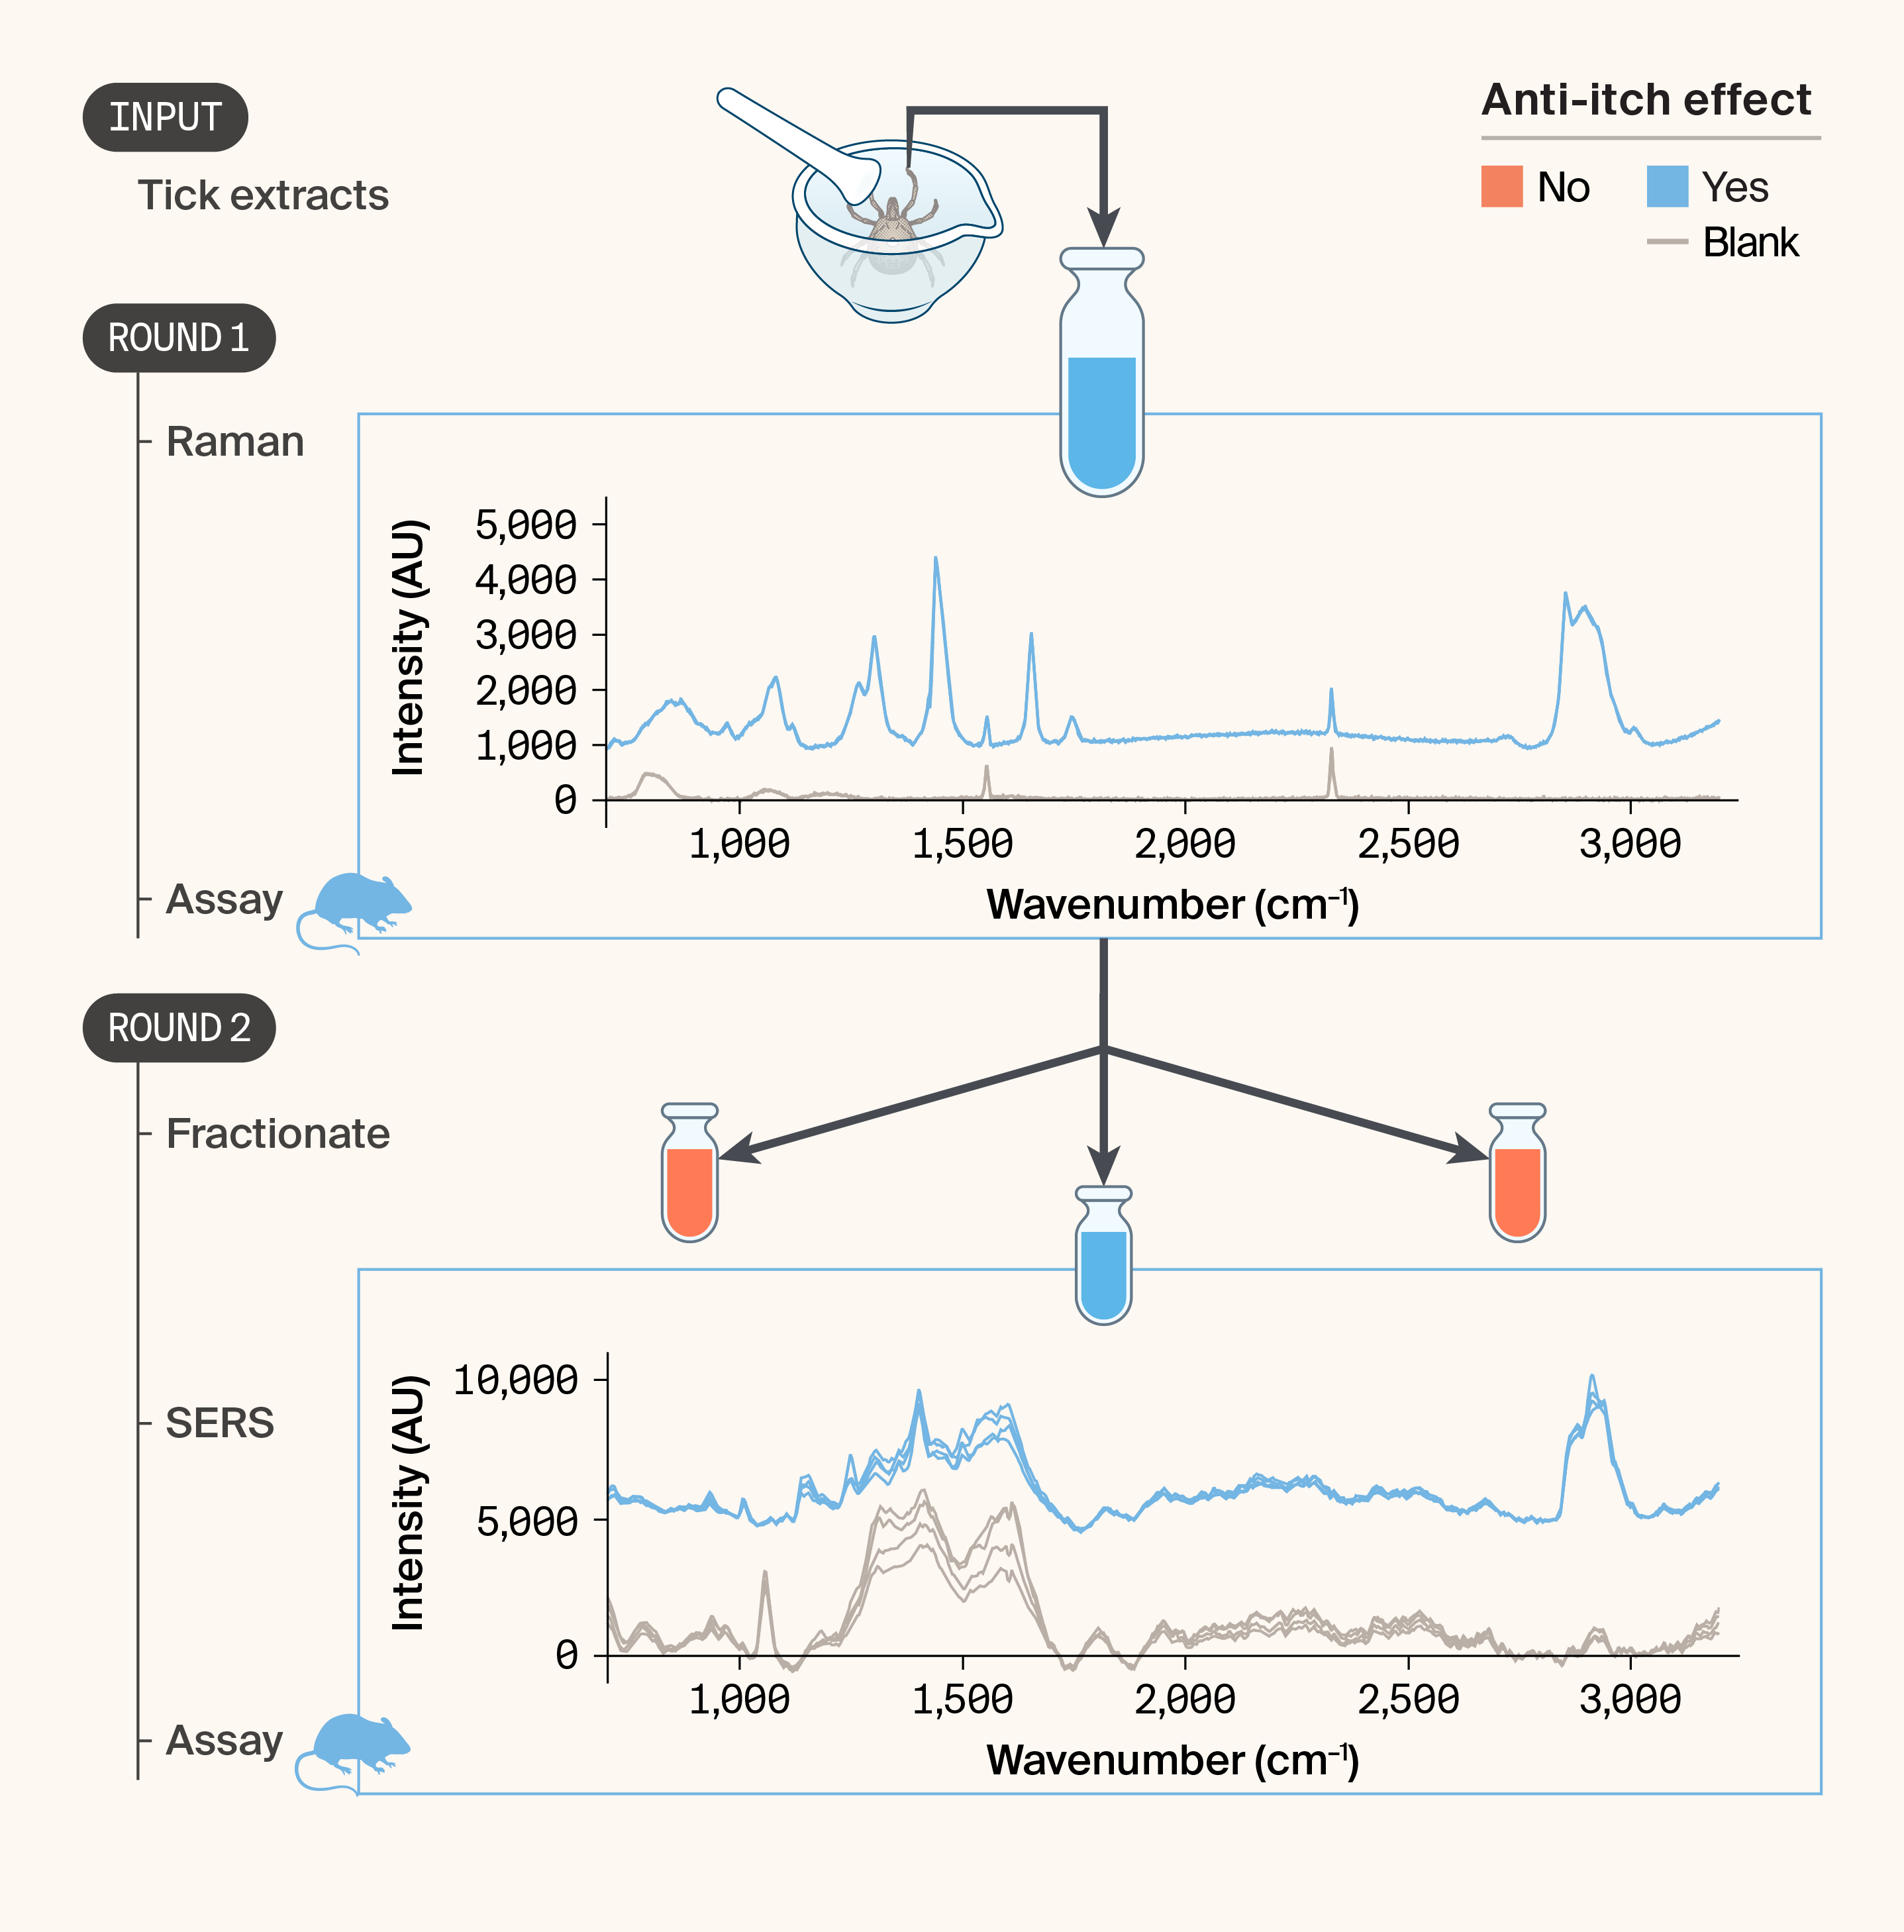
Figure 3. Applying liquid chromatography–Raman spectroscopy (LC-RS) to anti-itch natural product discovery using tick extracts.
We extracted organic lipophilic material from frozen whole ticks and characterized it by Raman spectroscopy in parallel with a mouse itch assay. In round 1, standard Raman spectroscopy of the crude extract (blue) revealed a rich spectral profile compared to a solvent blank (gray), and the extract showed anti-itch activity. In round 2, we subfractionated the active extract; SERS of the active subfraction revealed a distinct spectral signature relative to the blank, and the fraction retained anti-itch activity. In both rounds, n = 3 spectra were acquired from the sample and blank.
Discontinuing experiments
At this point, we decided to stop experiments because the spectra from the fractionated sample were no longer directly comparable to those from the whole extract, owing to major methodological differences between the two rounds. Reacquiring the whole extract using SERS wasn't possible given our time and sample volume constraints. Also, the motivating project, Trove, was winding down.
Recommended next steps
While we're no longer doing this work, we think it may be valuable for others to follow up on these ideas. We outline the key challenges and next steps to de-risk them below.
Technical challenges
We encountered several experimental challenges in our Raman and SERS study of lipophilic tick extracts (Table 2). Most of these challenges are likely to occur in other biological preparations.
| Challenge | Possible next steps |
|---|---|
| The SERS spectrum of the fractionated sample wasn't directly comparable to the Raman spectrum of the whole extract, making it difficult to track common features through fractionation. | Reacquire all samples using the same SERS substrates, excitation wavelength, and acquisition parameters to enable direct comparison. |
| Background contamination (broad fluorescence and peaks) from the SERS substrate reduces confidence in peak identification in the sample. | The majority of the background signal likely comes from the glass substrate. A confocal microscope may reduce the contribution from the glass. Another excitation wavelength may excite the glass less. |
| It's difficult to assign exact vibrational modes to fractionated SERS results. | Because of the well-documented variability in signal from SERS substrates 18, the best approach is to run SERS on a panel of well-characterized lipids to increase confidence in peak assignment of an unknown substance. |
| SERS substrates are expensive and generally single-use. | It may be possible to multiplex samples by dispensing very small (≤ 1 μL) volumes and collecting Raman spectra using a high-magnification objective. |
Table 2. Challenges we faced in using Raman for natural product discovery and ideas to overcome them.
De-risking the proposed ideas
We propose experiments to address the riskiest components of both ideas.
De-risking idea 1: Can Raman detect therapeutically active compounds in a complex solution matrix?
The first-pass experiment should test whether RS or SERS can identify a known spiked-in compound in a complex solution resembling a natural product extract. Depending on the exact goals, one can choose either an actual therapeutic compound of interest or a proxy and spike it into an actual biological matrix or a representative one (e.g., cell culture media). Fractionate the spiked solution using time-based LC, collect all fractions, and determine the limit of detection (LOD) of the spiked-in compound and whether it survives multiple fractionations. Exact pass/fail criteria for this experiment depend greatly on the exact NP and the range of therapeutically active concentrations, but generally, the aim is for the spiked-in compound to be detectable after multiple rounds of fractionation.
De-risking idea 2: Can Raman detect subtle batch differences?
In a similar vein, the first experiment to test whether Raman can detect batch effects should be to spike in known compounds at low concentrations into complex matrices and determine the minimum concentration difference at which the batches are still separable. As before, both the spiked-in compound and the matrix in which it’s solubilized should be as similar as possible to the biology of interest to be relevant. Exact pass/fail criteria for this experiment depend on the degree of batch separation required for the application.
Key takeaways
We proposed two ways in which RS and SERS could, in principle, speed up NP drug discovery. The first idea was to track therapeutically active fractions of an NP and use that information to narrow the search for candidate active compounds. The second involved using Raman to track and mitigate experimental variability in complex assays.
Experimentally, we demonstrated that spectra can be acquired from tick extracts and a therapeutic fraction, but methodological inconsistencies across rounds prevented us from directly testing the tracking approach.
As we outline in "Recommended next steps," it's important to first address the technical challenges around collecting consistent spectra from whole extracts and fractions. The next step toward evaluating the viability of our ideas would be to design "spike-in" experiments to assess the sensitivity of the technique.
Weigh in!
This idea came directly from the lessons we learned in our multi-year effort to develop biologically inspired therapeutics 6. We believe that the techniques presented here could help address some of the challenges we encountered, but we would love to hear other viewpoints. Are there fundamental blockers to applying this approach to tracking variability in fractionation? Are there other techniques that could be used?
Figure and manuscript preparation
We used Claude (Opus 4.6) to help write, clean up, and comment our code. We also used it to suggest wording ideas, then chose which small phrases or sentence structure ideas to use; to help copy-edit draft text to match Arcadia’s style; and to help clarify and streamline text we wrote. Additionally, we provided Claude with starting text and had it rearrange that text to fit the structure of one of our pub templates.
We used arcadia-pycolor (v0.6.5) 22 to generate figures before manual adjustment.
Be the first to comment on this publication.