Purpose
We developed a workflow for automating ELISA-based protein quantification. We aimed to build a lightweight toolkit to facilitate experimental design and usage by scientists with limited liquid-handling automation experience. We created a web app for creating custom plate maps, Python scripts that automate all liquid handling, 3D printing designs for a tip waste chute that's useful for high-throughput assays, and a detailed protocol on how to implement the workflow.
These resources specifically enable the use of a Cayman His-tag detection ELISA kit with an Opentrons OT-2 liquid handler. The OT-2 is an inexpensive, open-source liquid-handling robot, already adopted by many molecular biologists 1–2.
While this toolkit should immediately help groups that already use the Cayman His-tag detection kit and have access to an OT-2 robot, we hope it'll also serve as a starting point to adapt to similar ELISA kits and experiments.
The strategy
Computational protein design is producing an ever-growing number of novel protein variants, each of which requires experimental validation 3. As part of a larger protein design effort, we're screening many His-tagged protein variants expressed across several host organisms, using ELISAs (enzyme-linked immunosorbent assays), a well-established method for semi-quantitative protein detection. This acts as a preliminary, binary readout of protein presence or absence 4.
As our screening campaigns scale from tens to hundreds of protein variants, manually preparing ELISA plates presents both a labor bottleneck and a source of experimental inconsistency between users. The 96-well plate format and repetitive pipetting steps make this assay a natural candidate for liquid handling automation.
Because our constructs share a common His tag, we can use a single His-tag detection kit across different protein targets, regardless of their identity.
The problem
The challenge with automating ELISA assays isn't programming the automation itself; it's making automation flexible enough to enable continuous development and adjustment of experimental design. Screening efforts vary in the number of samples, the controls included, and the plate layout. Each new experiment requires a different configuration. We considered dedicated automated ELISA platforms like the Dynex DS2 Elite and the Berthold Crocodile, but ultimately decided against them. These instruments are substantially more expensive and purpose-built for ELISAs alone, whereas a more general-purpose liquid handler lets us run a wide range of other molecular biology assays on the same machine.
Our solution
We turned to the OT-2, an affordable, open-source liquid-handling robot from Opentrons, because it can decrease hands-on time while maintaining reproducible pipette volumes at the microliter scale 5. A rigid automation setup that requires rewriting before every run saves little time in practice, so we explored workflows that automate user input of experimental design.
This required a way to quickly convert experimental designs into custom, Opentrons-parsable Python scripts. We built a web app to organize user experimental design input, generate experimental plate maps, and pair them with bespoke, modular Opentrons scripts.
Our automation workflow includes the following:
- ELISA plate layout generator web app
- Opentrons scripts for the Cayman His-tag detection ELISA kit
- Step-by-step protocol for implementing the workflow
- 3D-printable waste chute design files with a corresponding custom labware definition for the OT-2
These scripts target a specific ELISA kit and pipetting configuration, but you can readily adapt them to related workflows.
The resource
We're using the Cayman His-tag detection ELISA kit (Cayman Chemical, #10012445). The workflow we describe here maps to the kit's sample-loading, wash, substrate-addition, and readout steps — see the kit manual for the full assay overview and reagent list 6. This is a competitive ELISA: Sample protein and a labeled tracer compete for antibody binding sites, so the signal is inverse to the amount of free His-tagged protein.
The following sections provide a basic overview of the workflow (Figure 1) and our design rationale.
We walk through the full workflow in a dedicated protocol, "An Opentrons OT-2 workflow for the Cayman His-tag detection ELISA kit," on protocols.io.
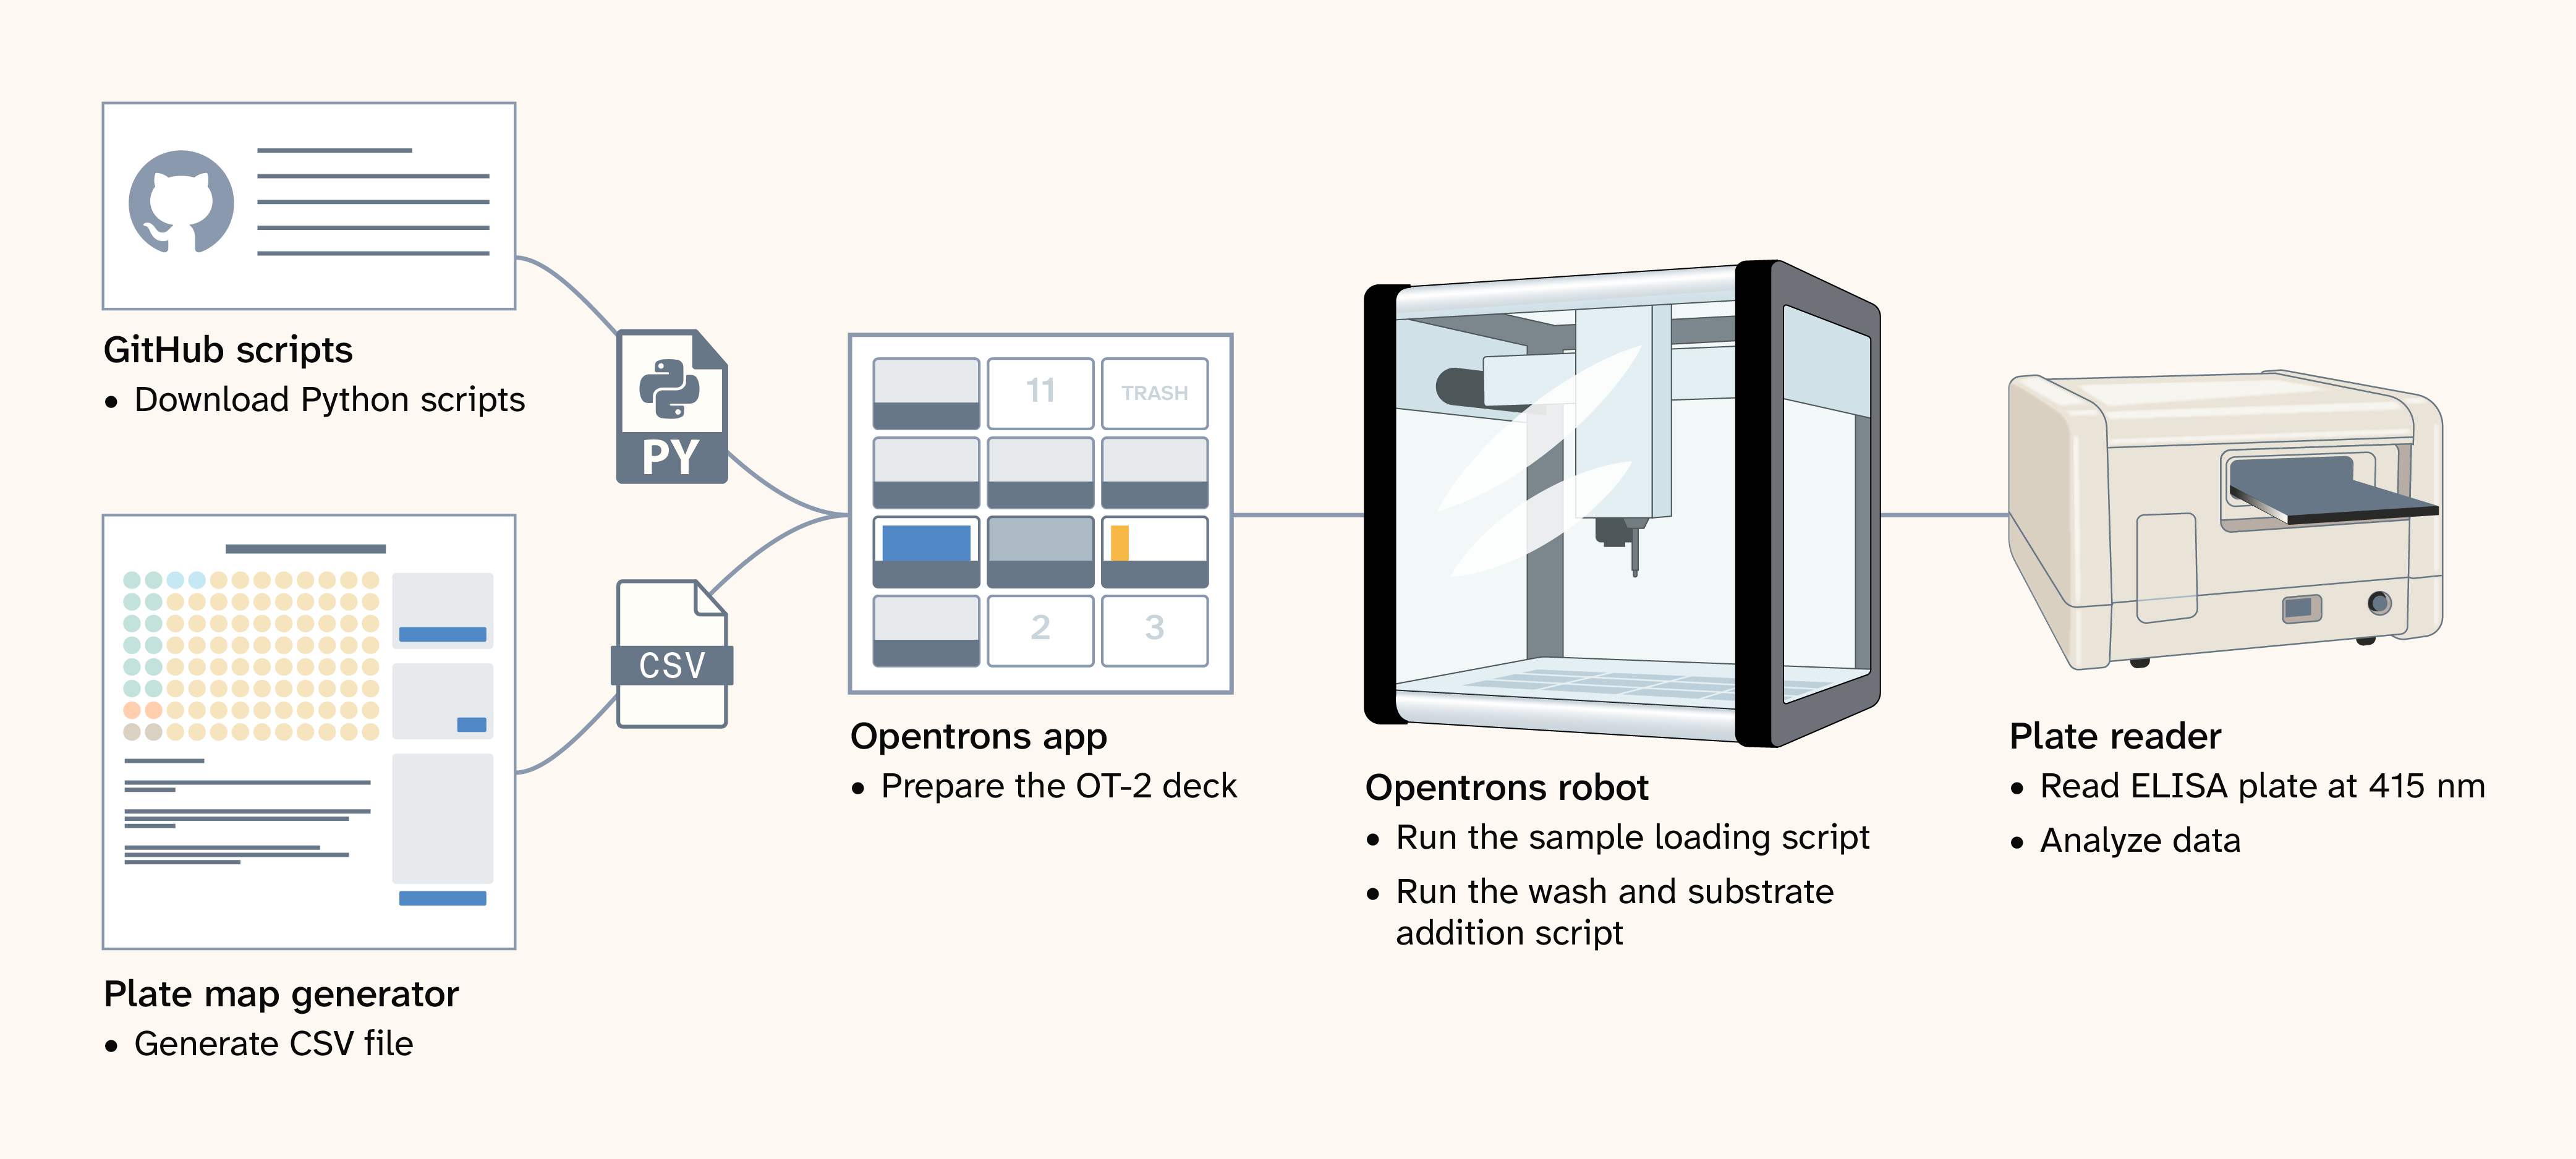
Figure 1. Automated ELISA workflow diagram.
The plate map generator
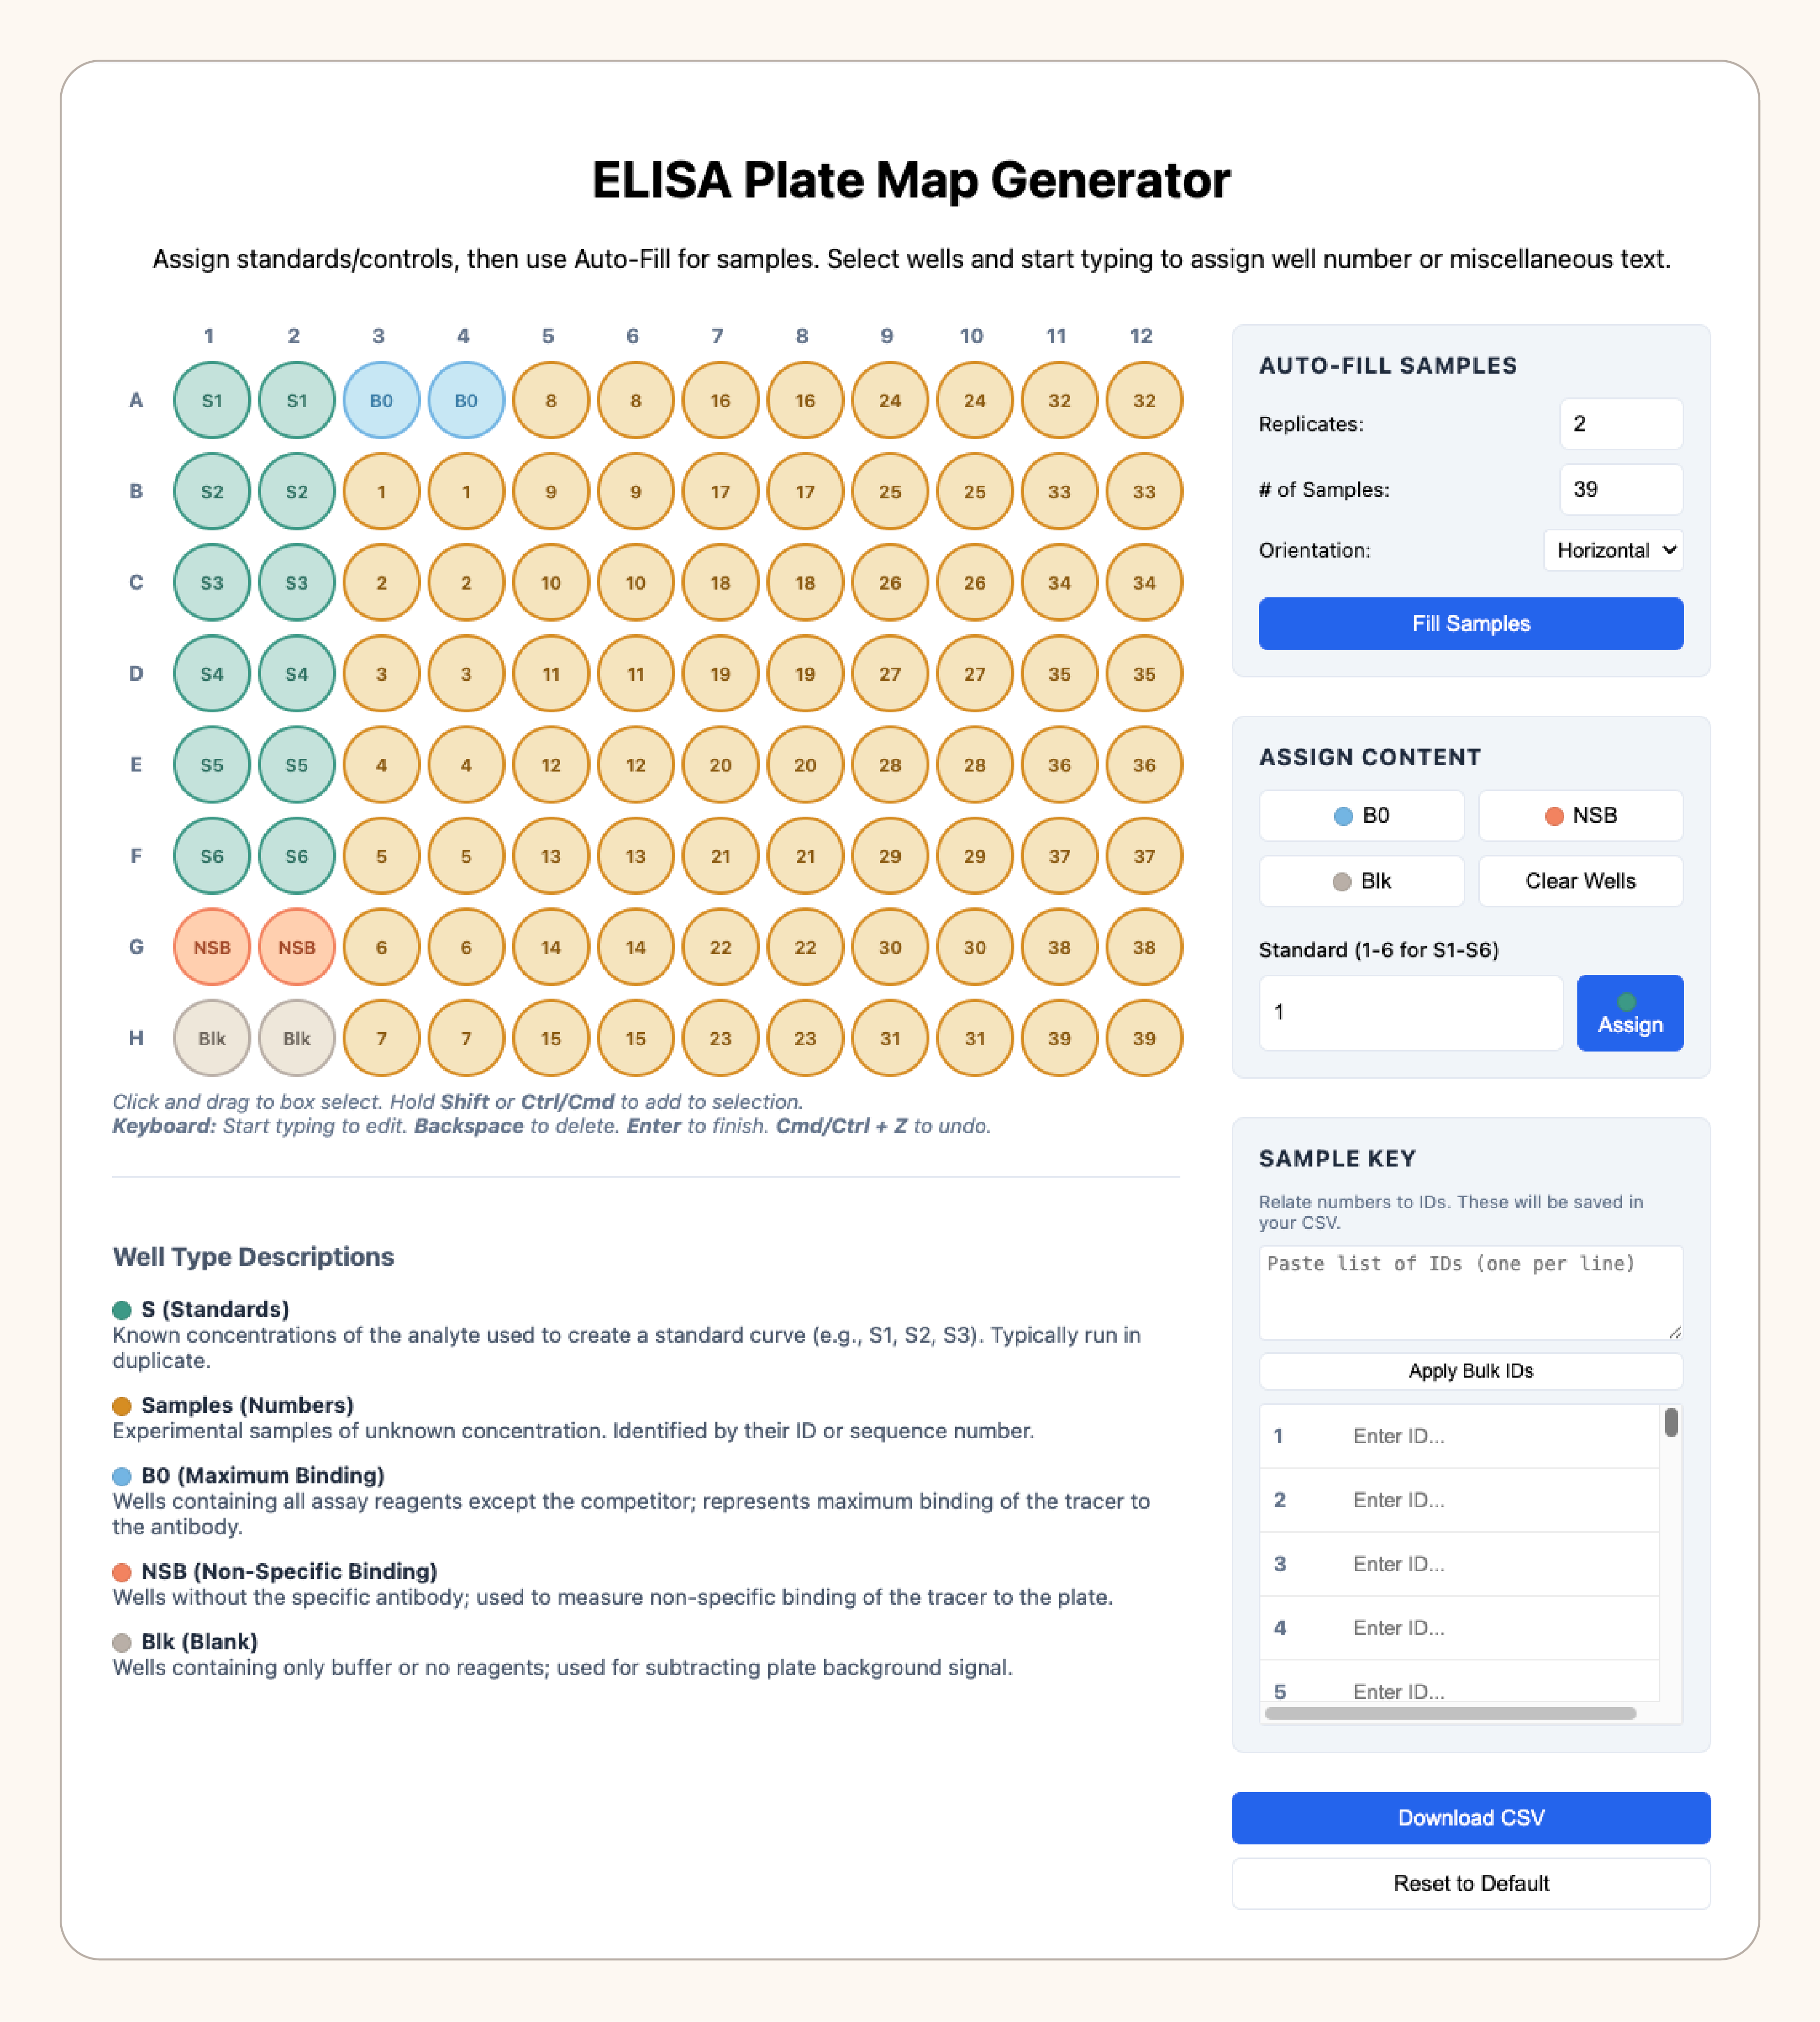
Figure 2. The ELISA plate map generator interface.
The plate map generator is an HTML file with embedded CSS for styling and JavaScript for the logic (Figure 2). You can open the file in your browser without installing any dependencies. The plate map generator creates a standardized CSV file that specifies where the OT-2 should dispense standards, samples, and controls. It has a number of useful features including:
- Auto-fill samples: Lets you select the number of samples and replicates, along with replicate orientation, to automatically populate the plate map
- Assign content: Allows you to manually assign wells by selecting a position and type/select a standard assignment (S1–S6), sample number, or control (, non-specific binding, blank)
- Sample key: Gives you the ability to input a list of sample IDs so you can map names to sample numbers
The Opentrons workflow
Code, including the plate map generator and all Opentrons scripts, is available in this GitHub repo (DOI: 10.5281/zenodo.20633834).
Reagent preparation
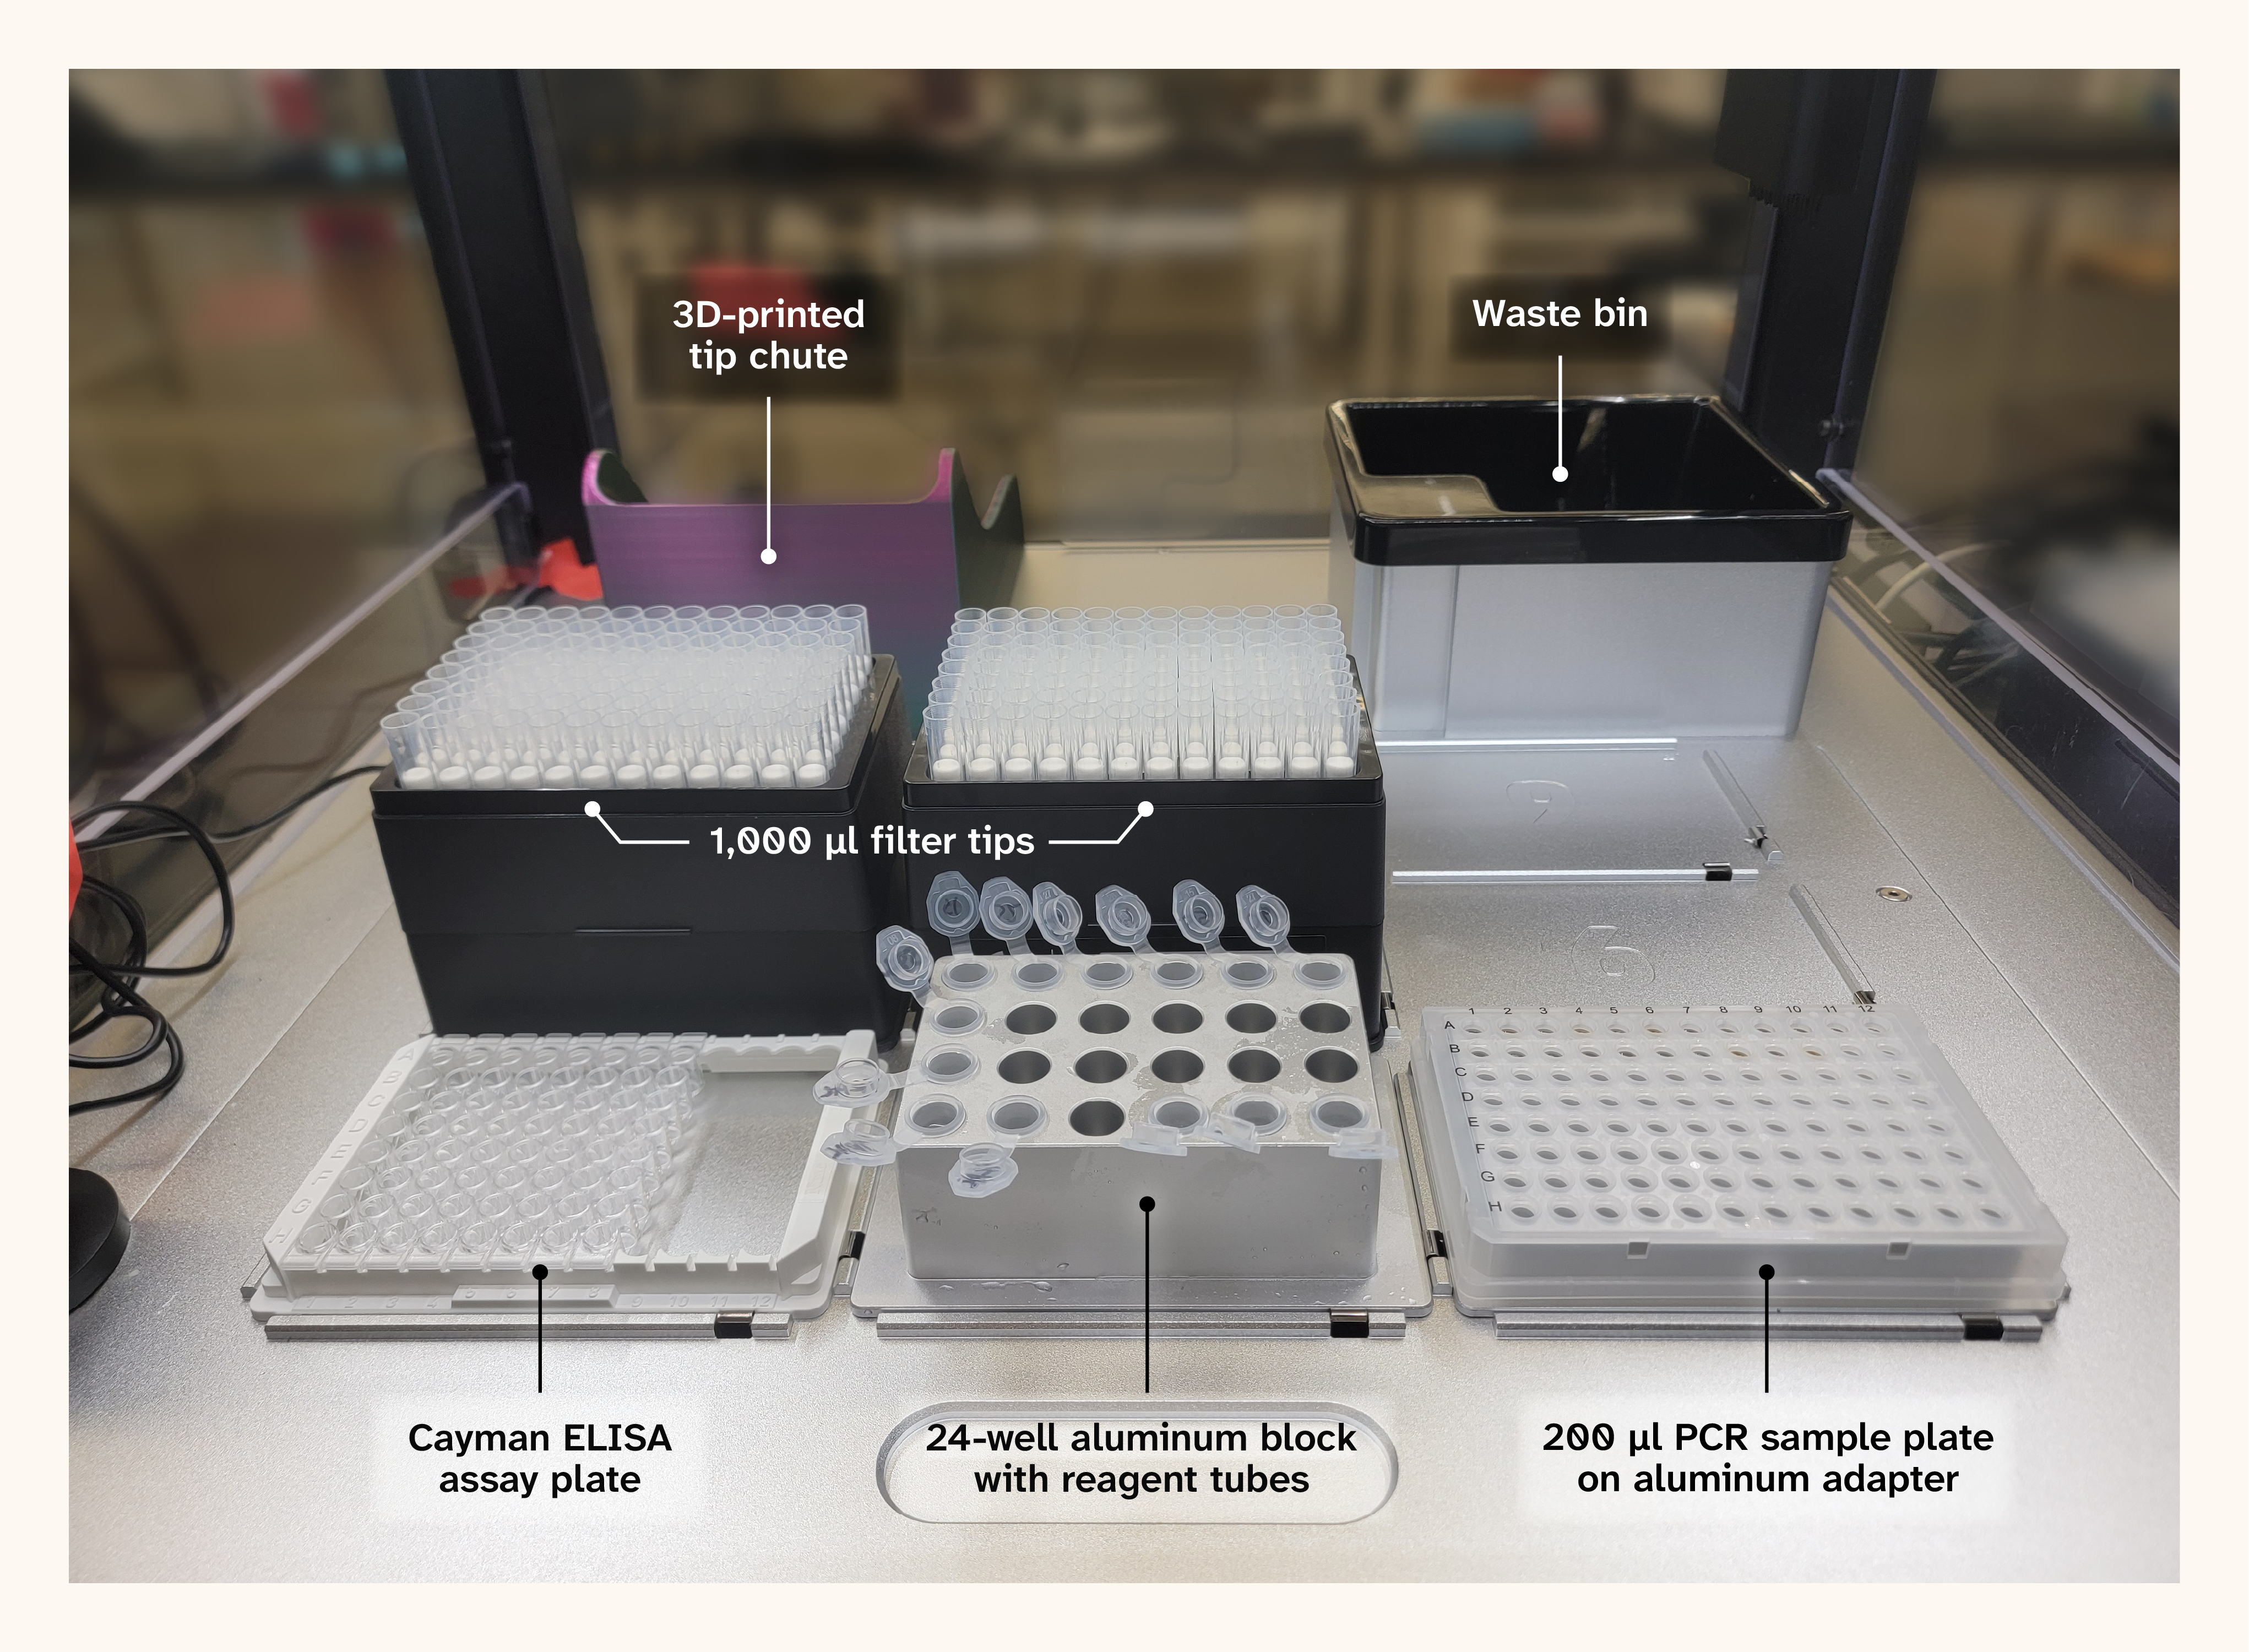
Figure 3. The OT-2 deck layout for the sample-loading protocol.
The Opentrons sample-loading script performs the initial addition of reagents into the pre-coated goat anti-mouse IgG plate using the layout depicted in Figure 3. It is designed to flexibly adapt how many His–AP tracer and His ELISA monoclonal antibody tubes and pipette tip racks are loaded based on how many samples are in the CSV plate map. For more details, please refer to our detailed protocol.
Washing and substrate addition
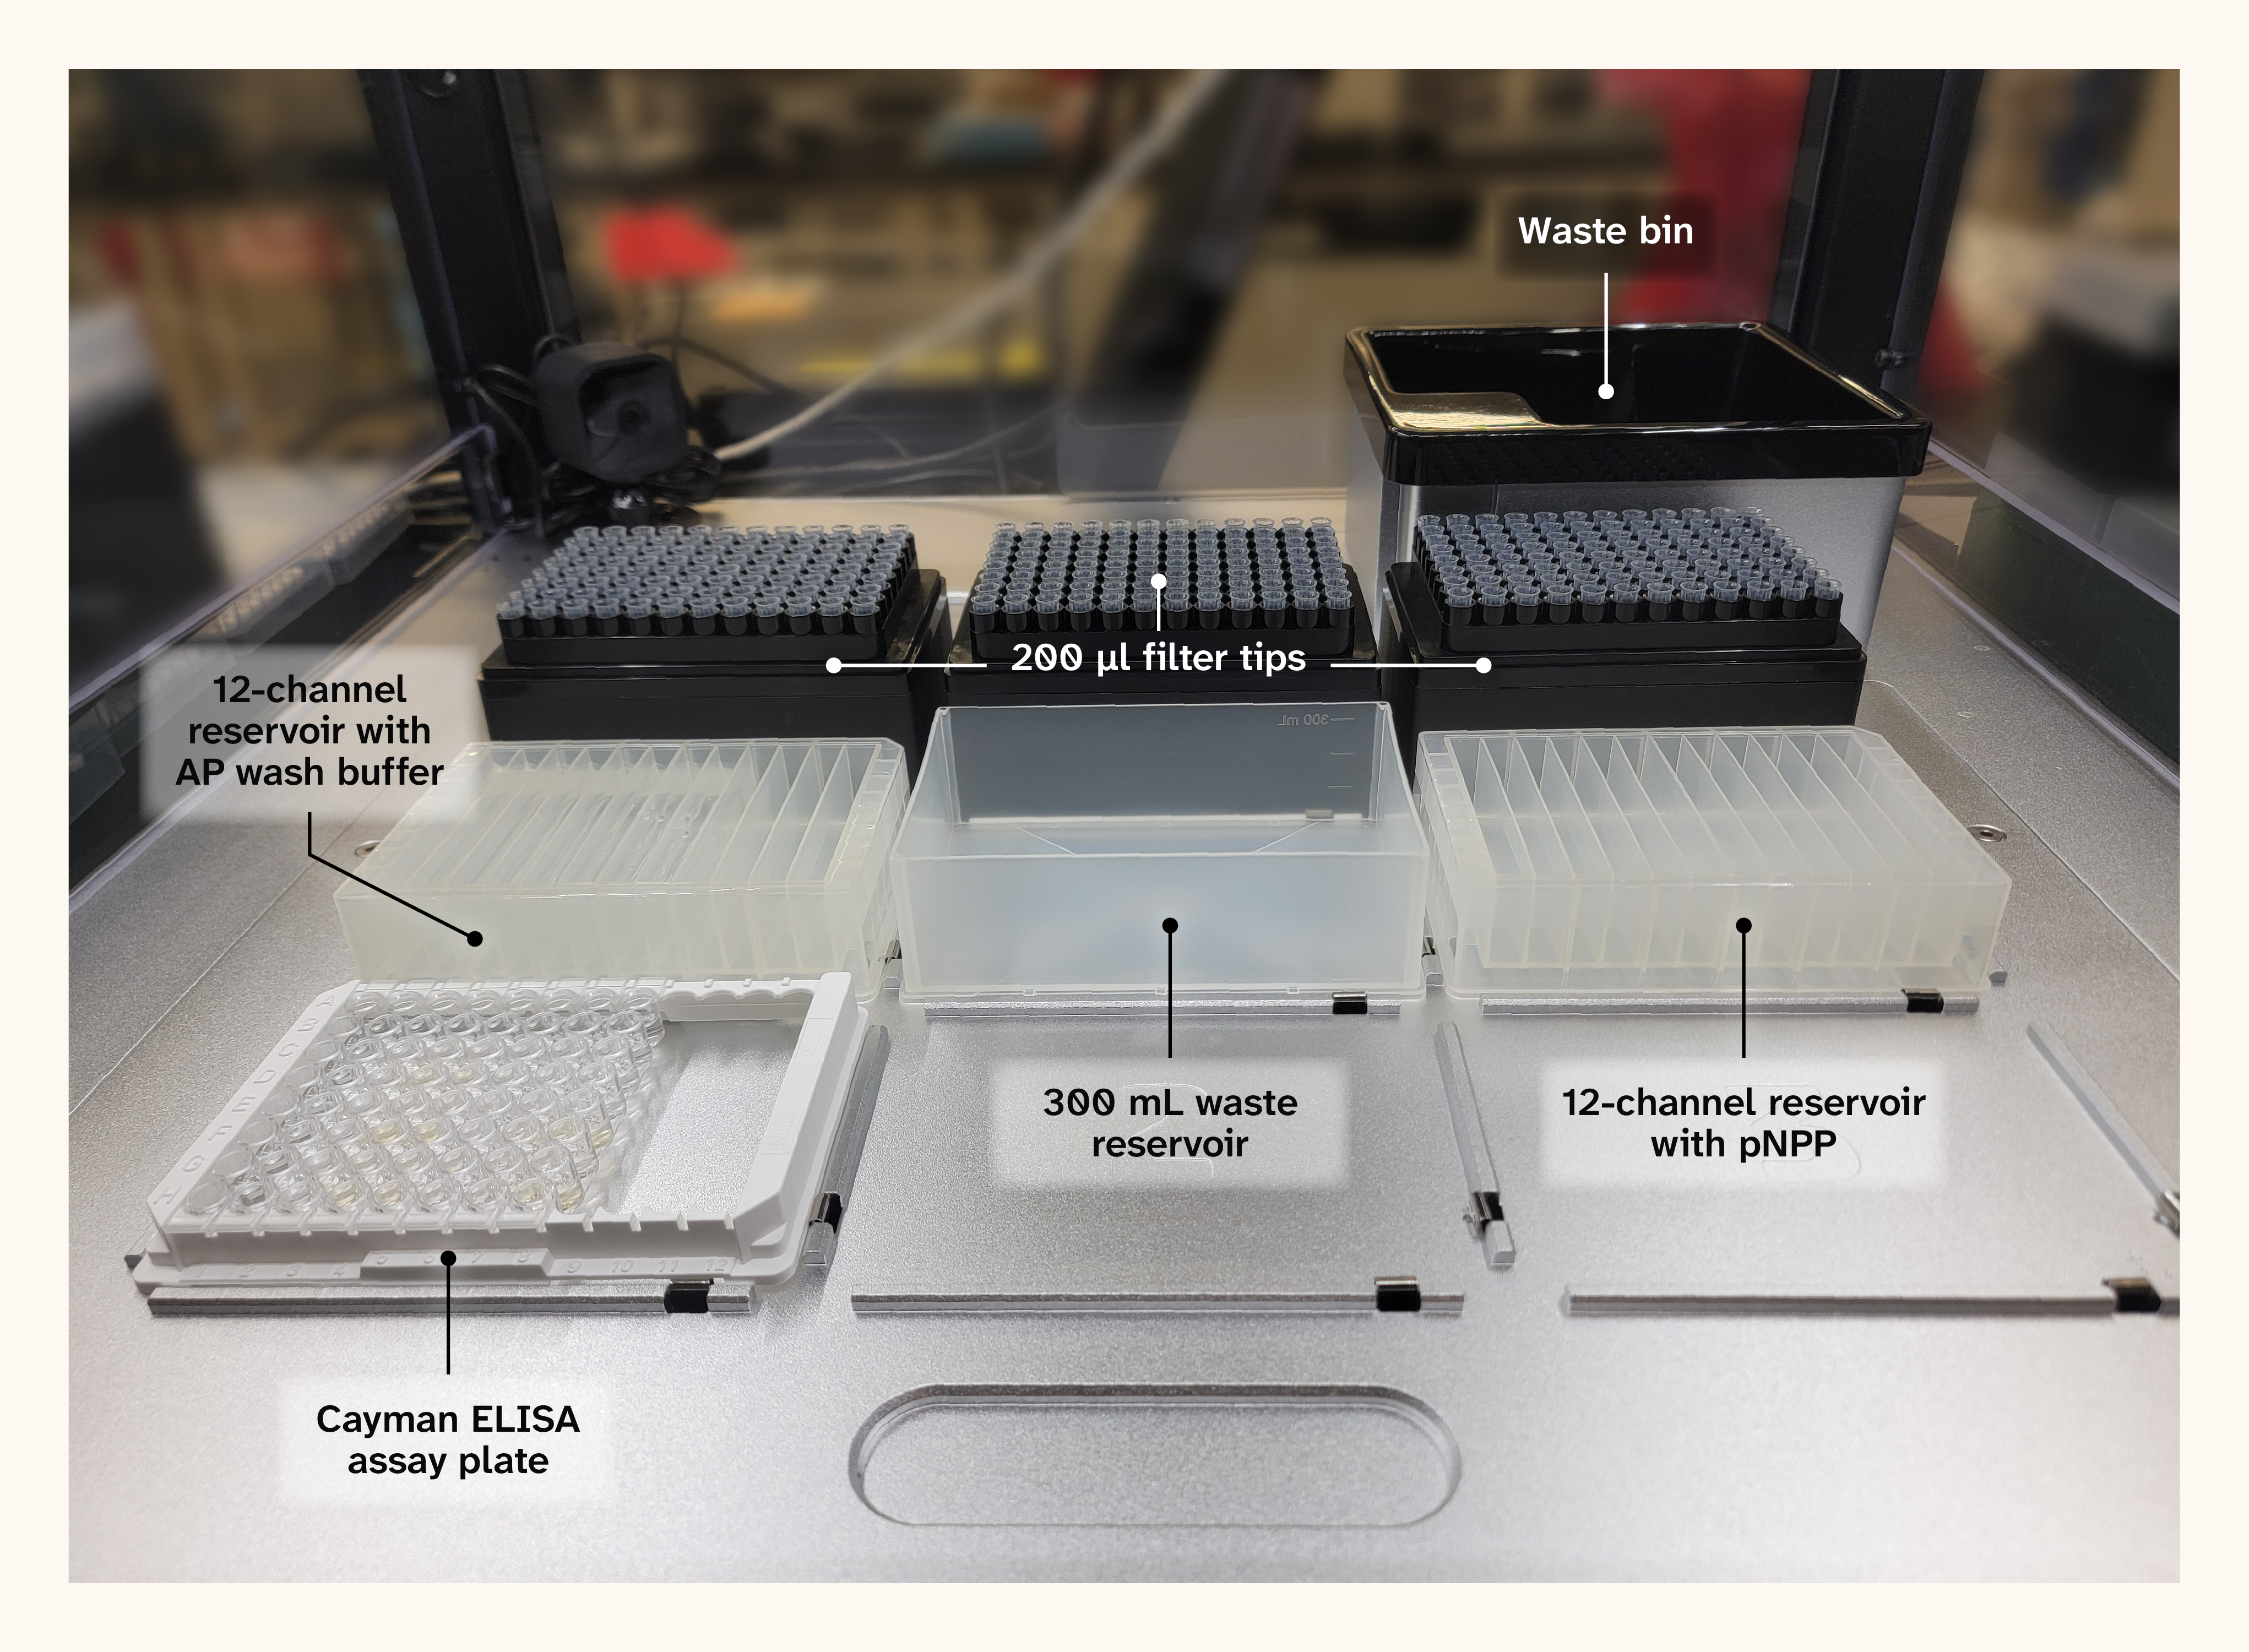
Figure 4. The OT-2 deck layout for the wash and substrate addition protocol.
The Opentrons deck layout must match Figure 4. The OT-2 wash and substrate addition script performs the supernatant removal, runs six washes with AP wash buffer, and adds pNPP substrate to each well. It's designed to load pipette tips, AP wash buffer, and pNPP substrate adaptively based on the number of columns selected in the parameter.
The script removes supernatant by aspirating with the multichannel pipette (rather than inverting the plate to decant supernatant) (Figure 5). Because aspiration doesn’t completely remove the AP wash buffer, we perform six washes rather than the four washes recommended in the kit manual. After six washes, residual volume in wells ranged from approximately 20–30 µL. At this residual range, repeated washing reduces carryover from the original sample mixture to near-zero levels. However, residual AP wash buffer remains at ~10–15% of the 200 µL pNPP addition and therefore represents a likely source of variability, as differences in residual volume across wells directly affect substrate concentration.
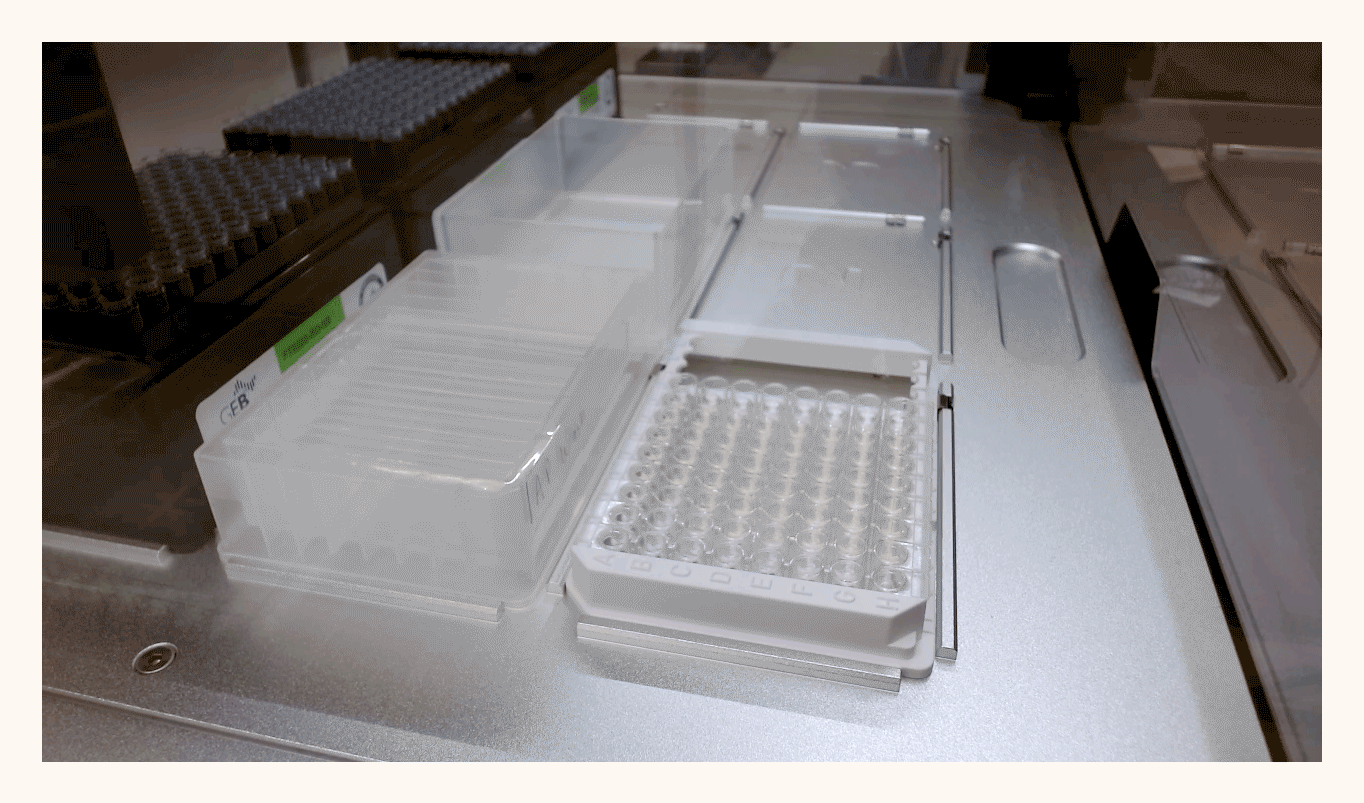
Figure 5. Supernatant is removed with a P300 multichannel during the beginning of the wash protocol.
The script uses a 12-channel reservoir to contain an on-deck AP wash buffer, reducing the risk of cross-column contamination (Figure 6). It reuses tips during wash buffer aspiration and dispensing steps, and the multichannel head aspirates residual liquid into the tip box during reattachment. The tip box is compartmentalized by column, further preventing cross-column contamination.
Figure 6. Wash buffer is added to wells with a P300 multichannel during the wash protocol.
After the wash steps, there's a final round of aspirations to remove excess liquid. The script pauses and prompts the user to fill the first two channels of a 12-well reservoir with pNPP substrate in position six. We added this pause step to minimize the substrate's exposure to ambient light and temperature, limiting variability in signal development. After substrate addition, the plate is ready for incubation, and then an absorbance reading at 415 nm.
3D-printed tip chute
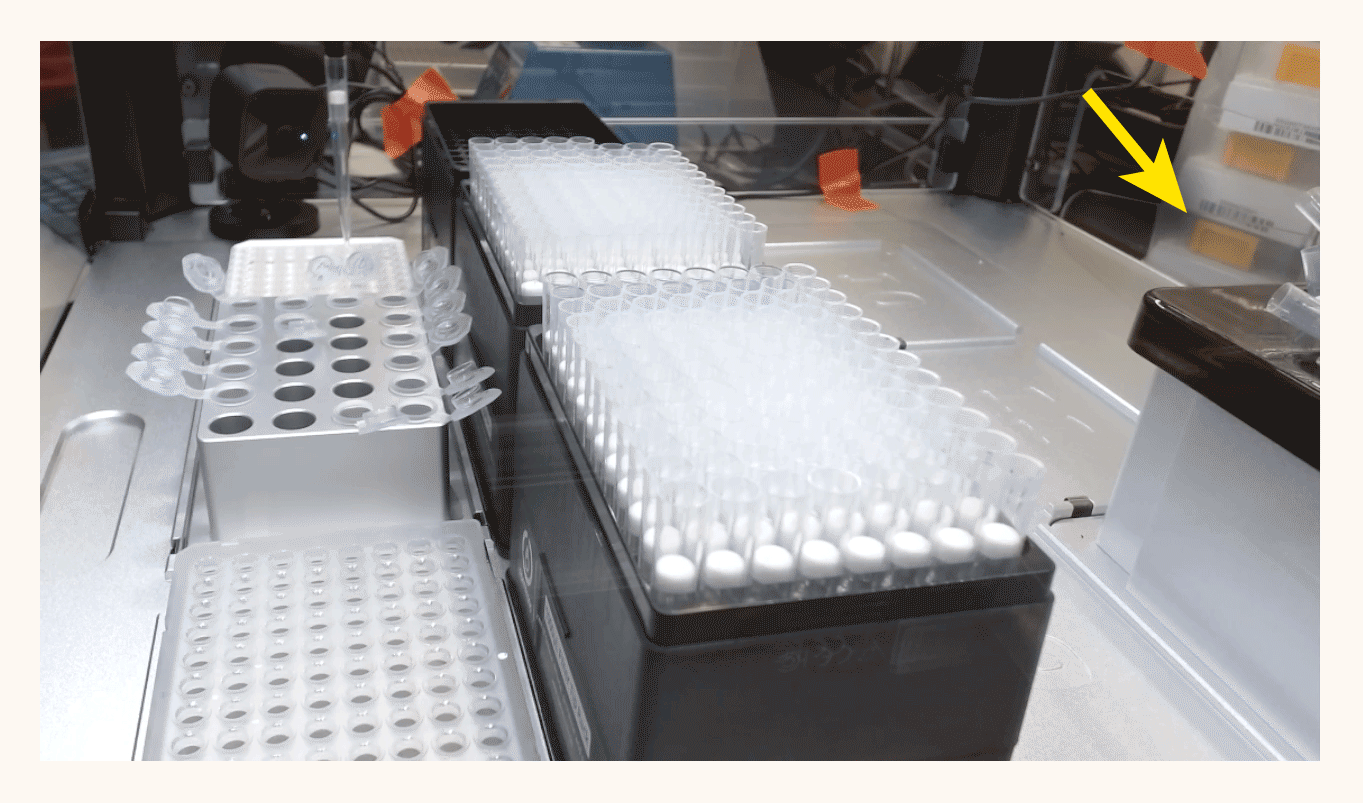
Figure 7. Time-lapse of the sample-loading protocol where P1000 filter tips fill the waste bin and overflow onto the deck.
We noticed that for experiments with many samples, the default waste bin overflows with P1000 tips and spills onto the deck (Figure 7). We designed a 3D-printable chute that directs used tips off the deck into a larger waste container (Figure 8). An alternate script drops tips directly into this chute.
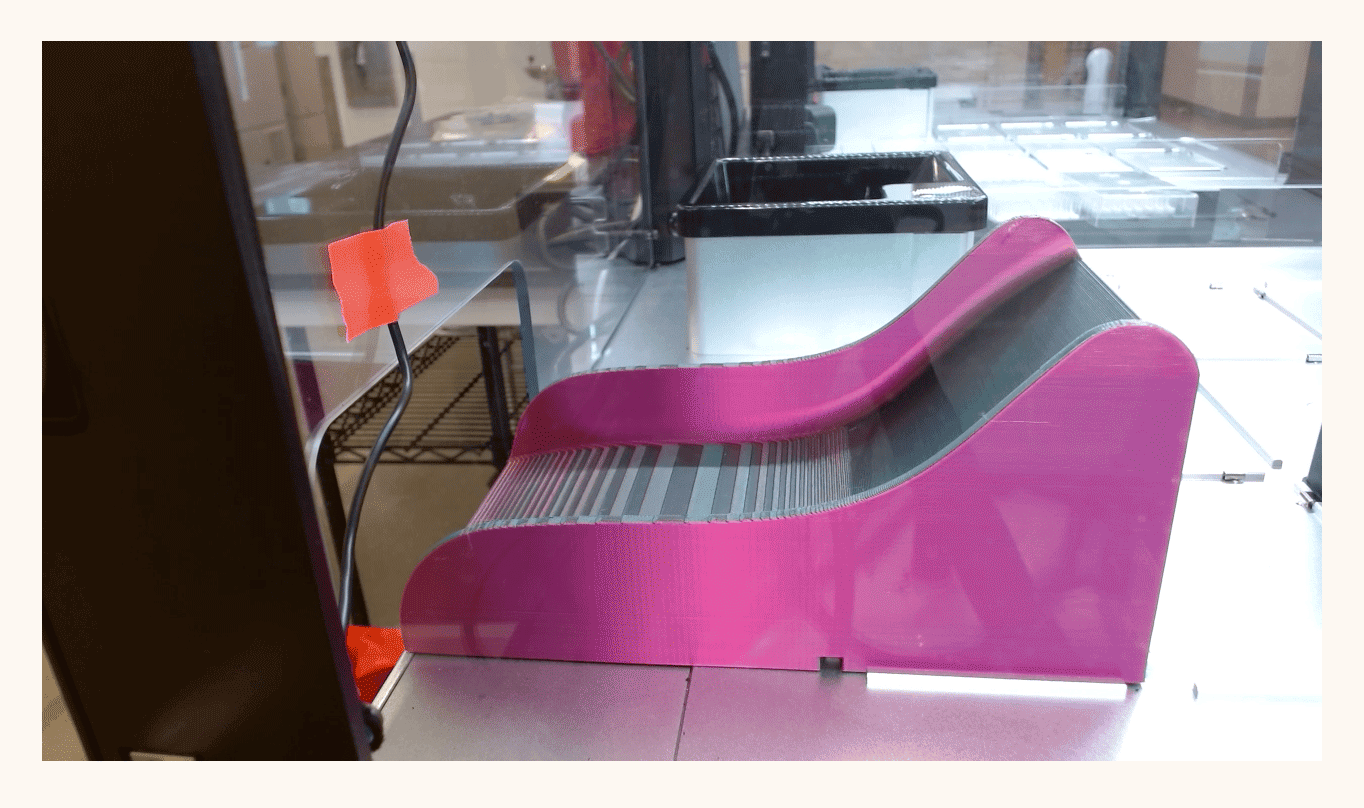
Figure 8. A P1000 tip is discarded off deck using the 3D printed waste chute.
Download the 3D model of the tip chute from our GitHub repo or NIH 3D.
Data analysis
Code for data analysis is in our GitHub repo.
Analysis framework
Each plate carries three control well types defined in the Cayman kit: Blk (blank — substrate only), NSB (non-specific binding — tracer without antibody or sample), and (maximum binding — full reaction without sample).
The standard Cayman analysis 6 includes: blank subtraction across all wells, NSB-corrected percent maximum binding () for each well, and a four-parameter logistic fit to the six-point standard curve (3–0.093 µg/mL, on a linear y-axis vs. log concentration on the x-axis).
While not explicitly stated in the kit instruction manual, to convert sample values back to concentration, you invert the fitted curve:
where is the sample's and , , , and are the upper asymptote, Hill slope, IC50, and lower asymptote from the fit. The result is the concentration of His-tagged protein in the assay well, not in the original sample. To estimate the concentration in the undiluted lysate, multiply by the dilution factor used when loading (e.g., × 5 for a 1:5 dilution).
Our analysis flags samples that fall outside the kit's reliable range ( of 20–80%) or that disagree by more than 20% across dilutions, per Cayman's guidance. Because immunoreactivity varies between His-tagged proteins depending on tag accessibility 7, the kit is best treated as a semi-quantitative tool — useful for ranking relative protein levels across samples or purification steps rather than for absolute quantification.
Example use case: His-tagged protein in Chlamydomonas
To validate our automated ELISA workflow, we used it to detect His-tagged protein in lysates from Chlamydomonas reinhardtii. We used a strain carrying an 8×His-tagged copy of atpB (CC-6114) and a strain without any His-tagged genes (CC-5415). Note that we don't consider the properties of these strains to be relevant to this pub — they simply serve as positive and negative controls for His-tagged protein detection.
Methodology
We grew Chlamydomonas reinhardtii strains CC-5415 (nit1-305 agg1 mt+) and CC-6114 (FUD50::8xHis atpB mt+) (sourced from the Chlamydomonas Resource Center) in 10 mL of Tris-acetate-phosphate (TAP) medium in deep 24-well plates to an OD750 of approximately 1.8–2.0. We pelleted cells at 3,000 × g for 5 min, removed the supernatant, then lysed pellets by adding 50 µL of 1× BugBuster reagent directly to the cell pellet and pipetting until homogeneous. We extracted lysates by end-over-end rotation for 30 min at 4 °C, then clarified by centrifugation at 21,100 × g for 30 min at 4 °C.
We measured total protein concentration using a BCA assay (Pierce, 23225). We incubated BSA standards (0–2 mg/mL) and 1:10-diluted lysate samples with BCA working reagent at 37 °C for 30 min and read with a microplate reader (Molecular Devices, SpectraMax iD5) at 562 nm. We then normalized lysates to a common protein concentration of 3 mg/mL using 1× BugBuster.
We diluted normalized lysates with Cayman TBS assay buffer at 1:5 and 1:10 for ELISA loading, achieving final total protein concentrations of 0.6 and 0.3 mg/mL, respectively.
Diluting samples at least 1:5 is critical for proper ELISA binding — components of the lysis buffer (particularly detergents in BugBuster) inhibit the competitive binding reaction at lower dilutions, producing artificially elevated absorbance values that don't reflect true His-tagged protein levels. We recommend testing each new sample matrix at multiple dilutions to confirm that the dilution factor doesn't affect the estimated concentration.
We loaded each diluted lysate onto the ELISA plate in duplicate for the His+ (CC-6114) and His− (CC-5415) controls at both the 1:5 and 1:10 dilutions, and as a single well for the TAP medium control at each dilution.
Results
We used our Opentrons protocol to run the Cayman ELISA kit on lysates from two Chlamydomonas reinhardtii strains — one expressing a His-tagged protein (His+) and one expressing none (His−) — along with a growth-medium-only control.
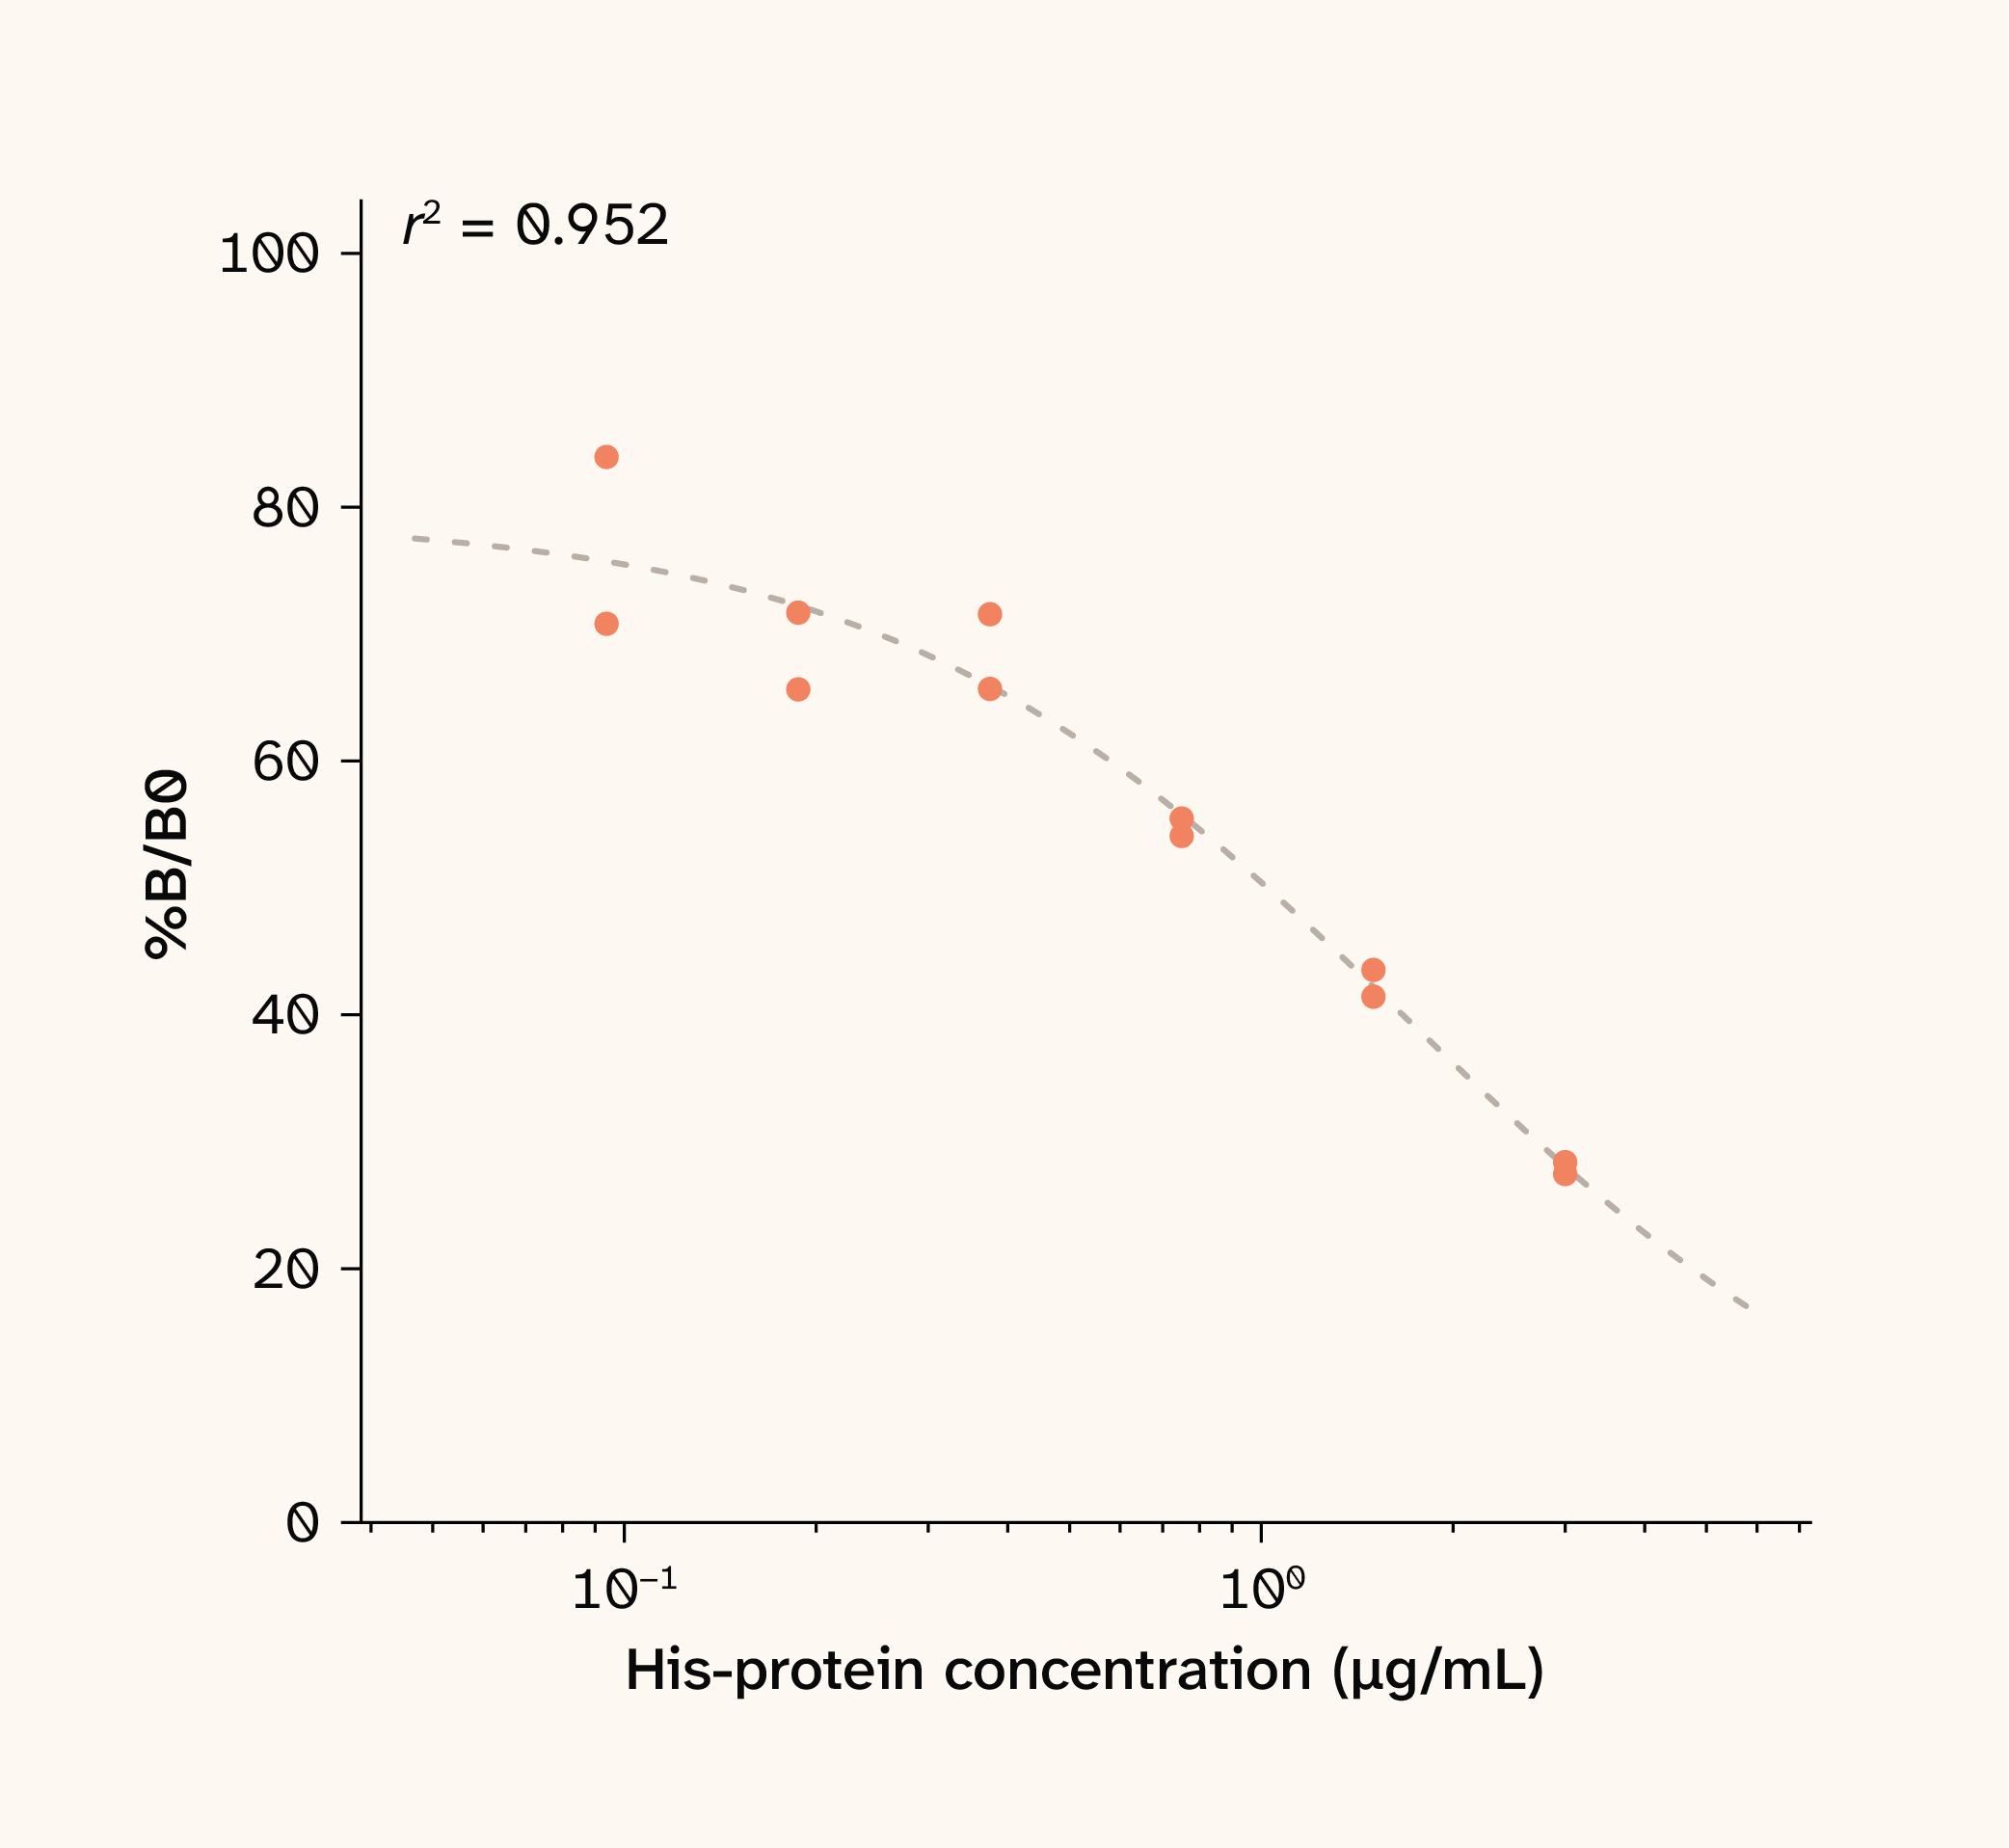
Figure 9. Standard curve plot of percent maximum binding () versus log concentration.
The standard curve (Figure 9) showed good duplicate-well agreement at the top three standards (CV ≤ 3.5%), but increasing scatter at the bottom three (CV 6.1–12.0%). The 4PL fit (r2 = 0.95) loses resolution below ~0.4 µg/mL — S4 (0.375 µg/mL) and S5 (0.1875 µg/mL) gave essentially identical readings — so concentration estimates derived from the lower end of the curve are only semi-quantitative.
The assay can distinguish His-tagged from untagged samples. At the 1:10 working dilution, the His+ control returned an estimated 12.0 µg/mL of His-tagged protein, well above the His− control (3.5 µg/mL) and the TAP medium blank (1.8 µg/mL) (Figure 10). The non-zero His− value likely reflects background cross-reactivity at the assay's detection limit rather than true signal. The same qualitative ranking held at the 1:5 dilution, confirming that the separation isn't a dilution-specific artifact.
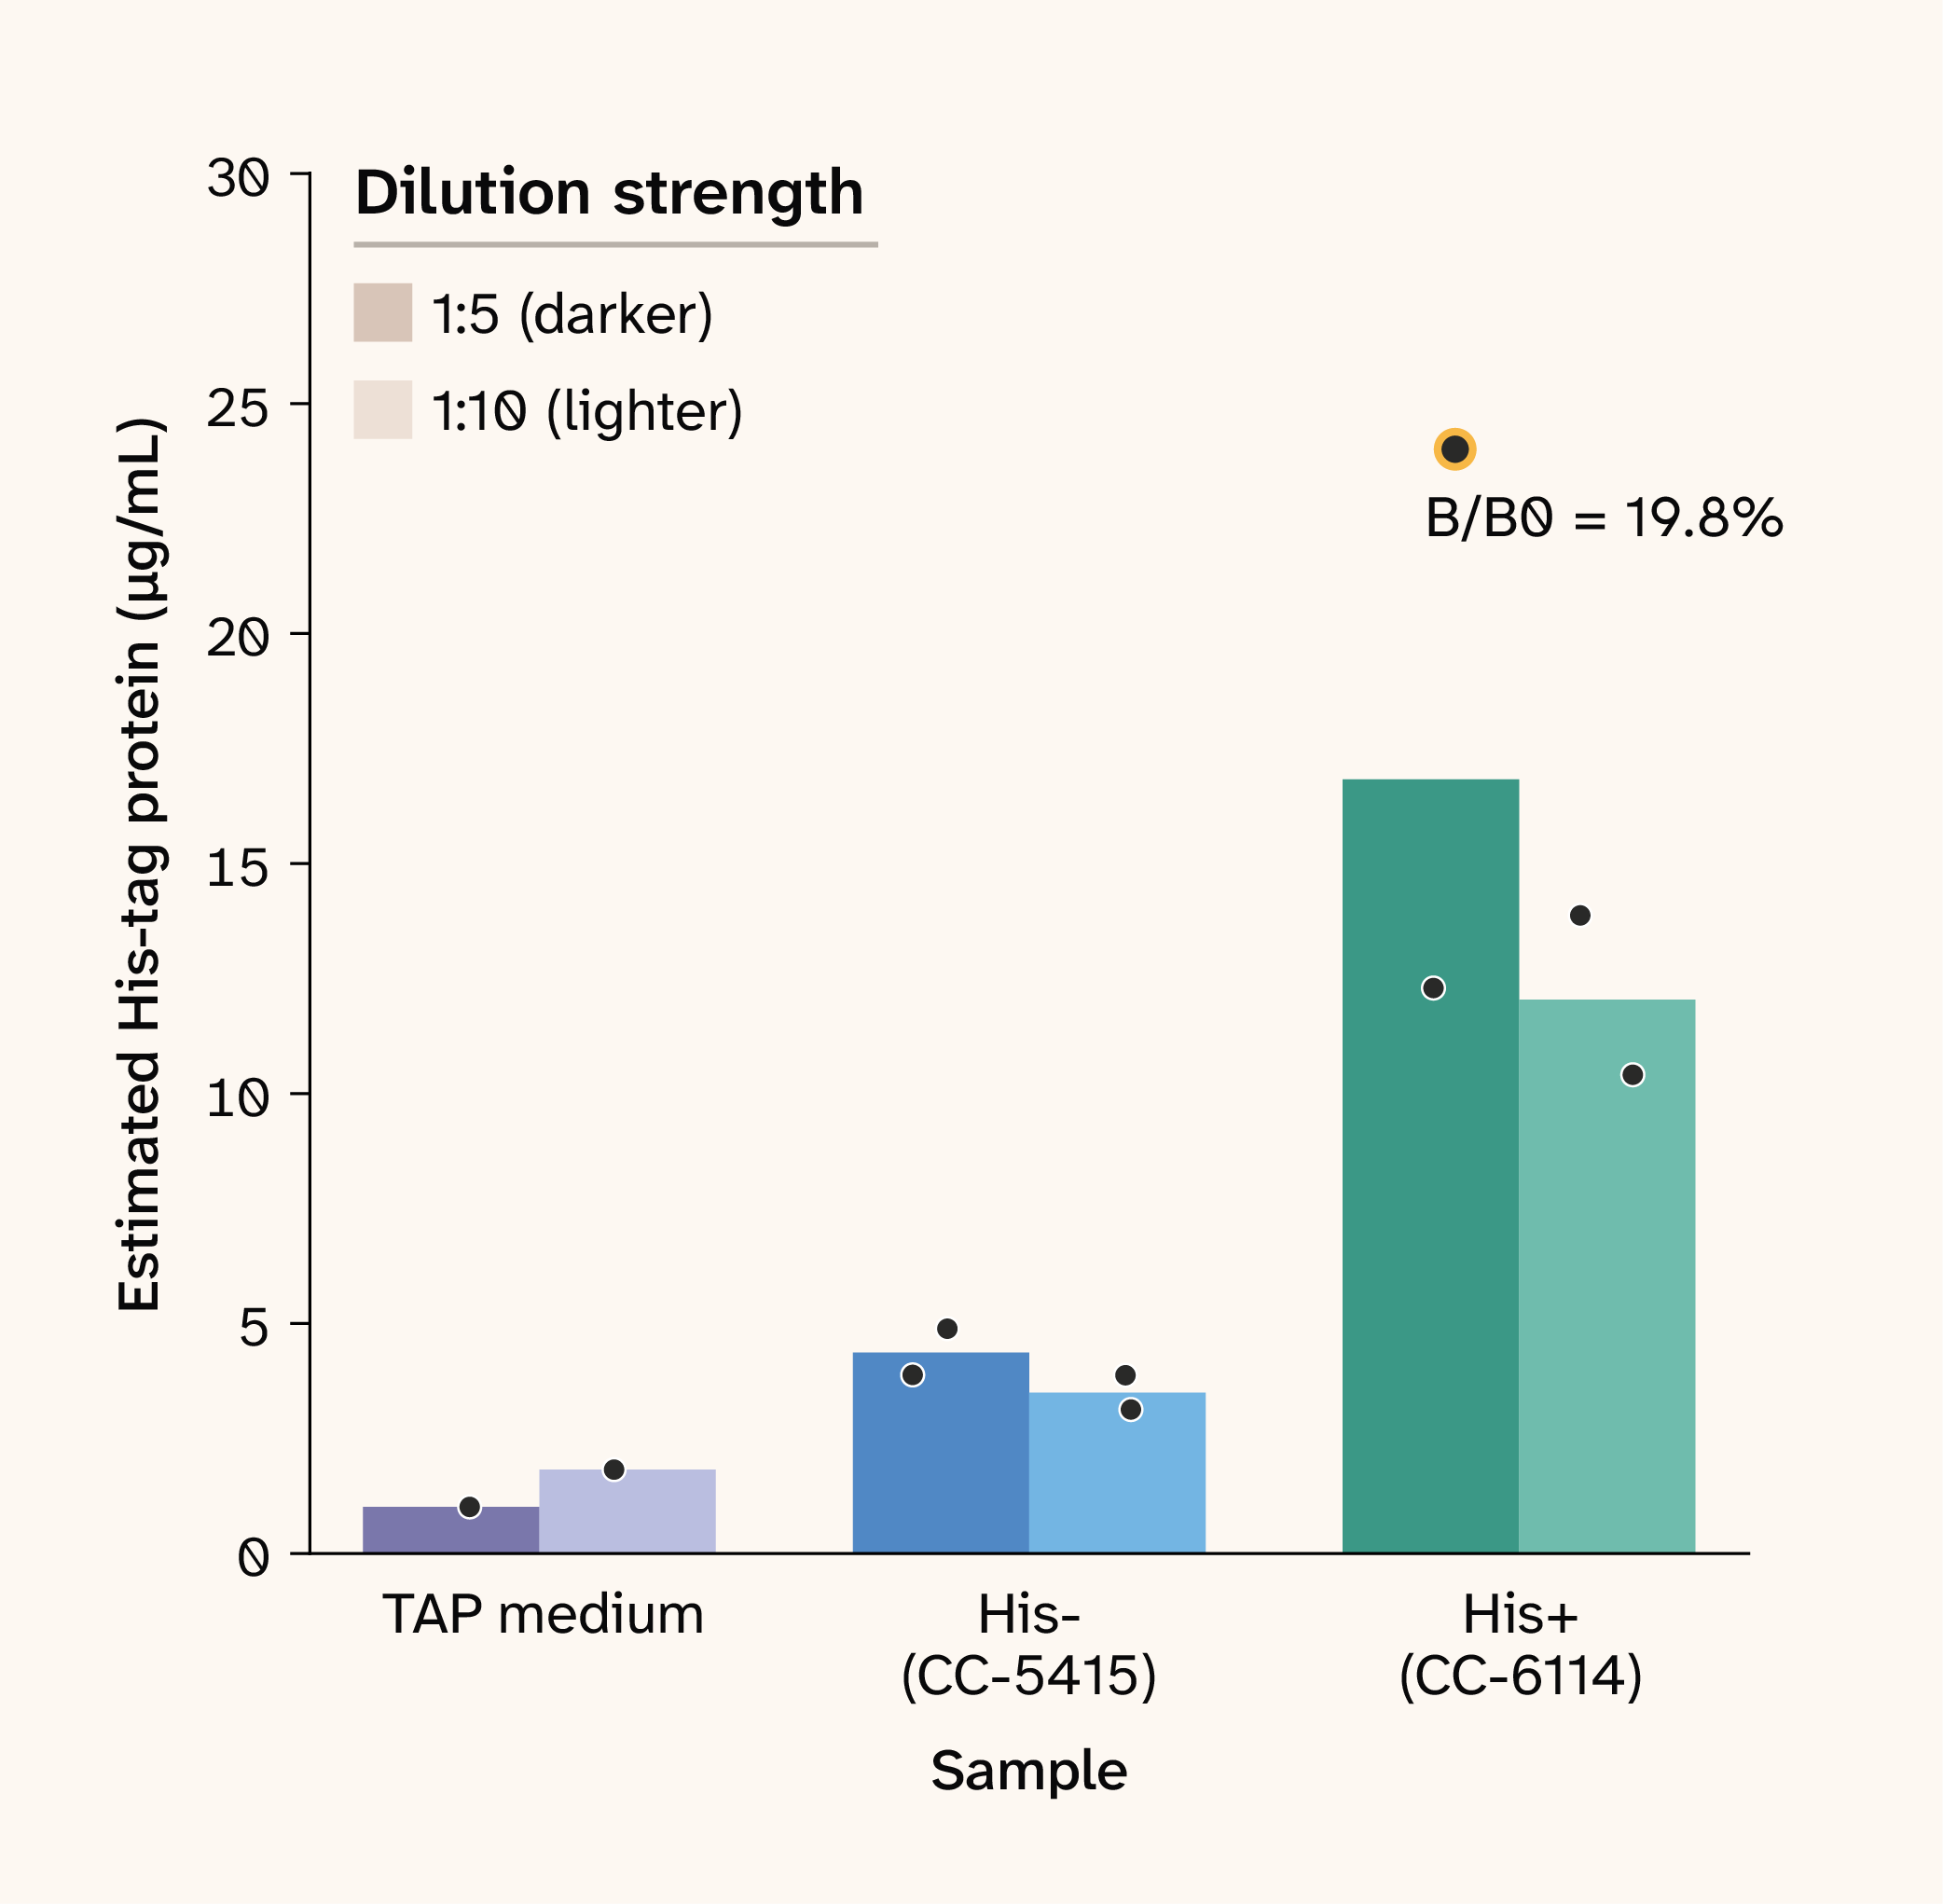
Figure 10. Our automated ELISA workflow detects His-tagged protein in C. reinhardtii.
The 1:10 dilution is the better working condition for this sample type, despite the narrower gap between the positive and negative His controls. Looking at individual wells rather than means shows us that at a 1:5 dilution, one of the two His+ replicates fell outside Cayman's reliable 20–80% range, and the two replicates disagreed by ~12 µg/mL (per-well estimates of ~12 and ~24 µg/mL) (Figure 10). At 1:10, both His+ replicates were in range and agreed to within ~2 µg/mL. The same pattern held for the His− control, with tighter replicate agreement at 1:10.
Residual matrix interference persists at both dilutions, so a dilution series should be standard for any new sample type. The His+ estimate dropped ~28% between the 1:5 and 1:10 dilutions, exceeding Cayman's 20% threshold for matrix interference and suggesting that lysis buffer components are still affecting the binding reaction even at 1:5. We recommend screening any new sample matrix across a dilution series before committing to a single working condition.
Additional methods
We used Claude (Opus 4.7) to help write, clean up, comment, and review our code, incorporating its feedback selectively and working in part within Cursor. We also used Claude (Opus 4.7) to draft text that we edited, suggest wording and sentence-structure ideas that we then chose among, expand on summary text we provided, copy-edit drafts to match Arcadia's style, clarify and streamline our own writing, rearrange starting text to fit one of our pub templates, suggest relevant papers (some of which we read further and cited), generate figure mockups to convey rough ideas, and review our pub, after which we edited the overall structure and wording based on its feedback. Claude (Opus 4.6) also helped clarify and streamline text.
We used arcadia-pycolor (v0.7.3) 8 to generate figures before manual adjustment in Adobe Illustrator.
Key takeaways
Our automation workflow and plate map generator are a simple solution to scaling up Cayman ELISA kit preparations. The plate map generator enables complete, modular experimental configuration without requiring users to write any new code. The 3D-printed tip chute enables high-throughput automation without clutter or cross-contamination.
As a whole, the workflow serves as a semi-quantitative tool that's able to rank relative His-tagged protein levels across samples, but can't determine absolute concentrations with high precision. We believe it provides a good point of reference for adaptation to other ELISA kits or manually prepared ELISAs against other targets.
Next steps
We plan to keep using this workflow in-house for His-tagged protein detection and rough quantification. Some next steps for the project include:
- Finding ways to make the assay more quantitative by further reducing leftover supernatant volumes during aspiration, transfer, and wash steps
- Expanding its use to other cell types/species, like Escherichia coli and Chinese hamster ovary (CHO) cells.
We welcome your feedback on whether this workflow was useful for you! We’d also like to hear how you build your own automation: Is there any software/hardware that was a game-changer? We hope to take what we've learned while building this workflow and apply it to other molecular biology assays in the future.
Be the first to comment on this publication.