Purpose
Raman spectroscopy can offer insights into a protein's three-dimensional structure. Here, we explored the utility and practicality of spontaneous near-infrared (NIR) Raman spectroscopy as a structural biology tool. We used 785 nm spontaneous Raman spectroscopy to assess protein structural changes induced by both highly impactful and more subtle chemical perturbations using several commercially available proteins, including bovine serum albumin (BSA), cytochrome c, and DNase I. We compared these measurements to another method — size-exclusion chromatography.
Our preliminary results suggest that spontaneous Raman with NIR excitation can, without perturbation, detect key structural features in several of the proteins we tested. Furthermore, we were able to detect changes in secondary structure due to chemical perturbation and pH modulation. Some perturbations drove interpretable spectral changes, while others led to less interpretable changes, underscoring the importance of orthogonal biophysical methods for confirming and validating Raman-based findings.
These results may be useful to structural biologists, biophysicists, and protein engineers working with diverse protein classes, and we hope that this work encourages broader adoption of spontaneous Raman spectroscopy as a rapid, label-free tool for monitoring protein structural integrity and stability in solution.
Background and goals
Raman spectroscopy is a powerful, non-destructive analytical technique that probes the vibrational modes of molecules through the inelastic scattering of light, yielding a spectrum that reflects the chemical bonds and structural arrangements present in the molecule 1–2. In spontaneous Raman, a monochromatic laser illuminates a protein sample that inelastically scatters a small fraction of photons. For proteins, the spectrum of scattered photons translates into a rich source of structural information 3–5 (Figure 1). Key spectral features include the amide I and III bands, which are highly sensitive to secondary structure (α-helices, β-sheets, and random coils) 6, allowing researchers to estimate conformational composition without crystallization or isotopic labeling. Aromatic amino acid residues tryptophan and tyrosine contribute distinct peaks that are sensitive to local environment and side-chain interactions. The ring breathing mode of phenylalanine is, by contrast, relatively insensitive to local environment and structural changes, so it serves as a useful internal reference 7. Disulfide bridges (S–S bonds) produce characteristic bands that reveal the oxidation state and geometry of cysteine cross-links 8.
One of the major advantages of Raman spectroscopy is its compatibility with aqueous solutions, which is critical when studying protein features in near-physiological conditions 9. Water is a weak Raman scatterer, but in other spectroscopic modalities, notably infrared spectroscopy, water-generated spectra confound protein signals.
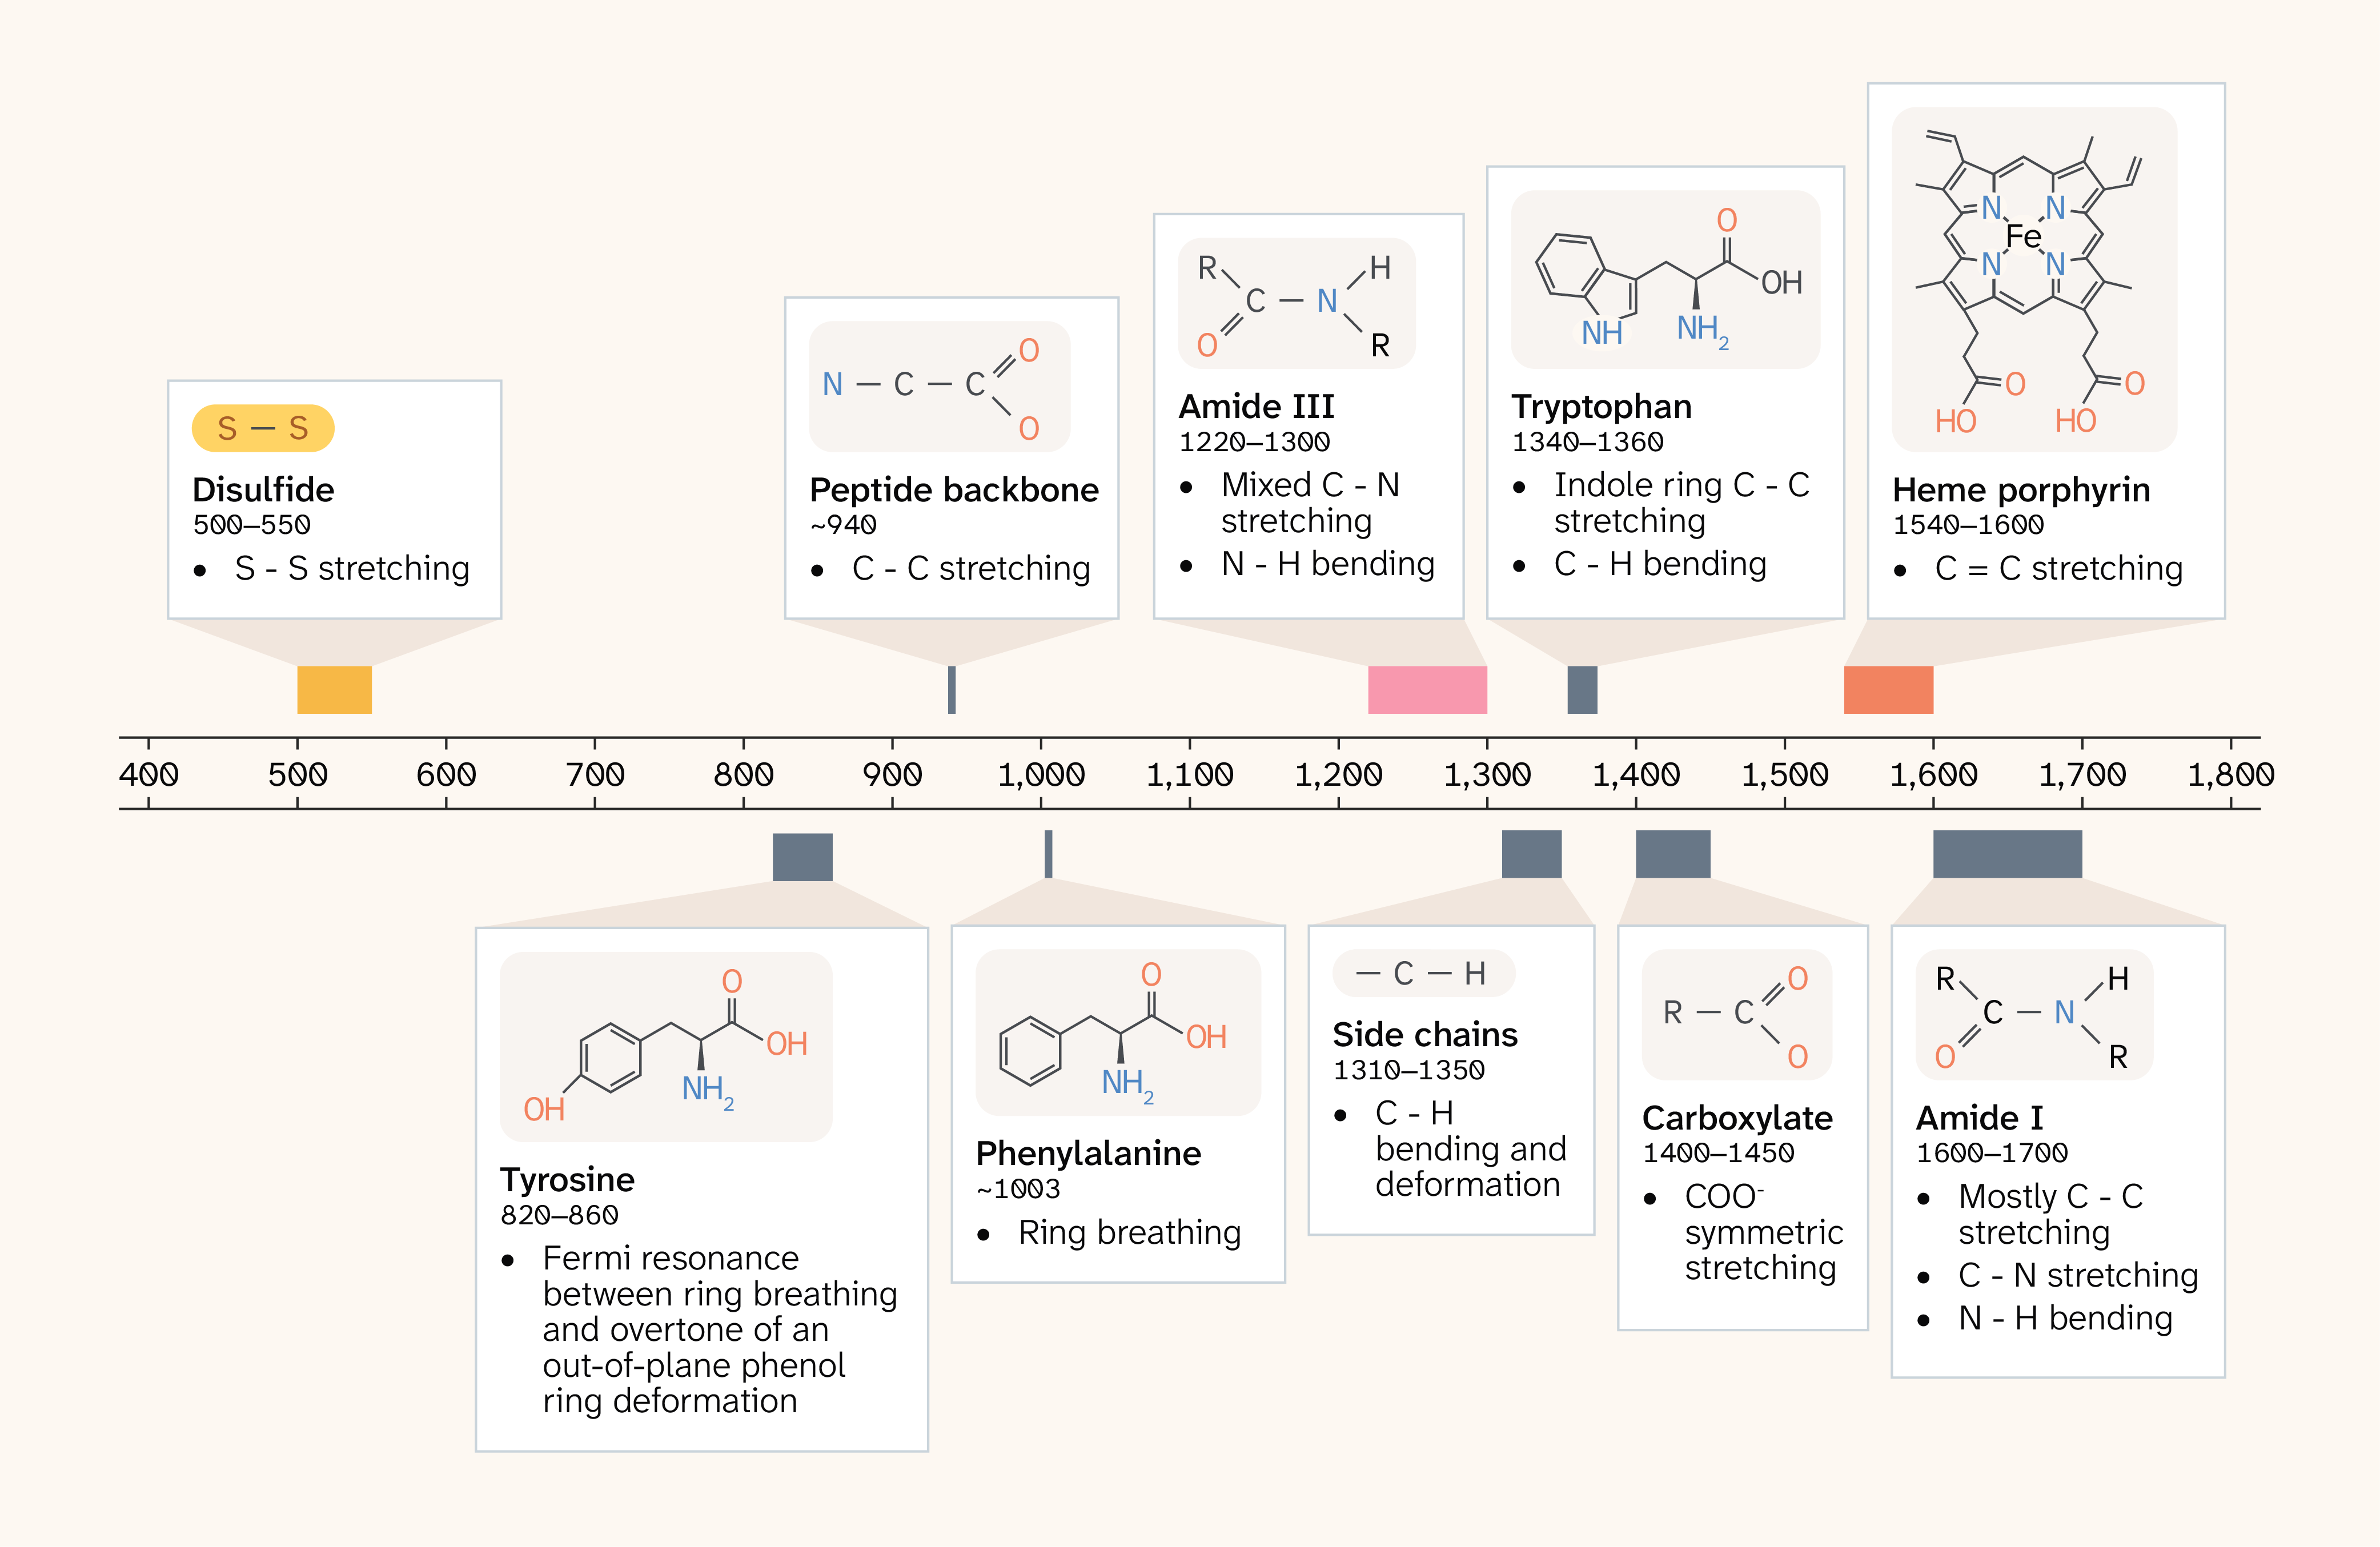
Figure 1. A guide to Raman vibrational modes of proteins.
Overview of some key peaks in Raman spectra of proteins. This figure shows distinctive peaks commonly detected in Raman spectra of proteins, the approximate Raman shift ranges, and the associated vibrational modes.
Raman spectroscopy is already an indispensable tool in structural biology and biophysics 10–12, complementing techniques such as nuclear magnetic resonance (NMR), X-ray crystallography, and cryo-electron microscopy (cryo-EM) by providing rapid, label-free insights into protein folding, misfolding, aggregation, and ligand binding — all of which are central to understanding both protein function and disease. Our focus is on 785 nm (near-infrared) Raman spectroscopy, in contrast to other studies that use UV and visible excitation to study proteins. 785 nm Raman represents a practical and accessible addition to protein characterization workflows, as similar instrumentation is already used in some biological laboratories for applications such as tissue imaging 13. It provides non-resonant, broadly sensitive detection of protein structure under native-like conditions with reduced photodamage and fluorescence. We aim to establish Raman spectroscopy as a powerful biophysical technique, for detecting real-time protein folding changes and, potentially, in the future, enzymatic catalysis and binding.
While some studies of chemical and pH perturbations for select proteins exist 14–16, we want to expand to diverse protein classes, thus investigating universal versus class-specific changes detectable by Raman spectroscopy. We also want to extend the range of tested conditions, testing agents that should induce both large and subtle structural changes.
To that end, we perturbed a panel of commercially available proteins with chemical and pH-modulating treatments to test Raman's sensitivity to the resulting structural changes. We found that we could visibly detect differences in Raman spectra at expected shifts in several proteins, while our results with other proteins were more ambiguous or technically confounded. Jump straight to our findings, or read on for the methodological details of our approach.
The approach
We reasoned that the effects of structural perturbations on proteins should be detectable by spontaneous Raman spectroscopy 1. Thus, we used a reducing agent, TCEP, and a chelating agent, EDTA, to perturb protein structures by breaking disulfide bonds and disrupting metal ion interactions, respectively. We chose these treatments because they’re easy to prepare and should have different effects on various protein structures, ranging from subtle to drastic. Assessing the effect of treatment with each agent or both together, relative to no treatment, should reveal the utility of spontaneous Raman spectroscopy in characterizing structure relative to other modalities. Size-exclusion chromatography (SEC) provided an orthogonal check on the same treatments, using shifts in elution volume to infer changes in hydrodynamic radius.
We wanted to work with well-characterized, commercially available proteins with a variety of structural features that we could attempt to disrupt. We chose the following proteins:
- Bovine serum albumin (BSA) — An all-α-helical protein stabilized by multiple disulfide bridges
- Cytochrome c (cyt c) — A monomeric hemeprotein with a compact predominantly α-helical fold
- Hemoglobin — A tetrameric hemeprotein composed of four α-helical globin subunits
- DNase I — A monomeric endonuclease stabilized by coordinated divalent cations (Ca2+ or Mg2+)
- IgG — A disulfide-bonded antibody composed of two heavy and two light β-sheet-rich chains
- Trypsin — A monomeric serine protease with a β-barrel fold stabilized by multiple disulfide bonds
Protein preparation and TCEP and EDTA perturbation
We obtained the following powdered proteins from the indicated vendors:
- Bovine serum albumin (BSA) (Sigma Aldrich A9647-100G)
- Fatty acid-free bovine serum albumin (FAF-BSA) (Sigma Aldrich 126575-100G)
- Cytochrome c (Sigma Aldrich C2506-50MG)
- DNase I (Millipore 10104159001)
- Hemoglobin (Sigma Aldrich H0267-25MG)
- Trypsin (Sigma Aldrich T4799-10G)
- IgG (MB Bio Cat. NO 55908)
We obtained TCEP (Tris(2-carboxyethyl)phosphine hydrochloride) from GoldBio (TCEP25) and EDTA (ethylenediaminetetraacetic acid) pH 8.0 from Thermo Fisher Scientific (AM9261).
We resuspended each powdered protein in 100 mM NaCl, 20 mM Tris, pH 8, and diluted to 3 mg/mL or 10 mg/mL, unless otherwise specified, and then verified the concentration using a Thermo Fisher Scientific NanoDrop OneC spectrophotometer. We then aliquotted each freshly prepared protein and supplemented it with the appropriate chemical perturbant (TCEP, EDTA, or TCEP + EDTA). We incubated samples on ice for 1 h, then transferred 120 µl of each sample to a 384-well glass-bottom black plate (Thermo Fisher Scientific, NC0473621). We didn’t observe any precipitation under these conditions.
We used the following buffers for our Raman experiments:
Buffer without treatment: 100 mM NaCl, 20 mM Tris pH 7.5
TCEP condition: 100 mM NaCl, 20 mM Tris pH 7.5, 10 mM TCEP
EDTA condition: 100 mM NaCl, 20 mM Tris pH 7.5, 10 mM EDTA pH 8
TCEP + EDTA condition: 100 mM NaCl, 20 mM Tris pH 7.5, 10 mM TCEP, 10 mM EDTA pH 8
For size-exclusion chromatography, we used the same buffers, but included only 2 mM TCEP and 2 mM EDTA in the running buffer (when present) to maintain the perturbation without impeding gel filtration.
Preparation of pH panel to probe BSA structural response
To evaluate the types of structural changes detectable by Raman spectroscopy, we assessed the effects of BSA prepared in solutions spanning the entire pH range (0–14). BSA, like other proteins, can undergo reversible conformational transitions with changes in pH, such as aggregation, hydration, and unfolding 17. We started by acquiring Raman spectra from BSA prepared in different buffers from pH 1 to 14, including: sodium acetate trihydrate (pH 4.5), sodium citrate tribasic dihydrate (pH 5.0), succinic acid (pH 5.5), MES monohydrate (pH 6.0), BIS-TRIS (pH 6.5), imidazole (pH 7.0), HEPES (pH 7.5), Tris (pH 8.0), BIS-TRIS propane (pH 8.5), AMPD (pH 9.0), and glycine (pH 9.5). However, we found that most of the buffers we used to modulate pH in this way had their own Raman signature that saturated the protein signal. To overcome this issue, we opted to simply use HCl and NaOH in different concentrations to modulate pH.
We used HCl at different concentrations for the following acidic pH conditions: 0.0, 0.3, 1.0, 1.3, 2.0, 2.3, 3.0, 3.3, 4.0, 5.0, and 6.0. We used NaOH at different concentrations for the following basic pH conditions: 10.0, 10.7, 11.0, 11.7, 12.0, 13.0, 13.7, and 14.0. We used 50 mM Tris-HCl for pH 7.5, 8, 9, and 9.5.
For each pH, we prepared solutions and buffers with and without TCEP to examine the structural impact of disulfide bond reduction and potential pH-induced unfolding. We used a working stock of BSA at 100 mg/mL in 100 mM NaCl and 20 mM Tris pH 7.5 to prepare a final concentration of 10 mg/mL BSA in each of the above pH solutions with and without 10 mM TCEP.
We monitored pH using test strips before and after adding protein and TCEP to each solution, and the pH of several unbuffered solutions shifted (i.e., pH 3.3–6.0 and 10.0–11.7). We therefore present data only for solutions in which pH remained stable (i.e., pH ≤ 3, 7.5–9.5, and ≥ 12).
Acquisition of Raman spectra
We prepared proteins in the previously specified buffers and tested them in glass-bottom 384-well plates. We acquired spontaneous Raman spectra using Arcadia’s “InstantRaman” system, a custom automated measurement platform built around a Wasatch Photonics WP-785X-F13-R-ILC Raman spectrometer with 785 nm laser excitation. The reported spectral resolution of the instrument is 8 cm−1, with a range of 270–3,500 cm−1. Our system automates measurement across multi-well plates using a motorized stage and scripted acquisition routines to enable consistent, high-throughput collection of Raman spectra from protein solutions 3, 5. The acquisition parameters we used were as follows:
For the chemical perturbation experiments:
- Integration time: 30 s
- Laser power (measured at sample): 132 mW
- Number of averages: 4
- Sampling: single spectrum per sample
For the pH perturbation experiments:
- Integration time: 10 s
- Laser power (measured at sample): 171 mW
- Number of averages: 4
- Sampling: single spectrum per sample
Size exclusion chromatography (SEC)
To confirm the spectral variations observed for each protein across the four conditions, we performed analytical size-exclusion chromatography (SEC) at 4 °C on an ÄKTA pure chromatography system equipped with a 280 nm UV detector (Cytiva, RRID: SCR_023461) controlled by UNICORN software, using a Superdex 200 Increase 10/300 GL column (Cytiva, 28990944). We pre-equilibrated the column with the buffer in which each sample was suspended; however, the running buffer contained 2 mM TCEP and 2 mM EDTA, as noted above. We did not conduct parallel SEC experiments with our pH-modulated BSA panel.
Analysis of Raman and SEC data
Spontaneous Raman spectroscopy
We processed Raman spectra using the RamanSPy Python package (v0.2.10) 18. The processing steps were as follows:
- Cropping: We cropped the spectra to 350–1,800 cm−1 to focus on the fingerprint region.
- Cosmic ray removal: We used the Whitaker-Hayes algorithm with default parameters 19.
- Smoothing: We applied the Savitzky-Golay filter (window length: 5, polyorder: 3) to de-noise the spectra 20–21.
- Baseline subtraction: We fit a 9th-order polynomial to the cropped spectrum and subtracted this baseline using the
ModPolyfunction from pybaselines (v1.2.1) 22. This setting was empirically determined to reduce autofluorescence background without perturbing broad features such as the amide I and III regions. - Buffer subtraction: For each chemical perturbation experiment, we had in-plate controls for Tris, Tris + TCEP, Tris + EDTA, and Tris + TCEP + EDTA. We subtracted the corresponding control spectrum from each protein-containing spectrum. Raman spectra of the subtracted buffers are here. For the pH perturbation experiment, we generally subtracted the corresponding in-plate no-protein (buffer) spectrum. In the pH experiment with BSA only (no TCEP), we observed that Raman peaks from the buffer didn't always match those of the buffer with protein, likely due to pH-dependent peak shifts. In these cases, we empirically determined the best buffer spectrum to use for subtraction to eliminate false peaks due to subtraction artifacts. Specifically, for BSA spectra with pH between 7.5 and 9.5, we used the pH = 7.5 buffer spectrum for subtraction.
To fit and characterize the amide I region in the pH perturbation experiments, we fit a Gaussian function to a 120 cm−1 window around 1,657 cm−1 using the curve_fit function in SciPy (v1.17.1) 23 and extracted the computed peak center, full-width at half-maximum (FWHM), and the peak amplitude at the center.
We then assessed differences in features between processed buffer-subtracted spectra. We didn't perform replicate experiments or statistical tests; therefore, we provide qualitative interpretations of spectral differences. The focus of this study is on identifying consistent, mechanistically interpretable spectral changes rather than establishing statistical significance.
Size-exclusion chromatography
We exported raw SEC data from UNICORN as tab-separated CSV files (volume, mL; UV absorbance, mAU). For each protein, we processed one CSV per condition (e.g., buffer alone, TCEP, EDTA, TCEP + EDTA). For each trace, we normalized the UV signal to the range [0, 1] by min–max scaling (subtract the minimum, divide by the maximum minus the minimum). We interpolated each normalized trace onto a common volume grid (0.1–25 mL, 299 points) to overlay conditions. We recorded the elution volume at maximum UV for each trace. We wrote processed data to a single datasheet per protein (volume and normalized signal columns for each condition, plus peak positions) and used these to generate the SEC panels in the figures. Full SEC datasets are on GitHub.
Additional methods
We used Claude (Sonnet 4 and Sonnet 4.6), ChatGPT (GPT-4o and GPT-5.1), and Grammarly (Enterprise) to suggest wording ideas before we chose which small phrases or sentence structure to use, and to help clarify and streamline text that we wrote. We used Claude (Opus 4.1 and Opus 4.6) and Cursor to help write, clean up, comment, and review our code, then selectively incorporated its feedback. We used Gemini (2.5 Pro) and Claude (Sonnet 4.6) to provide feedback on reproducibility and soundness of arguments in the pub draft, and selectively addressed the feedback.
We used arcadia-pycolor (v0.7.2) 24 to generate figures before manual adjustment.
The results
We used spontaneous Raman spectroscopy to probe protein structure induced by TCEP, EDTA, and pH. We observed clear Raman spectral and SEC-based structural changes in BSA, cytochrome c, and DNase I. We observed a broad range of Raman responses across these proteins and perturbations, from pronounced spectral changes to more subtle yet consistent shifts, demonstrating that Raman spectroscopy offers dynamic range in detecting protein structural perturbations rather than responding only to large-scale changes.
Access our analysis code and raw data on GitHub (DOI: 10.5281/zenodo.19260397).
Raman spectroscopy can detect perturbation of a protein structure with TCEP and EDTA
BSA
As described in “The approach,” we acquired Raman spectra of BSA and fatty acid-free BSA (FAF-BSA, a purer BSA fraction that excludes lipid ligands) under four distinct chemical conditions: Tris buffer alone (no perturbation), treatment with the reducing agent TCEP, the divalent metal ion chelator EDTA, and both TCEP and EDTA. For the combined TCEP and EDTA treatment, we found that background subtraction alone was insufficient to remove artifact peaks, so we didn't include these spectra in the figure below to facilitate interpretability. The complete raw data and additional supplementary plots are available on GitHub. We included FAF-BSA to test if lipid-bound species or other matrix effects could explain spectral differences relative to standard BSA. We acquired spectra under the four conditions at 3 and 10 mg/mL and used SEC to monitor whether the same treatments altered protein behavior in parallel.
BSA is a largely α-helical protein stabilized by disulfide bonds, so we expected TCEP to destabilize the native conformation at the levels of tertiary and secondary structure, producing a large fingerprint change in the 400–1,800 cm−1 region. We expected EDTA to have a smaller impact on BSA as albumin isn't a metalloprotein in the conventional sense, so any EDTA-associated changes would possibly reflect peripheral electrostatic interactions, carboxylate interactions, or weak/ambient ion interactions rather than cofactor stripping.
TCEP caused the strongest remodeling across the fingerprint region, including S–S and amide III windows and an amide I shift, consistent with substantial unfolding after disulfide reduction (Figure 2). EDTA produced milder, localized intensity changes (notably in carboxylate-sensitive regions) without the global remodeling seen for TCEP. FAF-BSA largely recapitulated BSA, supporting that the dominant TCEP/EDTA responses are protein-intrinsic, with a notable exception around ~1,410 cm−1 (see “In-depth analysis and interpretation”). SEC showed condition-dependent shifts in elution, consistent with changes in size/oligomerization, confirming the spectral trends.
For clarity, Figure 2 shows 10 mg/mL BSA. See our supporting data for BSA (3 mg/mL) and fatty acid-free BSA (3 mg/mL and 10 mg/mL).
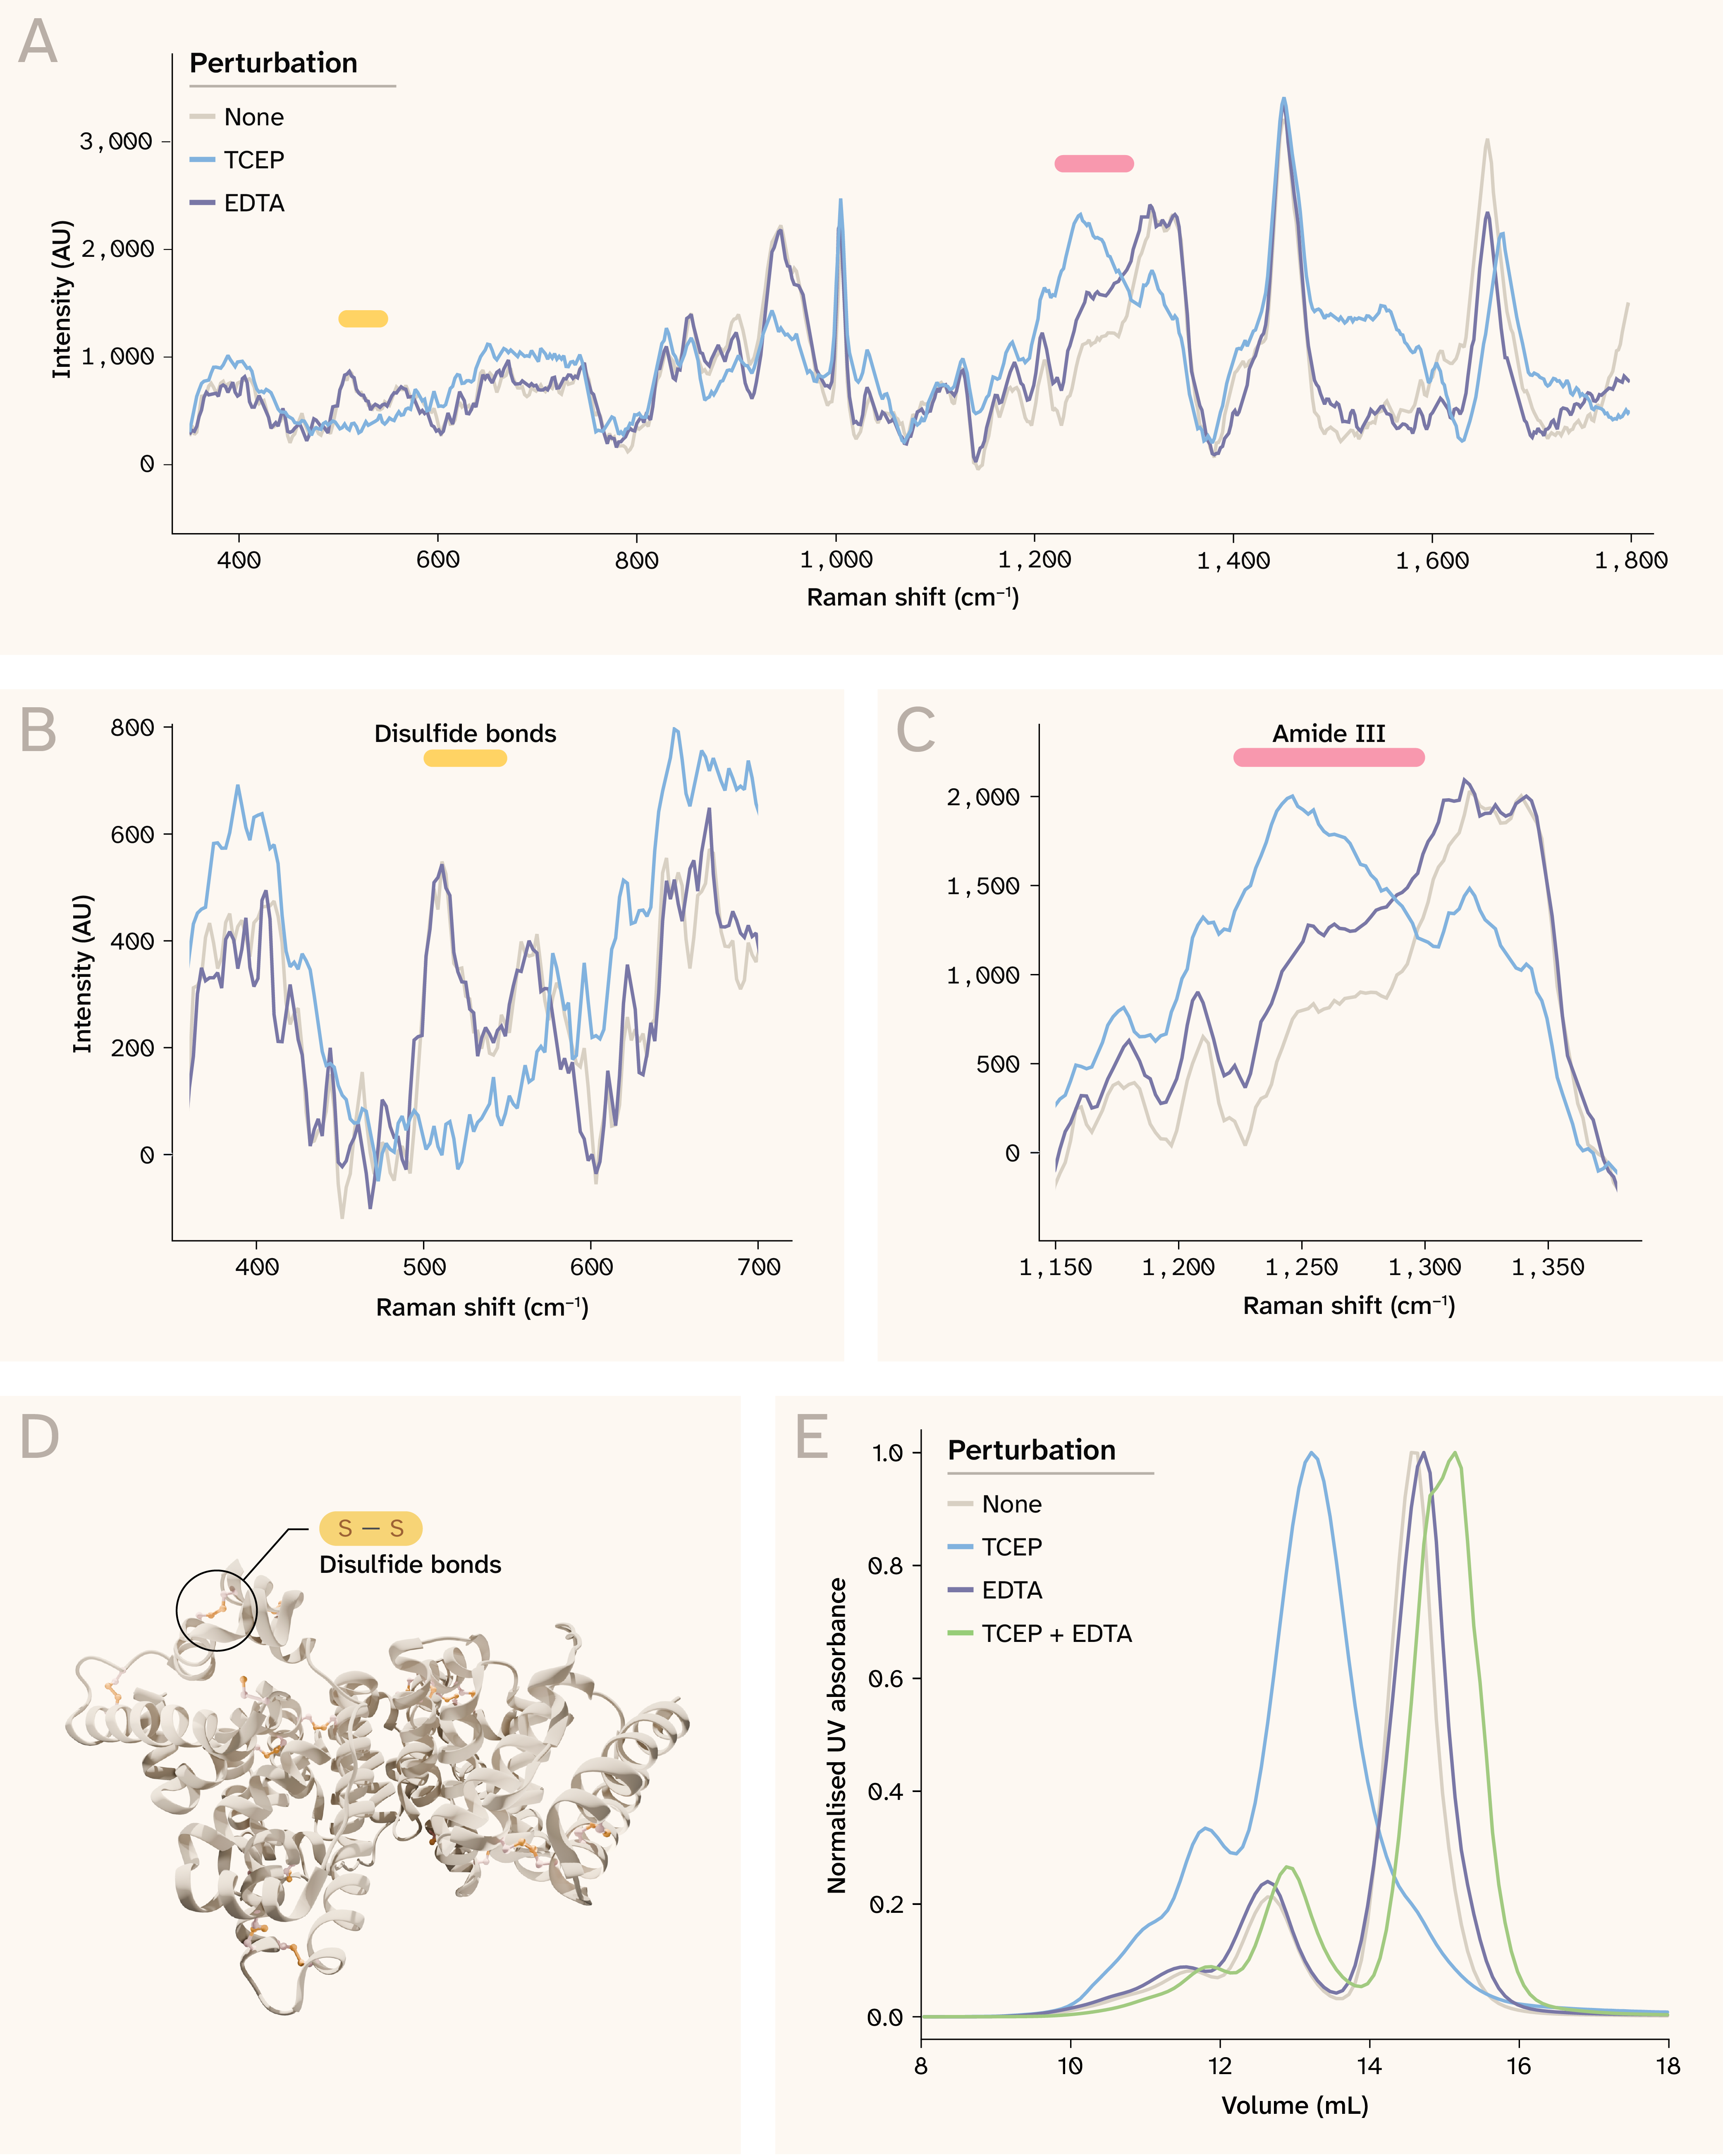
Figure 2. Bovine serum albumin structural perturbations are detectable by spontaneous Raman spectroscopy.
(A) BSA Raman spectra in the fingerprint region for each perturbation at 10 mg/mL. We highlight spectral windows corresponding to disulfide bonds and the amide III region, which are shown in B and C. Click here to view an interactive version of this panel in a new tab.
(B) Perturbations affect disulfide bond (S–S) stretching (510–540 cm−1).
(C) Perturbations affect the amide III region (1,230–1,300 cm−1).
(D) Albumin adopts an α-helical structure stabilized by 17 disulfide bonds (PDB: 4OR0).
(E) SEC indicates BSA changes into multiple species in solution following perturbation.
Note that axes differ across panels A–C.
In-depth analysis and interpretation
The fingerprint region spectral profiles (350–1,800 cm−1) show condition-dependent intensity variations across multiple vibrational bands (Figure 2, A). We focus below on S–S, amide III, tyrosine Fermi doublet, amide I, EDTA-sensitive carboxylate features, FAF-BSA controls, and SEC. We identified two spectral windows sensitive to perturbation that were of particular structural interest. The 510–540 cm−1 range corresponds to S–S stretching of disulfide bonds 25. Here we observed a reproducible reduction in signal intensity, particularly for the ~510 cm−1 peak, upon TCEP (but not EDTA) treatment, consistent with reductive cleavage of disulfide bridges (Figure 2, B). In the amide III region (1,230–1,300 cm−1), we observed a partially resolved feature around 1,270 cm−1 in the Tris buffer, but it was weak in comparison to the features at 1,318 and 1,339 cm−1, as reported in previous studies of albumin 2 (Figure 2, C). The 1,318 cm−1 peak is likely due to C–H deformation modes of aliphatic side chains, while the 1,339 cm−1 peak likely arises from a mix of modes, including the deformation of side chains, tryptophan contributions, and possibly backbone deformations. Upon addition of TCEP, but not EDTA, a broad peak at ~1,246 cm−1 is clearly distinguishable, further suggesting the loss of the α-helical structure. At the same time, the peaks at 1,318 and 1,339 cm−1 notably decreased in intensity (Figure 2, B).
In addition, we observed a change in the intensity ratio of the peaks at 854 and 829, from 1.41 to 0.90 upon TCEP treatment. This doublet is commonly known as a Fermi resonance pair, arising from a tyrosine ring-breathing vibration and the overtone of an out-of-plane ring bend, and is a known marker of the hydrogen bonding and side-chain environment 26. The decrease in this ratio indicates increased hydrogen bonding and a changed local environment (e.g., reduced solvent exposure) of tyrosine residues, suggesting structural changes following TCEP addition. We also saw a clear shift in the amide I peak, from 1,655 to 1,671 cm−1, upon TCEP addition, consistent with a loss of native α-helical structure and unfolding. This interpretation is further supported by the reduced intensity of the features between 920 and 970 cm−1, which are assigned to backbone skeletal stretching modes that are related to the α-helical structure and local backbone conformation.
When we added EDTA to BSA, we observed a series of milder intensity changes at peaks between 900 and 1,660 cm−1. Most clearly, the addition of EDTA to BSA resulted in the loss of the ~1,410 cm−1 peak, which is commonly assigned to carboxylate-symmetric stretching from side chains of acidic residues. We also observed small changes in the 1,586–1,625 cm−1 region, which is associated with carboxylate asymmetric stretching modes. Together, these results suggest perturbation of acidic (carboxylate) residues, consistent with EDTA-mediated chelation of metal ions and changes in local electrostatic environments; however, the mechanism isn’t fully constrained. The broad peak at 1,252 cm−1 in the amide III region increased in intensity, suggesting slightly more disorder or perturbation of the α-helical structure. However, the 1,655 cm−1 peak decreased in intensity but didn't shift, suggesting that substantial global unfolding didn't occur. These findings are interpretable in the context of BSA's solved structure: the protein adopts a predominantly α-helical fold stabilized by 17 disulfide bonds (PDB: 4OR0; Figure 2, D).
We tested fatty acid-free (FAF) BSA to confirm that the spectral changes we observed are due to structural changes in the BSA protein rather than bound fatty acids. The spectral changes we observed in FAF-BSA in response to TCEP and EDTA were consistent with those of BSA, confirming that impurities weren't responsible for the signal. We identified one exception: the peak around ~1,410 cm−1, which appeared to change with the addition of TCEP or EDTA for BSA, but not for FAF-BSA. Possibly, this feature may be influenced by fatty-acid-associated or ligand-dependent environments.
SEC analysis revealed shifts in the elution profile consistent with changes in hydrodynamic radius and oligomeric state with TCEP, EDTA, and combined treatments (Figure 2, E).
Collectively, these results demonstrate that spontaneous Raman can resolve both drastic and subtle chemically induced conformational changes in proteins in solution, capturing both covalent (disulfide reduction) and non-covalent (secondary structure disruption) perturbations in a rapid, label-free manner.
Cytochrome c
We extended the same four-condition Raman panel (Tris; TCEP; EDTA; TCEP + EDTA) to cytochrome c (cyt c), a small heme protein with intense porphyrin-dominated spectra 27. Unlike BSA, cyt c lacks disulfide bonds and contains a covalently attached heme (PDB: 1HRC), so we expected perturbations to show up most clearly in heme-sensitive stretches near ~1,500–1,650 cm−1 (porphyrin and axial-ligation environment). EDTA alone should be comparatively weak in this system, because EDTA isn't expected to chelate the heme iron, so any effect would likely be confined to surface charge and electrostatics 28.
We acquired spectra at 10 mg/mL (Figure 3) and 3 mg/mL (qualitatively similar; see supplemental figure), with SEC under the same treatments as a parallel check on elution behavior. Overall, TCEP (with or without EDTA) drove the clearest changes in the ~1,500–1,650 cm−1 window, EDTA alone showed little obvious difference, and TCEP + EDTA produced the strongest spectral departure from buffer, including features consistent with a more perturbed heme/polypeptide environment than TCEP alone (Figure 3). SEC showed modest, treatment-dependent elution shifts.
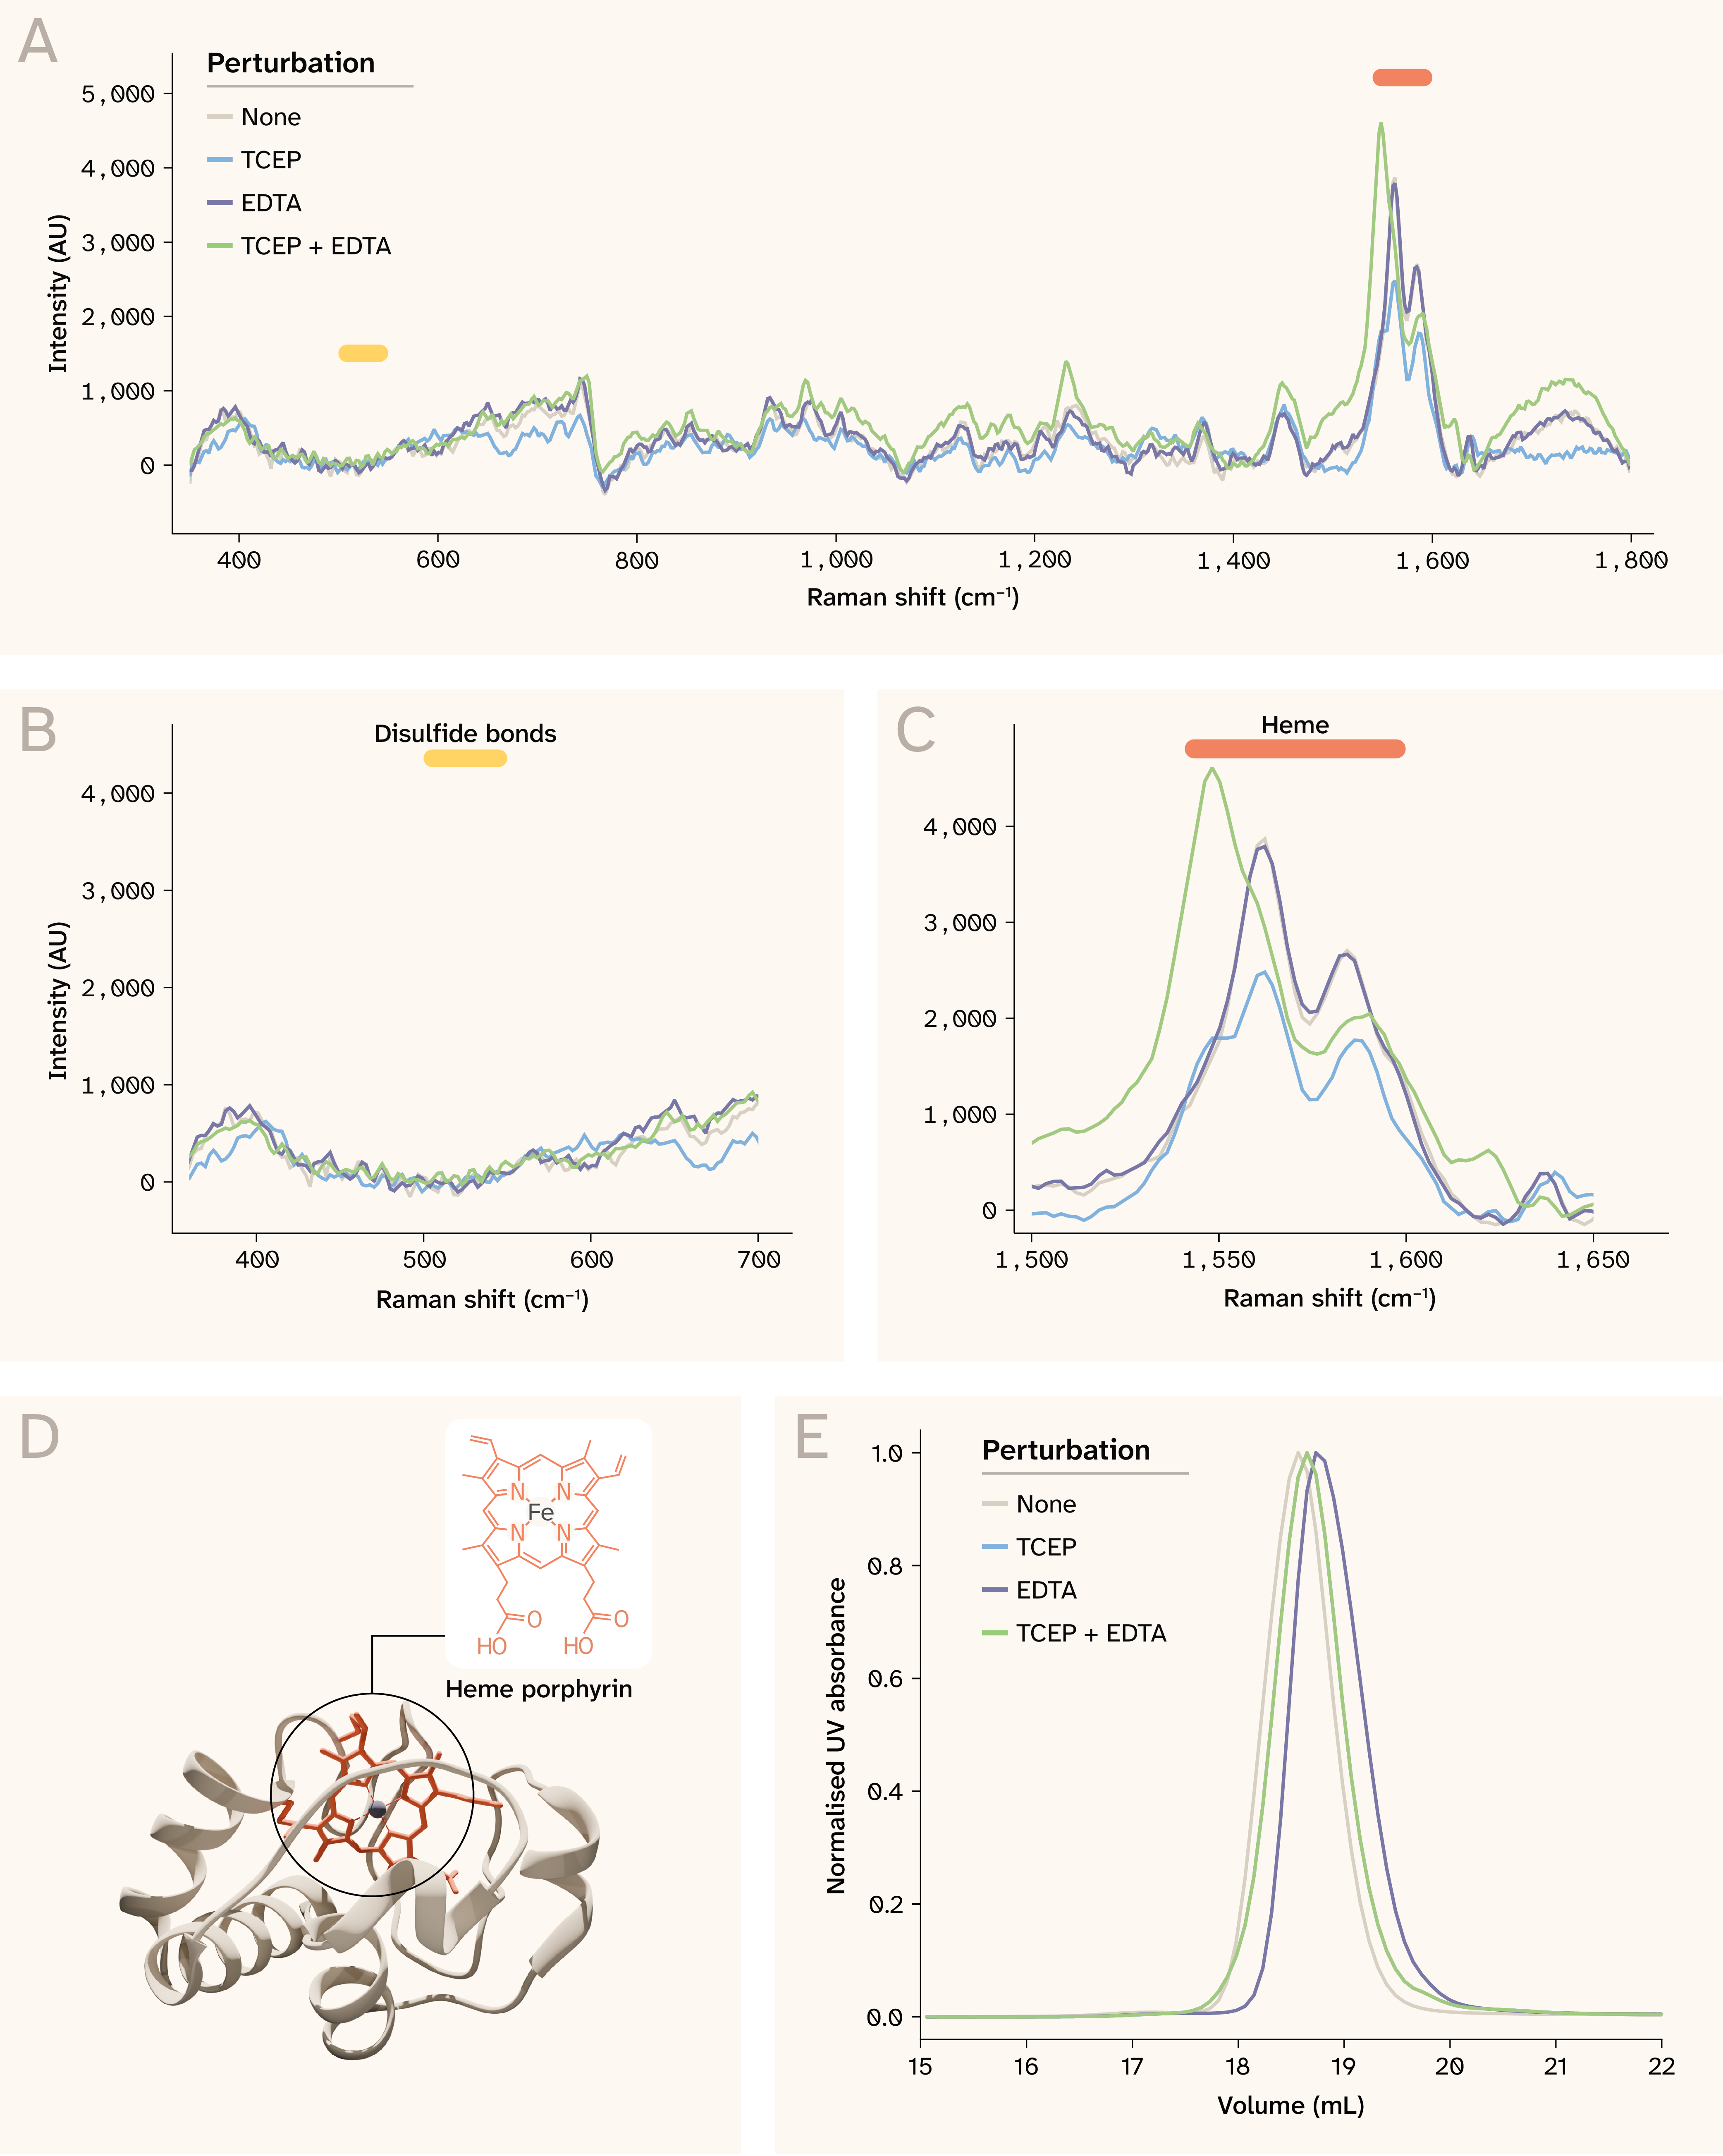
Figure 3. Spontaneous Raman resolves distinct structural features in cytochrome c and perturbations induced by TCEP alone and by TCEP with EDTA.
(A) Cytochrome c Raman spectra for each perturbation at 10 mg/mL. Click here to view an interactive version of this panel in a new tab.
(B) Perturbations don't affect the disulfide bond (S–S) stretching region (510–540 cm−1) as cyt c lacks disulfide bonds.
(C) Perturbations affect C–C stretching in the heme porphyrin ring (1540–1560 cm−1).
(D) Cytochrome c (PDB: 1HRC) is mostly helical with a covalently bound heme porphyrin ring.
(E) SEC indicates subtle structural changes in cyt c upon chemical perturbation.
In-depth analysis and interpretation
The full spectral profile (350–1,800 cm−1) is dominated by an intense band at 1,550–1,600 cm−1 arising from heme porphyrin ring vibrations, a hallmark of the resonance Raman signature of cyt c that reflects the electronic environment of the iron center 29 (Figure 3, A). As expected, there was no clear peak between 510 and 540 cm−1 that would indicate a disulfide bond, and no obvious change in spectra in this window with perturbation (Figure 3, B). Focused analysis of the 1,500–1,650 cm−1 window, encompassing both heme-associated bands and part of the amide I region, revealed condition-dependent spectral variations in peak shape and relative intensity (Figure 3, C), suggesting perturbation-induced changes in both the heme coordination environment and possibly the surrounding protein secondary structure. Specifically, we observed a new peak at ~1,548 cm−1 upon addition of TCEP, both with and without EDTA, shifts in the ~1,584 cm−1 and ~1,635 cm−1 peaks, and a decrease in the intensities of the ~1,562 and ~1,584 cm−1 peaks. When EDTA alone was added, we didn't observe any clear changes, consistent with the heme iron being tightly coordinated with the porphyrin and not accessible to chelation (Figure 3, D). When both TCEP and EDTA were added, the 1,548 peak increased in intensity, while the 1,562 and 1,584 cm−1 peaks became weaker (though still stronger than TCEP alone) and possibly shifted. Furthermore, a peak appeared at 1,231 cm−1, in the amide III region, suggesting a new non-native conformational state. These results suggest that combined perturbation enhances a non-native heme environment in cyt c, likely by more strongly perturbing the porphyrin modes. However, it's unclear why the combination yields a strong change, but EDTA alone doesn’t cause much perturbation.
SEC profiles confirmed perturbation-dependent minor changes in the hydrodynamic behavior of cyt c, which reflects conformational changes (Figure 3, E). We observed similar spectral changes in response to perturbations at a lower cyt c concentration (3 mg/mL). Together, these results demonstrate that spontaneous Raman can detect structurally meaningful spectral changes in heme proteins, capturing perturbations at the prosthetic group and possibly the polypeptide backbone level.
DNase I
We extended the same four-condition panel (Tris; TCEP; EDTA; TCEP + EDTA) to DNase I, a Ca2+-dependent endonuclease whose fold is stabilized by two calcium sites and disulfide bonds (PDB: 3DNI). We expected EDTA to yield distinct spectral changes because it removes structural Ca2+ and can reorganize the protein surface. We expected TCEP to produce modest effects by reducing disulfides, though the S–S links are surface-exposed and their reduction may perturb the fold less dramatically than BSA’s disulfide network. Spectra were acquired at 12.5 mg/mL under the same conditions used for BSA and cyt c, with SEC as a parallel readout of elution behavior.
Overall, Raman fingerprint-region differences were subtler than for BSA or cyt c across 400–1,800 cm−1, but still visible (Figure 4). However, EDTA perturbation produced the strongest relative response, particularly in the tyrosine Fermi doublet metrics and several backbone-sensitive regions. SEC showed clear, perturbation-dependent changes in elution — a useful orthogonal contrast when Raman changes are small.
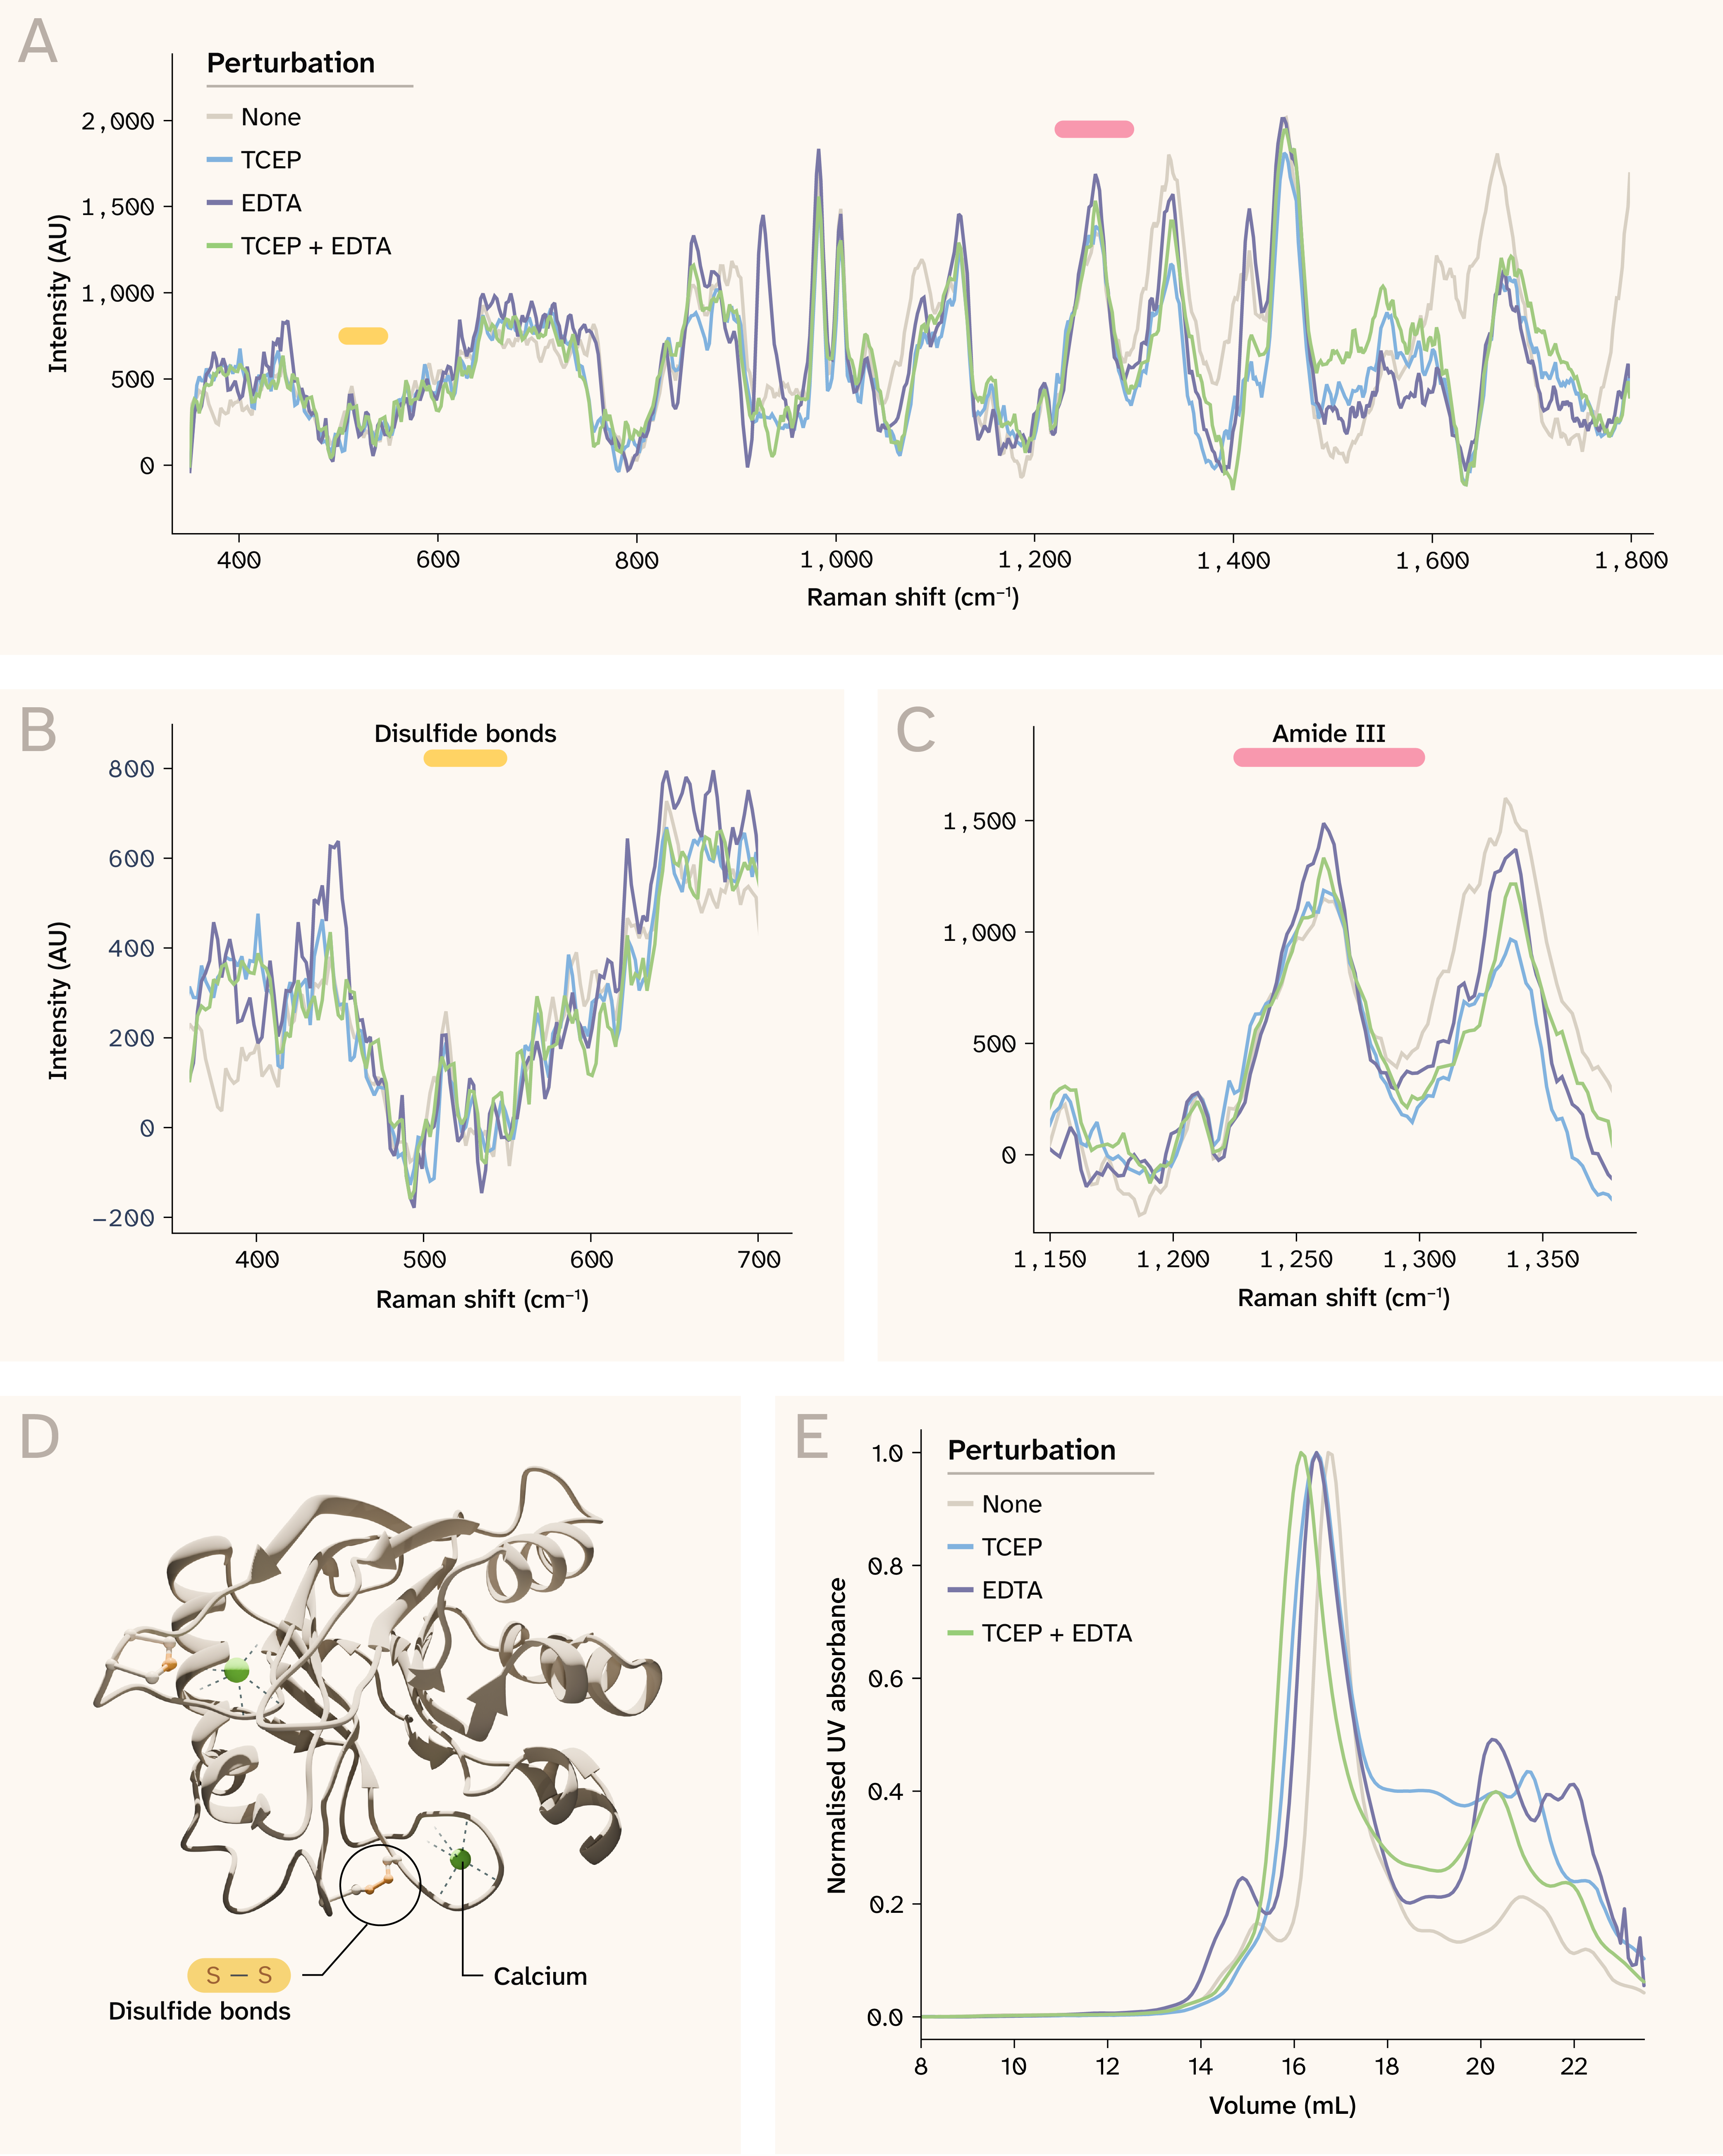
Figure 4. Spontaneous Raman spectroscopy detects subtle shifts in DNase I due to chemical perturbation.
(A) Bovine DNase I Raman spectra for each perturbation at 12.5 mg/mL. Click here to view an interactive version of this panel in a new tab.
(B) Perturbations don’t markedly affect the disulfide bond (S–S) stretching (510–540 cm−1), though there may be marginal intensity differences.
(C) Perturbations affect the amide III region (1,230–1,300 cm−1).
(D) Bovine DNase I (PDB: 3DNI) coordinates Ca2+ at two distinct sites, each stabilizing a separate surface loop. Disulfide bonds stabilize exposed loops on the surface.
(E) SEC shows variation in the elution volume of DNase I with each perturbation.
Note that axes differ across panels A–C.
In-depth analysis and interpretation
The 1,415 cm−1 peak, which may be associated with carboxylate stretching and C–H deformation modes, was slightly more intense in the EDTA condition, but not further enhanced in the TCEP + EDTA condition (Figure 4, A). The amide I peak, centered at 1,665 cm−1 in Tris, was weaker and shifted toward ~1,678 cm−1 for all perturbed conditions, suggesting backbone-level structural changes. Similarly, the 1,261 cm−1 peak in the amide III region increased in all perturbed samples, with the largest change observed in the EDTA condition (Figure 4, C). Other small changes between 900–1,620 cm−1, and a slightly lower intensity of the perturbed conditions at the 513 cm−1 S–S stretching peak, suggest broad evidence of destabilization but not of disulfide bond breakage (Figure 4, B). We also observed an intense peak at ~926 cm−1 when EDTA was present, but not when both TCEP and EDTA were present; the basis for this difference remains unclear.
This result is structurally interpretable: Bovine DNase I coordinates Ca2+ at two surface-exposed loop regions (Figure 4, D), and while chelation of these ions by EDTA is expected to impair catalytic activity 30, it only modestly disrupts the overall protein fold (Figure 4, B). Similarly, disulfide bonds in surface-exposed loop regions may slightly affect the overall structure. Importantly, however, SEC analysis revealed shifts in the elution profile of DNase I across perturbation conditions (Figure 4, E), indicating that subtle changes in hydrodynamic behavior occur — likely reflecting localized conformational rearrangements or alterations in solvation and surface exposure upon metal ion removal and disulfide bond reduction. The SEC results and modest changes in the Raman spectra are mutually confirming. This underscores the value of orthogonal validation, such as SEC, for protein structural analysis.
Additional proteins
We performed the same chemical perturbations with FAF-BSA, hemoglobin, trypsin, and immunoglobulin G (IgG). We aren’t showing the plots for these in the main text above due to the reasons summarized below, but we’ve included links to these plots as supplementary images on GitHub, along with the raw data and code to generate them.
Hemoglobin
We tested hemoglobin at 3 mg/mL (see figure) and 10 mg/mL (see figure). We observed subtle differences in the spectra at both concentrations upon adding EDTA, mainly in the C–H deformation and amide III regions. However, the addition of TCEP and EDTA dramatically increased background fluorescence to the point of detector saturation and reduced the Raman signal, making interpretation of the results difficult. SEC data suggest that adding TCEP and EDTA leads to predominantly beta-globin species (see figure).
Trypsin
We tested trypsin at 3 mg/mL (see figure) and 10 mg/mL (see figure). At 3 mg/mL, addition of TCEP and/or EDTA produced pronounced spectral changes; however, these changes weren't reproducible at the higher concentration, complicating interpretation. These results limited our ability to draw consistent structural conclusions.
IgG
We observed multiple changes in the IgG (8.6 mg/mL) spectrum upon perturbation with TCEP and EDTA (see figure); however, nearly all changes occurred near peaks corresponding to TCEP and EDTA, so we couldn't rule out their contribution to the observed signal differences. Treating IgG with TCEP and EDTA didn’t show significant structural changes by SEC.
Implications and limitations
Overall, these additional proteins highlight the limitations of our system and experimental approach. These proteins have been previously studied using Raman spectroscopy, albeit with different excitation wavelengths and preparations 27, 31–33. In our experiments, FAF-BSA confirmed that structural signals in BSA are protein-intrinsic, but hemoglobin, trypsin, and IgG each presented distinct technical challenges that prevented clear structural interpretation. We couldn't determine whether and how the chemical perturbations led to changes that, in turn, generated high fluorescence or inconsistent results at different concentrations. This underscores the need for careful optimization for chemical perturbations on a per-protein basis.
Raman spectroscopy can detect BSA structural changes in response to pH modulation
We also monitored the Raman spectral features of BSA across a wide pH range to track changes in protein structure and side-chain environments with and without 10 mM TCEP. We expected to see pH-dependent transitions in amide and side-chain bands and a distinct response pattern when disulfide bonds were reduced in the presence of TCEP 34.
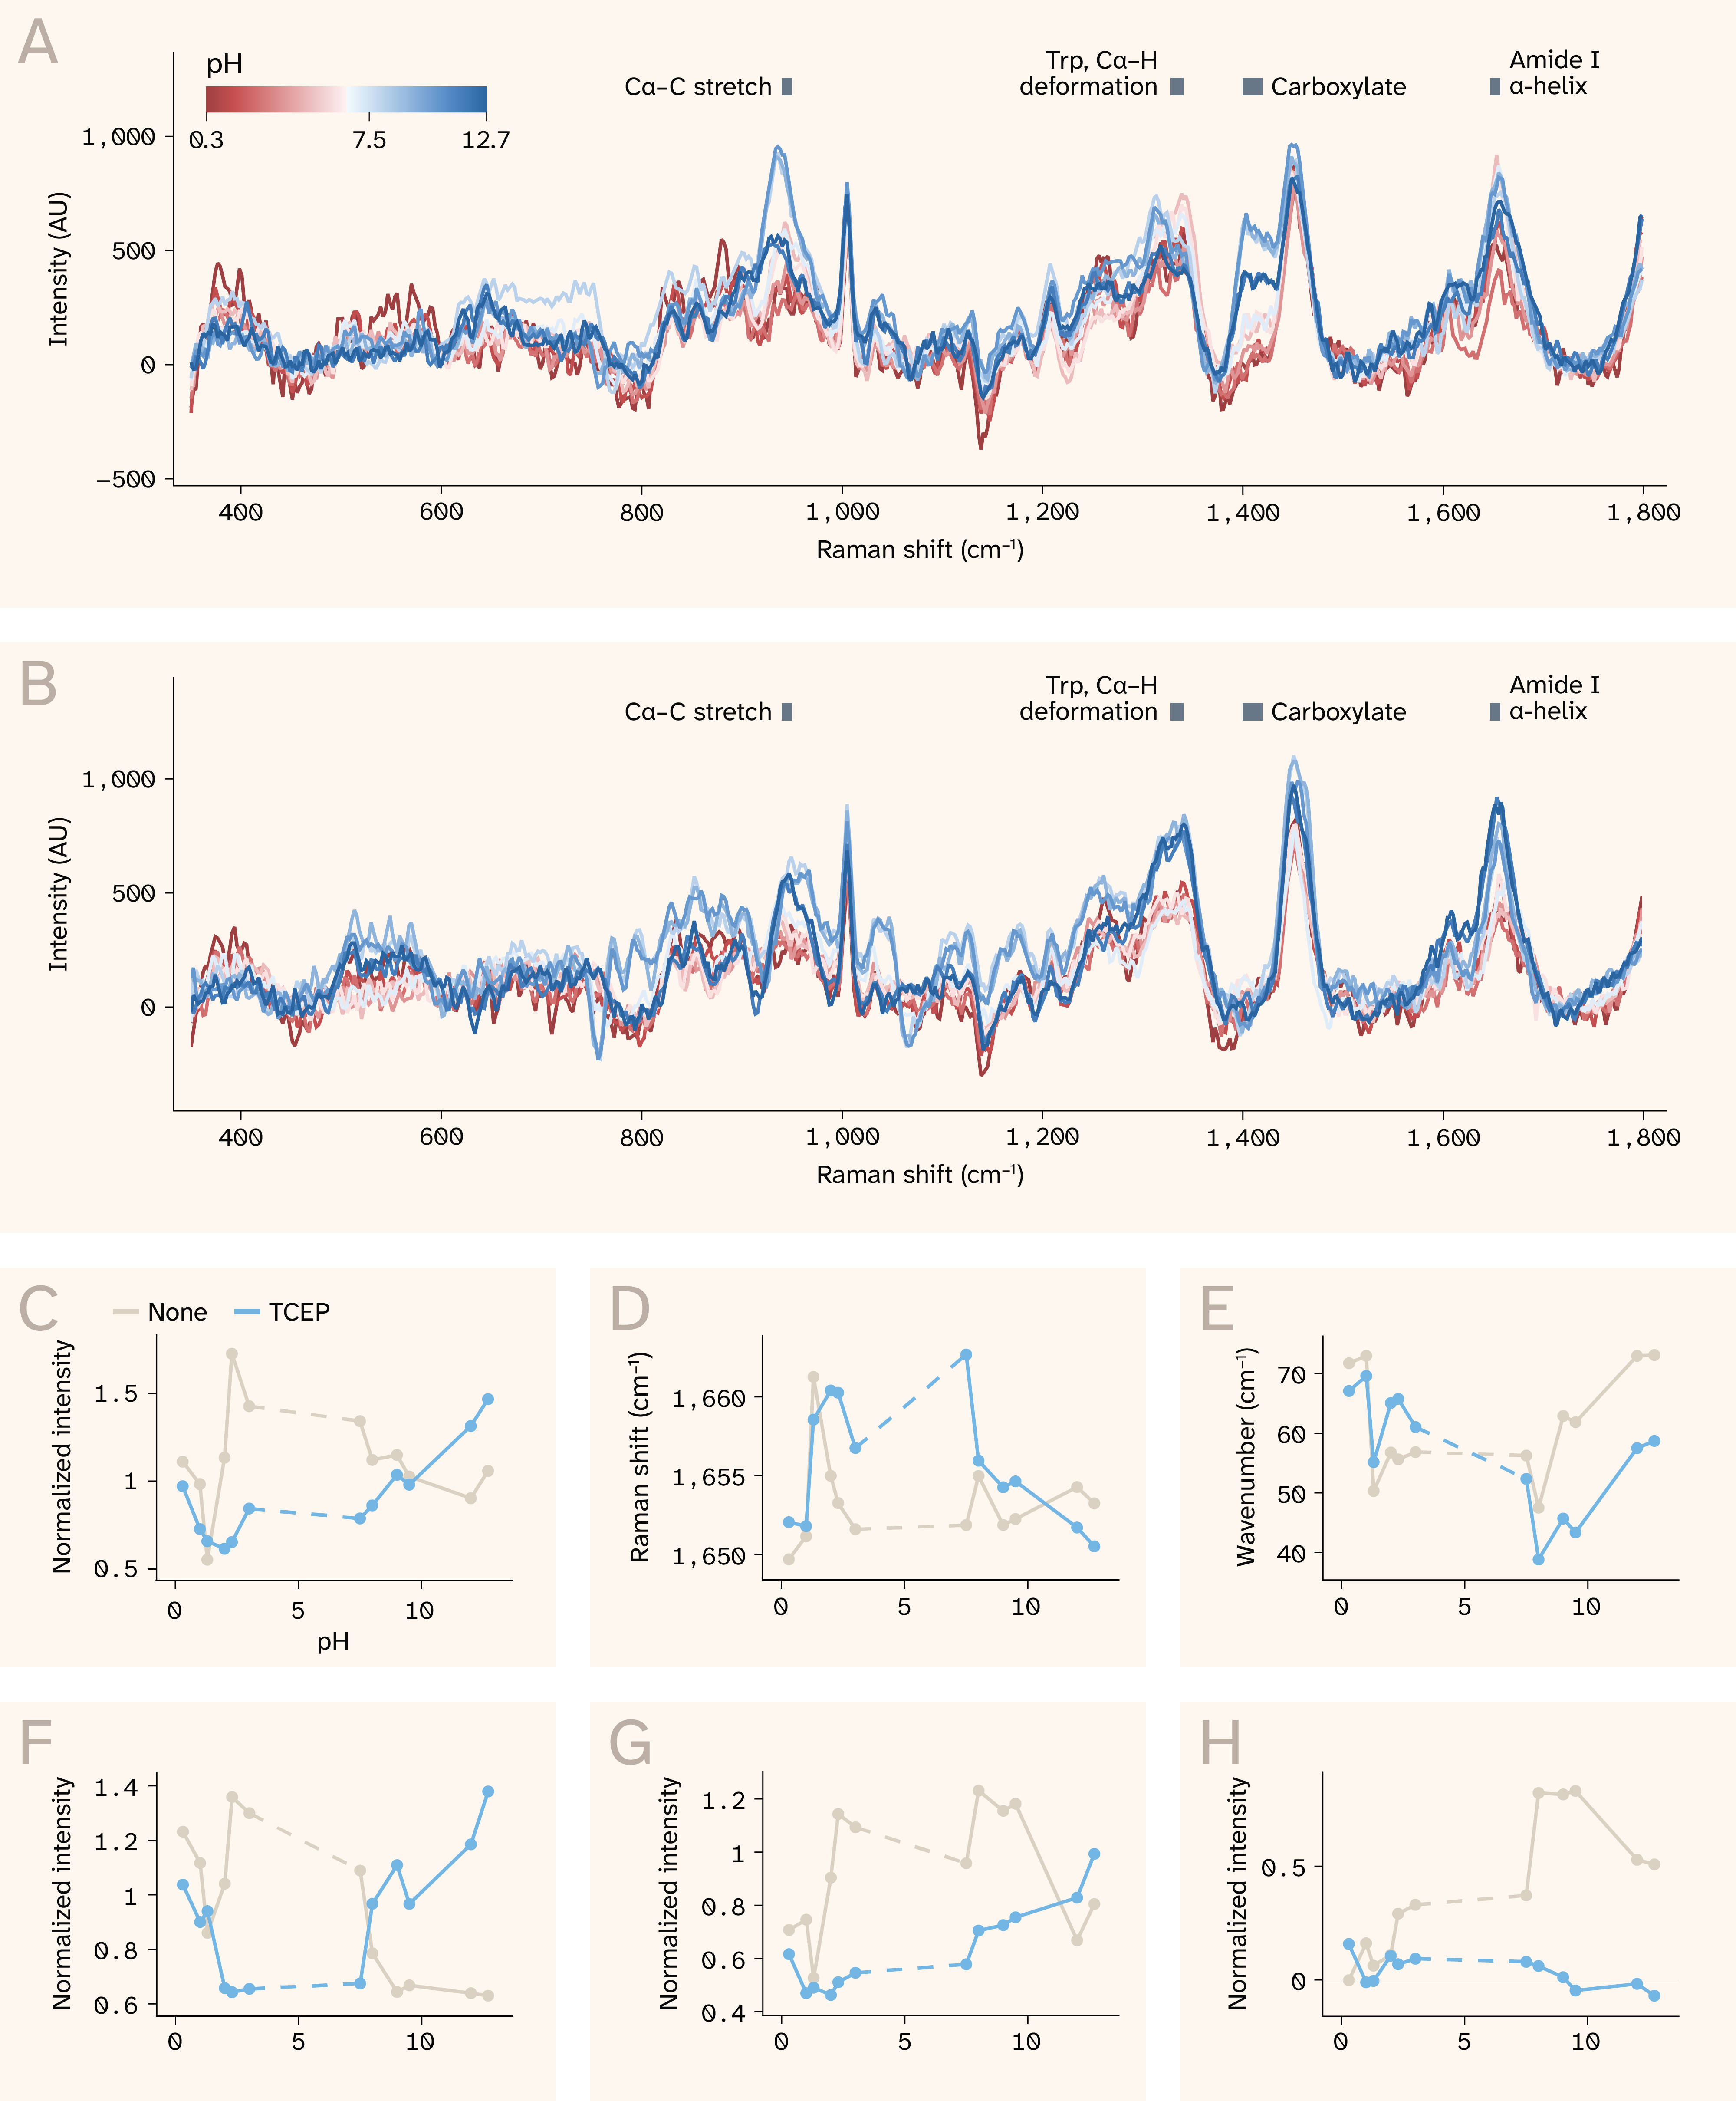
Figure 5. pH and TCEP impact BSA secondary structure, as reflected in Raman spectral features.
(A) BSA and (B) BSA with TCEP across a range of pH conditions between 0.3 and 12.7.
Gray bars mark regions related to secondary structure.
Click to view an interactive version of panel A (without TCEP) or panel B (with TCEP) in a new tab.
(C–E) Amide I structural features: (C) amide I peak intensity, (D) amide I peak center, (E) amide I peak width, measured via full width at half maximum (FWHM). The dashed line indicates that the pH between 3 and 7.5 was unstable and we didn’t include these data.
(F) 1,341 cm−1 peak intensity, corresponding to a mix of C–H deformation modes.
(G) 945 cm−1 peak intensity corresponding to the Cα–C stretching mode and possibly backbone stretching vibrations of the protein α-helix structure.
(H) 1,412 cm−1 peak intensity corresponding to carboxylate symmetric stretching and possibly C–H deformation modes.
Panels C and F–H show peak intensities normalized to phenylalanine ring breathing mode (1,002 cm−1). Note that axes differ across panels C–H.
Across the nominal pH panel, BSA Raman spectra changed with pH with and without TCEP (Figure 5, A–B), but TCEP altered which regions of the spectrum responded, as well as the overall diversity of signals. In Figure 5, panels A–B show spectra at selected, stable pH values (as noted in “The approach”).
In BSA spectra collected across pH without TCEP, the most prominent differences appeared at 1,320 and 1,340 cm−1, in the 1,390–1,440 cm−1 region, and around 935–970 cm−1, with comparatively modest changes in the tyrosine doublet ratio (Figure 5, A). In contrast, when TCEP was present, there was greater similarity between spectra across pH conditions, though visible differences remained. The most prominent differences were between 1,300–1,350 cm−1, around 1,450 cm−1, and in the amide I region (Figure 5, B).
The amide I region showed observable differences for BSA, with and without TCEP. At neutral pH without TCEP, there was a prominent peak at ~1,655 cm−1 , which persisted between pH 3 and 9.5. Above and below these points, the peak decreased in intensity (Figure 5, C), shifted to higher wavenumbers (Figure 5, D), and broadened slightly (Figure 5, E). When TCEP was present at neutral pH, the amide I peak was centered at 1,663 cm−1, and followed a similar general trend for the acidic values as without TCEP. Interestingly, for alkaline conditions, the amide I peak became more intense, narrower, and shifted to ~1,655 cm−1. Given that TCEP may have limited activity at very high pH 35, it's possible that it doesn’t effectively reduce disulfide bonds at pH 12 and beyond. However, it’s surprising that the high pH itself doesn't match the non-TCEP amide I alteration.
The 1,341 cm−1 peak, attributed to a mix of C–H deformation modes, shows a similar decrease in intensity in acidic and alkaline pH conditions without TCEP (Figure 5, F). However, when TCEP is present, there's clearly a different pattern. The spectra from all acidic conditions look similar to that of pH 7.5, whereas all alkaline conditions exhibit a more intense 1,341 cm−1 peak.
At near-neutral pH, BSA showed a strong peak at ~945 cm−1. At pH 2 and below, this peak visibly decreased in intensity. However, it increased in intensity at pH 8–9.5, then decreased at pH 12 and beyond (Figure 5, G). This peak region corresponds to backbone skeletal C–C/N–C–C stretching modes, associated with the α-helix structure. The pattern of intensity changes suggests that at pH extremes, the native folded state is significantly disrupted. When TCEP was present, this peak was generally weaker and shifted across conditions: it was most intense near neutral pH (~960 cm−1), weak or absent under acidic conditions, and modest in alkaline conditions (~945 cm−1).
The carboxylate-associated region around ~1,412 cm−1, showed a clear decrease in intensity at lower pH and an increase at higher pH without TCEP (Figure 5, H). However, this entire region didn’t show notable peaks when TCEP was added, suggesting that the reagent impacts interactions with acidic side chains and possibly other C–H deformation modes that may contribute in this region.
Together, these results suggest that disulfide reduction alters electrostatic interactions and the conformational ensemble of BSA in a pH-dependent manner, leading to distinct Raman responses not observed in the intact protein. However, limitations in the experimental design prevent strong conclusions about the pH–structure relationship. The unbuffered solutions may have had pH drift over the course of the experiment, and we can't rule out the possibility that Tris buffering for the close-to-neutral solutions may have altered the chemical environment.
Key takeaways
Spontaneous Raman spectroscopy can detect protein structural changes (e.g., disulfide reduction, pH-induced unfolding) in solution, label-free.
Specifically, we saw:
- BSA and cytochrome c: Chemical perturbation (TCEP, EDTA) and, for BSA, pH, produced spectral changes generally consistent with known structure; SEC confirmed the same trends.
- DNase I: Raman captured subtle shifts across conditions while SEC showed perturbation-dependent shifts, illustrating the value of SEC as an orthogonal check.
- Other proteins: Hemoglobin, trypsin, and IgG had less interpretable or preliminary outcomes (see “Additional proteins”).
Discussion and significance
In this work, we applied spontaneous near-infrared (NIR) Raman spectroscopy across multiple protein classes — including heme proteins, enzymes, and an antibody — and benchmarked its performance against size-exclusion chromatography (SEC) as a gold-standard reference for protein behavior in solution. By systematically perturbing proteins through reduction, chelation, and pH modulation, we examined how distinct chemical mechanisms propagate through protein structure and manifest in specific Raman spectral markers. Our results demonstrate that NIR Raman can resolve both large-scale structural disruptions, as observed for BSA, and subtler, mechanism-dependent perturbations, as seen in DNase I and cyt c, each with characteristic spectral signatures. Comparison with SEC further reveals that Raman reports on structural changes that complement aggregation-based readouts, offering an orthogonal window into solution-phase protein behavior.
These findings come with important caveats that could point to future research directions. As previously mentioned, we didn't perform replicate measurements, as the goal of our study was to gain a preliminary mechanistic understanding of perturbation detection. As such, we can only provide qualitative interpretations. Also, we assigned Raman bands based on established literature, but these are approximate because we didn't fit or deconvolve the peaks. We didn’t fully resolve conflicting results for some proteins, such as trypsin, by repeating the experiment or by performing a dilution series. To maintain consistency across the study, we didn’t switch to other reagents when their spectra overlapped with the protein, as was the case for IgG. We also didn’t test other excitation wavelengths that may have been able to overcome fluorescence interference, as our focus was on NIR Raman. Finally, chemical perturbations may introduce multiple simultaneous effects, such as changes in redox state and electrostatics, complicating the direct mechanistic attribution.
Together, this work establishes a preliminary mechanistic framework linking chemical perturbation to Raman spectral responses while clearly delineating the approach's boundaries. Advancing NIR Raman as a label-free tool for monitoring protein structure and stability in solution will require continued development of strategies to address fluorescence interference and system-specific complexity.
Next steps — please weigh in!
We plan to broaden benchmarking of 785 nm spontaneous Raman against standard protein analytical tools, including SEC, dynamic light scattering (DLS), and circular dichroism (CD), to identify strengths and weaknesses as well as useful tool combinations. We're also interested in evaluating specific use cases for Raman spectroscopy in protein biochemistry. For instance, we're interested in investigating whether Raman can be used as an early predictor of protein destabilization or structural changes in solution. This would be useful for biologic screening, to anticipate aggregation, complete unfolding, or loss of function.
We'd also like to get your feedback! If you’re applying related methods in your own lab, we’d appreciate concrete suggestions for protein–perturbation combinations you think would be a fair stress test for this platform. What tools do you think might be interesting to benchmark against, or use in combination with Raman?
Be the first to comment on this publication.