Purpose
Structural biology increasingly relies on machine learning-based structure predictors, enabling accurate atomic-level structure prediction at scale. However, predicting conformational ensembles rather than single structures remains a fundamental challenge. These predictors are trained on static PDB structures that are themselves imperfect representations of the underlying experiments. X-ray crystallography and cryo-EM measure ensemble-averaged signals over many molecular conformations, yet this heterogeneity is compressed into a single set of coordinates. Recent inference-time guidance methods offer a promising path forward by steering structure predictors toward agreement with experimental data, including ensembles. However, existing approaches are bespoke to specific models, making systematic comparison across predictors, guidance strategies, and loss functions difficult. Here, we present sampleworks, a modular framework for generating and evaluating biomolecular conformational ensembles from structure predictors guided by experimental data. As an initial benchmark, we asked whether three current structure predictors, Boltz-2, Protenix, and RosettaFold3, can recover experimentally supported alternative conformations when guided by simulated, noise-free electron density maps. We assembled a dataset of 791 segments from 40 high-resolution PDB entries, which have multiple physically plausible and experimentally supported conformations, but which are absent from structure predictor training data. Without guidance, predicted baseline ensembles were strongly biased toward whichever conformation dominates the training set. Density guidance substantially improved the ability to capture multiple states, but still retained biases that reflect the training set conformational distribution. Together, these results show that current structure predictors can be steered toward experimental data but do not yet reliably generalize to physically plausible ensembles. sampleworks provides a platform for diagnosing these limitations and developing ensemble-aware structure predictors that better reflect the heterogeneous data measured by structural biology data.
Introduction
Structural biology increasingly relies on machine learning-based structure predictors 1–4. While highly successful in enhancing the access to and prevalence of structure-informed biological study, structure predictors are starting to plateau in their performance (OpenFold3 Team 2026). Emerging predictors are nearly indistinguishable from one another in monomeric structure prediction performance, but generalization to related tasks, such as protein-ligand co-folding of novel and allosteric ligands, antibody docking, predicting the structural effects of mutations, and prediction of conformational ensembles remains challenging particularly in open models 2, 5–8.
Structure predictors are trained on and evaluated against static structural models from the Protein Data Bank (PDB). These "ground truth" structural models are refined for agreement with experimental data. However, the "ground truth" structures used to benchmark and train these models are themselves imperfect representations of the underlying experiments 9–11. Experimental structural biology data used to refine these models, including X-ray crystallography and cryo-EM, reflect an ensemble-averaged signal over thousands to millions of conformations. Compressing this rich, heterogeneous experimental data into a static structure leaves an approximated representation of the underlying data that is full of artifacts such as strain caused by inappropriate modeling of multistate conformations into a single set of coordinates 12.
The mismatch between structural models and their underlying data is also evident in cross-validation statistics such as the R-free, which indicate, across the PDB, a residual disagreement of ~20% between the experimental data and the structural models 10, 13. This residual is primarily due to the inherent limitation of using a single static structure to explain data derived from ensembles, rather than experimental error. Therefore the "ground truth" training targets for structure predictors are themselves incomplete representations of the experimental data.
Recognizing the limitations of static representations of macromolecules, there has been a push to explore how structure predictors can be used to model conformational ensembles. Multiple approaches have manipulated the multiple sequence alignment (MSA) and its processed representations to generate structural diversity in predictions 14–16. These approaches remain limited by the relatively small set of deposited structures with multiple conformations, and do not successfully generalize outside the training data 17. New models, such as BioEmu and AlphaFlow, are emerging specifically to generate ensembles, usually by training on and comparing with molecular dynamics (MD) data 18–20. Boltz-2 4, one of the most recent structure predictors, was also fine-tuned on MD simulations. However, this strategy may also be limited, as molecular dynamics simulations are constrained by the accuracy of their force fields, often by their timescales, and in the diversity of the training dataset 21–23.
Structure predictors were originally useful beyond just prediction as templates for atomic model building and refinement. Placing structure predictors in an iterative loop with experimental data has proven useful for accelerating atomic model building and improving the quality of structure predictions 24. One path to advance this idea is to take advantage of modern structure predictors' ability to sample from their learned distribution of conformations. By treating structure predictors as conformational samplers, one can then apply inference-time guidance (sometimes referred to as "scaling" or "steering") to improve agreement with experimental data. Inference-time guidance methods have been applied to both single structures 25–28 and, more recently, ensembles 29–30. These methods demonstrate improved fit to experimental data over baseline (unguided) structure predictions and recover conformations that were mispredicted without experimental data guidance. However, the methods have so far been bespoke to specific structural predictors and forms of guidance. For example, ROCKET 28, which uses the older, deterministic Alphafold 2 model, adds an adapter to the MSA features that is optimized to fit cryoEM density maps and intensities from crystallography experiments. CryoBoltz 26 uses diffusion guidance with Boltz-1 and cryoEM density maps, CrystalBoltz 31 guides Boltz-2 with crystallographic structure factors, and EmbedOpt 27 guides the sequence embeddings of Protenix using either cryoEM density maps and pairwise distance restraints from NMR experiments. The goal of these methods is to fit a single structure and therefore automate the modeling procedure to produce an output similar to the training set. An extension of the melding of structure predictors and experimental data is to generate ensemble models that fit the data better than a single structure. Work from the Bronstein group has shown how real-space crystallographic density maps can be used to guide Protenix to generate ensembles of conformations, and a more recent extension of this method adds guidance to the diffusion conditioning rather than the coordinates 30. However, none of the methods discussed here currently achieve significant improvement in the fit to experimental data over the PDB-deposited single structures, and each tests on non-overlapping sets of selected examples. Given this lack of a comprehensive evaluation set and the combinatorial search space over sampling algorithms, structure predictors, and types of inference-time intervention, the field needs a framework that enables systematic evaluation of how different structure predictors perform, how experimental data can best be utilized in combination with these models, and which guidance methods best harmonize predictive methods and experiments.
We built sampleworks to address this need for a systematic framework (GitHub). sampleworks makes it easy to implement and test new structure predictors and guidance methods with multiple forms of experimental data. It provides abstractions for modular combinations of structure predictors, inference-time steering methods, and loss functions. This platform will be useful for evaluation of structure predictors against experimental data and exploration of the design space for ensemble generation using inference-time steering. sampleworks also includes evaluation infrastructure for parallel comparisons of structure predictors and guidance methods using metrics for ensemble quality and agreement with experimental data.
We initially set out to evaluate structure predictors when guided with real experimental data. However, we quickly noticed interesting limitations even on synthetic data. Therefore, our first evaluation using sampleworks asks whether structure predictors can recover multiple conformations present in experimental data when guided with simulated and noise-free density maps. Several methods exist for modeling conformational ensembles from experimental data 9, 12, 32–36. In general, the alternative conformations modeled by these approaches are excluded from the training set of all publicly available structure predictors, with only the primary conformation used in training. With few exceptions, such as models fine-tuned on MD data 4, 18, 20, structure predictors are only exposed to alternative conformations when there are multiple distinct PDB depositions for the same sequence adopting distinct conformations. Therefore, the set of protein segments with alternative conformations modeled within a single PDB deposition is distinct from the set of protein segments with distinct conformations across multiple PDB depositions. This distinction creates a benchmarking opportunity where experimentally supported alternative conformations that originate from a single PDB deposition are "in distribution" in a physical sense but "out of training set" in a data sense, allowing us to probe whether these models have learned any genuine physical energy landscapes or are simply memorizing training examples. If structure predictors have internalized physics, they should be capable of recovering nearly iso-energetic alternative conformations even in the absence of an explicit training signal, especially when guided by experimental data.
We tested whether structure predictors can sample alternative conformations when guided by density maps describing distinct conformational states using sampleworks. Our results indicate a complex picture. While guiding different structure predictors can improve the fit to the synthetic map relative to sampling without guidance, the predictions remain biased towards the conformations in the training set. This bias occurs even when both conformers are nearly isoenergetic (that is, the experimentally determined occupancy of the two states is similar). We also discovered that the structure predictors we test, which vary only slightly in architecture and training strategy, perform differently when guided. Based on the differences between structure predictors that we can now detect at scale using sampleworks, we suggest directions to explore for improving performance and generalization. In addition to comparing structure predictors at scale, the sampleworks framework will allow us to increase the agreement of ensemble models with experimental data and accelerate development of improved, ensemble-aware generative models of biomolecular structure and dynamics.
Results
sampleworks is a plug-and-play platform for biomolecular structure predictors to interface with experimental data and guidance methods
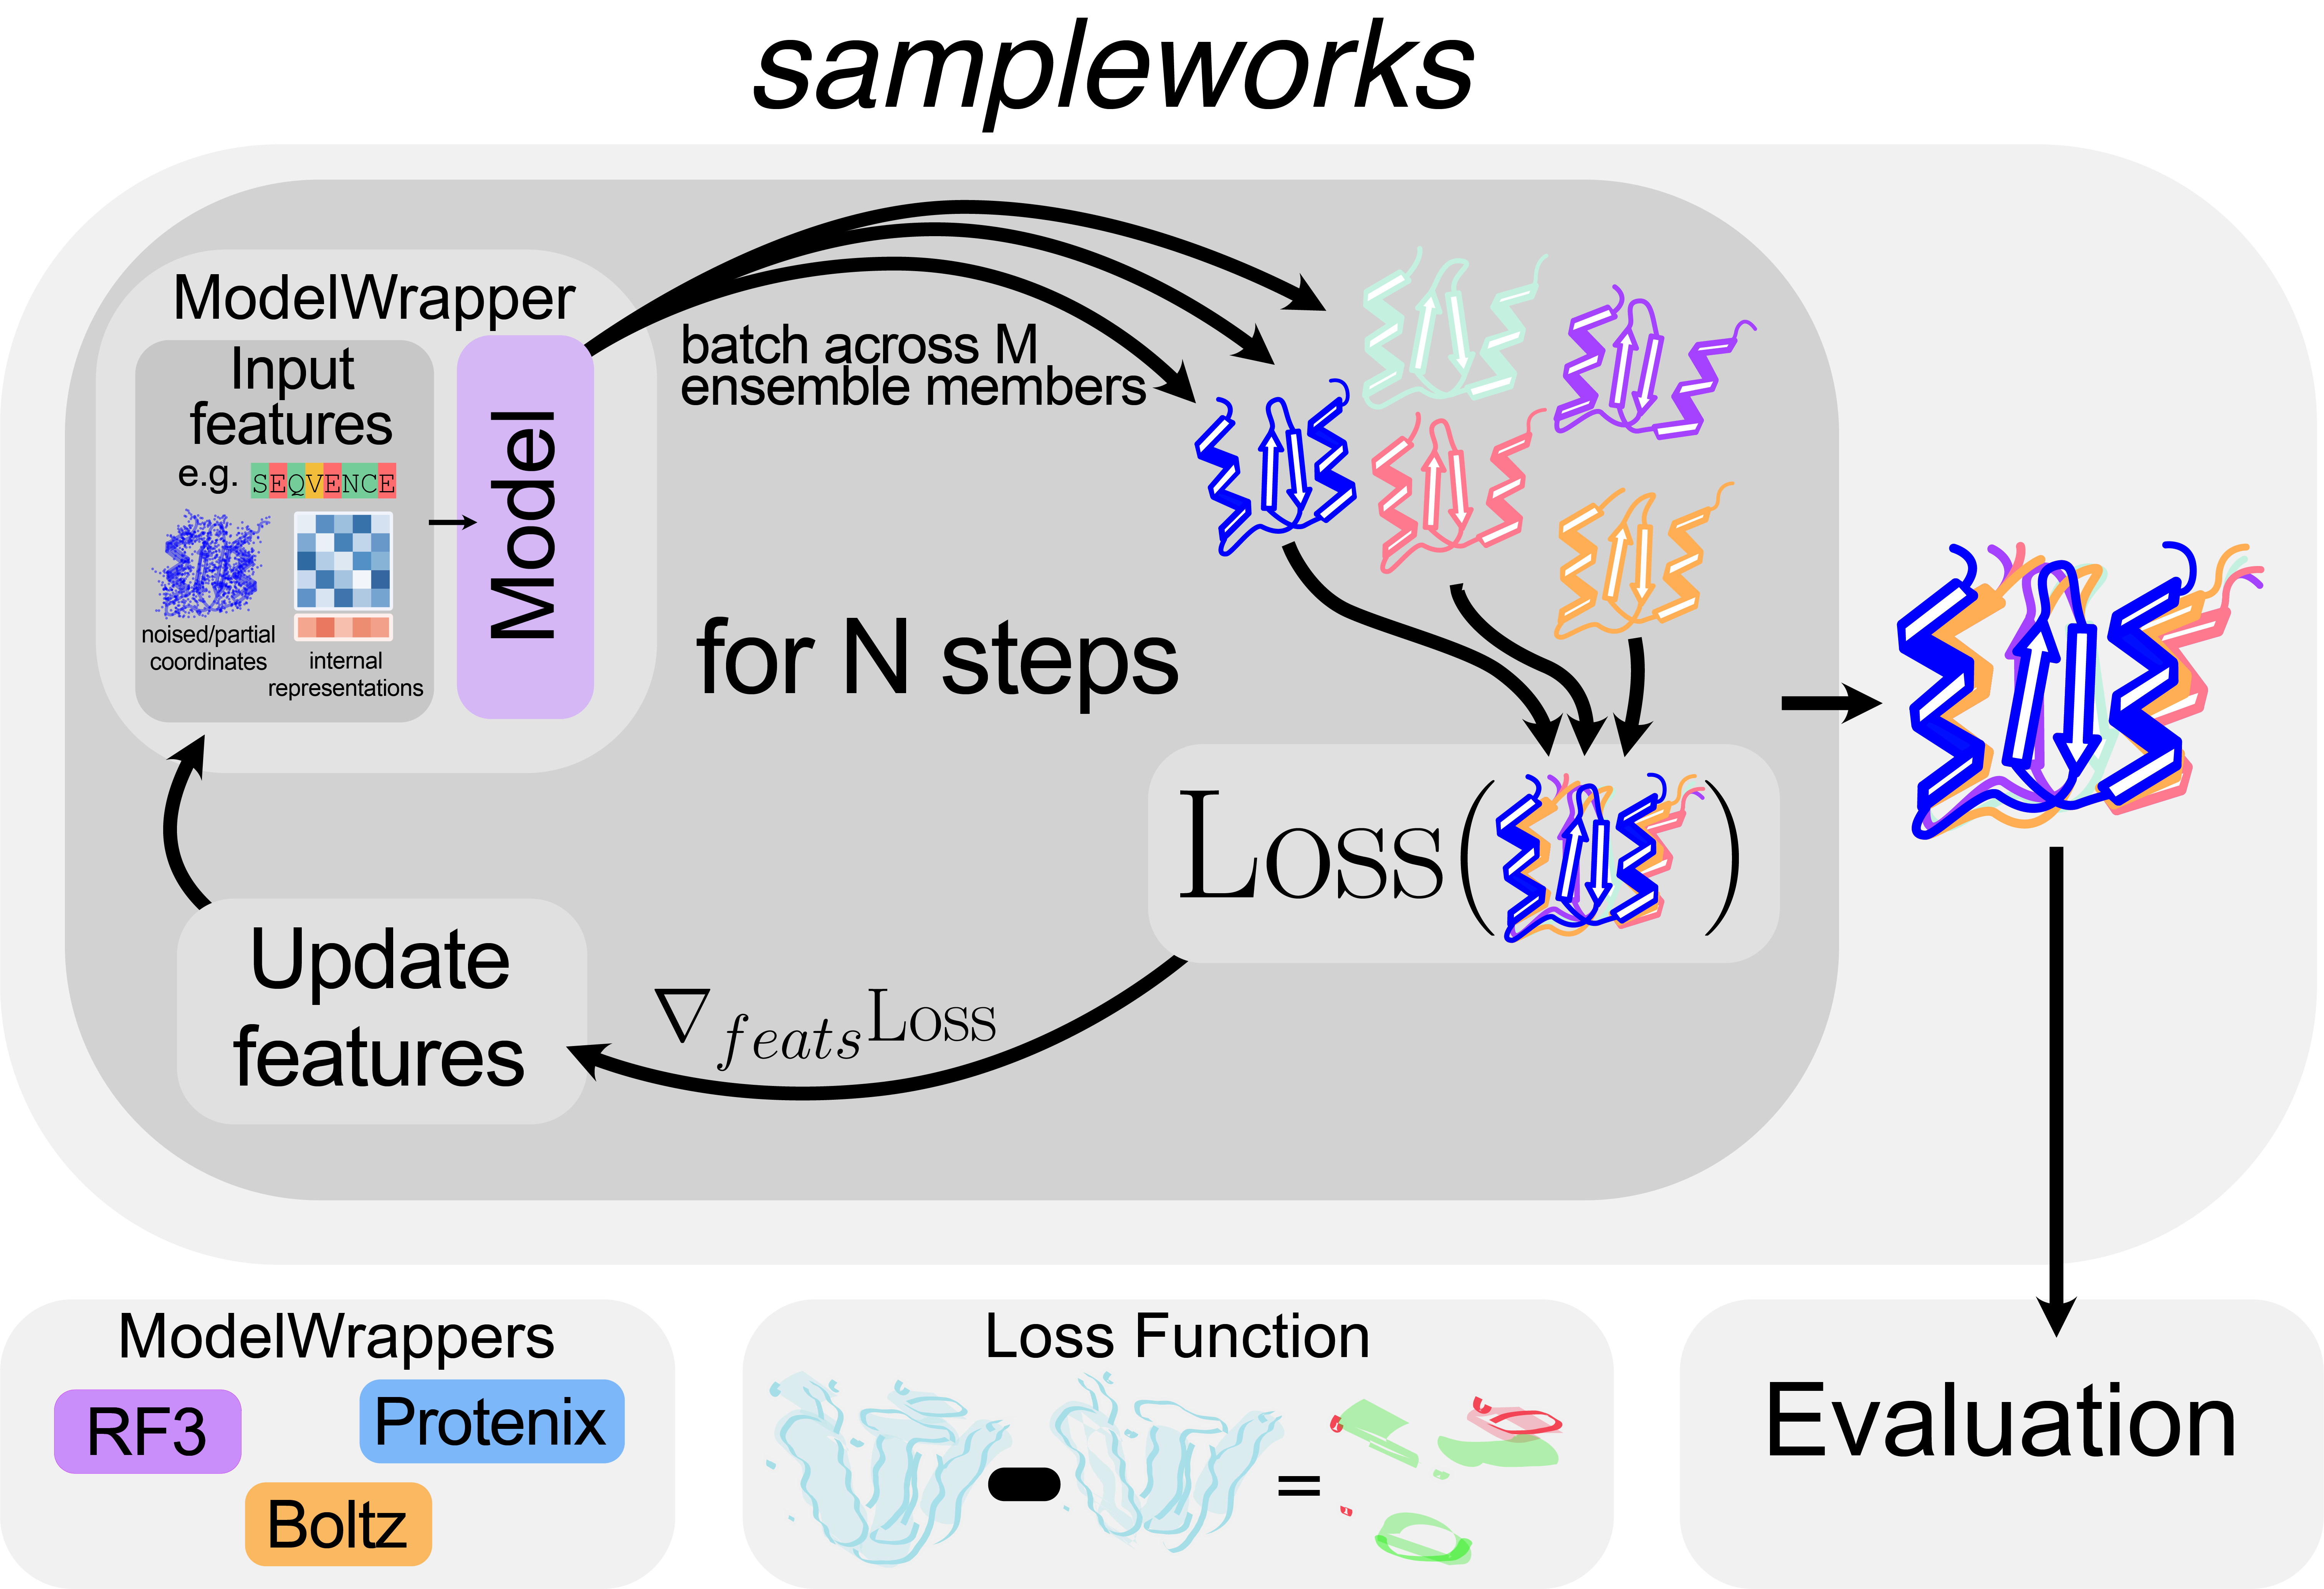
Figure 1. FIGURE 1: sampleworks provides a unified interface for generating ensembles from structure predictors using guidance with experimental data.
sampleworks has four core abstractions areas: structure predictors (ModelWrappers), experimental data (LossFunctions), algorithms for generating ensembles from a structure predictor (Samplers), and guidance/steering methods (Scalers). A ModelWrapper interface (currently implemented for RF3, Protenix, and Boltz) enables a structure predictor to generate ensembles in an iterative loop that steers it towards fitting experimental observations (using a Loss Function) at inference time.
A growing body of methods now exists for augmenting structure predictors with experimental data 26–31, 37–40. These methods demonstrate improved fit between structure predictors and experimental data for select examples. However, integrating each approach to evaluate how they perform at scale carries substantial engineering overhead. Structure predictors differ considerably in their dependencies and architectures, making them difficult to swap or compare alongside different guidance and/or loss functions. Furthermore, these methods have the potential to generate multiple conformations as an ensemble that could better explain the heterogeneity in experimental data 35, 41–42. To overcome both the development burden and natively support ensemble generation/evaluation, we developed sampleworks, a modular framework that abstracts the core components of the guidance pipeline needed to augment structure predictors with experimental data. This framework reduces the effort required to add a new structure predictor (Model) or guidance method and directly integrates with an ensemble generation and validation pipeline.
We organize sampleworks using four core abstractions for structure prediction algorithms (ModelWrappers), experimental data (LossFunctions), algorithms for generating ensembles from a model (Samplers), and guidance/steering methods (Scalers). ModelWrappers abstract each structure predictor’s internals behind a common API by exposing a featurize method for generating inputs from an Atomworks dictionary 43 and a step method to predict coordinates from input features, regardless of the underlying architecture. Current implementations include several structure predictors that replicate the Alphafold3 architecture: Boltz-2, Protenix, and RosettaFold3 3–4, 43. Implementation of new ModelWrappers only requires satisfying the contracts required by the featurize and step methods (see sampleworks Design Document located in the Github Repository). LossFunctions consume the output of a ModelWrapper's step method and return a value measuring how well the predicted ensemble agrees with experimental observables. Current implementations operate in real-space electron density, though the modular design allows adding any loss function with a differentiable relationship between the ensemble and the experimental data. Samplers and Scalers define how ModelWrappers and LossFunctions are coupled during inference. Samplers drive iterative refinement of the ensemble. For diffusion models, this iterative refinement means computing the denoising trajectory. Scalers modify this refinement to minimize a specified LossFunction using different guidance strategies and strengths. Current Scaler implementations include diffusion posterior sampling 25, 29, 44 and Feynman-Kaç steering 45–46. sampleworks is flexible enough to support arbitrary guidance and optimization strategies, including those that are not flow/diffusion based. The Samplers and Scalers can be used to define arbitrary optimization loops to minimize a LossFunction, whether the target is the noisy coordinates in diffusion guidance or upstream representations for direct optimization in the latent space.
The modularization in sampleworks allows users to freely mix and match components. Users can benchmark different structure predictors against the same experimental loss, or hold the algorithm fixed while sweeping across guidance methods and hyperparameters. Collectively, this architecture makes sampleworks a powerful testbed for exploring how well current structure predictors perform at generating conformational ensembles consistent with ensemble-averaged experimental measurements.
A dataset of 40 PDB entries with 791 alternative location segments to validate ensemble generation
To measure how well structure predictors (Boltz-2, Protenix, RF3) can recover experimentally supported protein conformational ensembles, we first collected 40 high-resolution deposited PDB entries that contain alternative conformations supported by the underlying experimental data. All structures in the dataset were solved by X-ray crystallography, 37/40 have 1.5 Å or better resolution, and most were deposited before the training cutoff of the structure predictor (see Dataset). All alternative conformations were encoded using alternative locations or "altlocs" as multiconfomer models and not as an "muticopy ensemble" using the MODEL/ENDMDL encoding 47–48. All current structure prediction training datasets remove altlocs 2, 49 1, 4, 43, meaning that the conformations described by altlocs are not in the training set. This makes them physically "in distribution" but "out of training set", and a useful evaluation set to test how well structure predictors can recapitulate known ensembles. An exception is when conformations of similar or identical sequences that match the altloc conformations from a single PDB have been separately deposited between two PDBs. For instance, when a bound small molecule traps a protein in one of the deposited apo altlocs.
Each individual segment containing altlocs serves as a target for structure prediction (n=791 across the 40 entries). Some altloc-containing segments model alternative conformations of multiple continuous residues (n=724), some represent only side chain alternate conformations (n=66), and one contains a whole 98 residue domain altloc. One case in our dataset (5SOP) contains an altloc that appears with a low affinity fragment bound. We use this to test the ability of predictors to recover that altloc without the fragment. We use this single example to evaluate whether the structure predictors might be capable of sampling a cryptic pocket when guided. All other structures represent the apo state and the alternative conformations are presumably free of any bias from a binding partner or ligand. For each segment, we compute a synthetic map at 1 Å resolution, using a B-factor of 20 for each heavy atom and equal occupancy between first two altlocs in the deposited PDB model, and use the resulting density map to guide and evaluate the multi-copy ensembles it outputs.
Without guidance, structure predictors are strongly biased to conformations in the training set
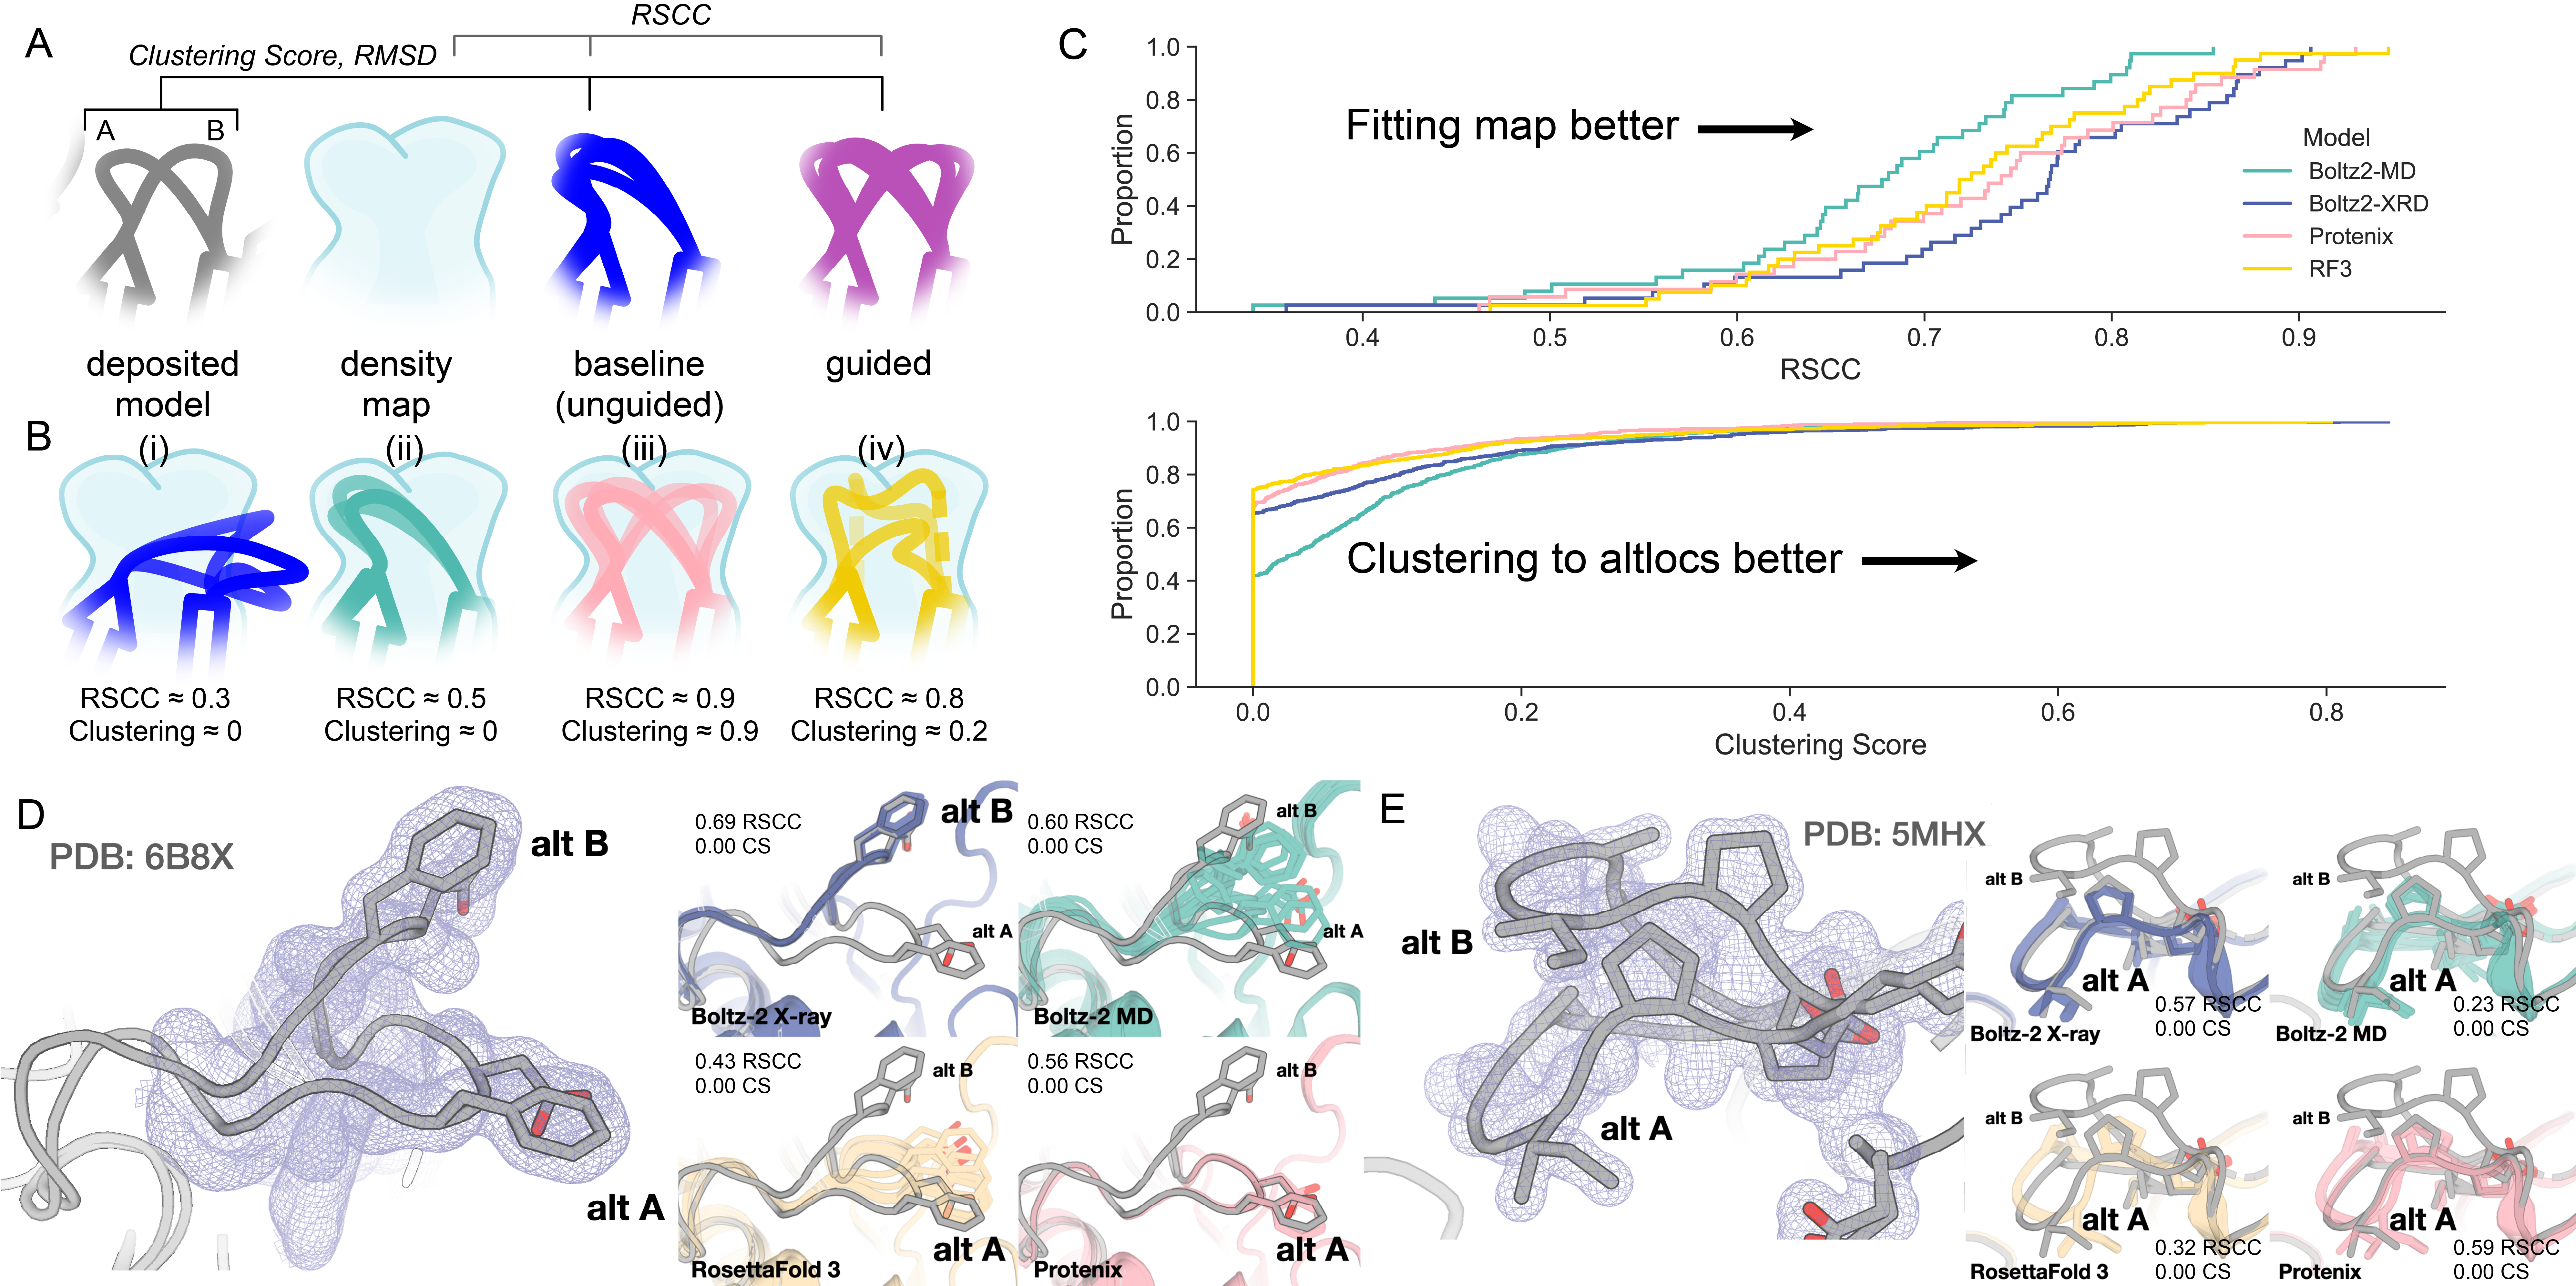
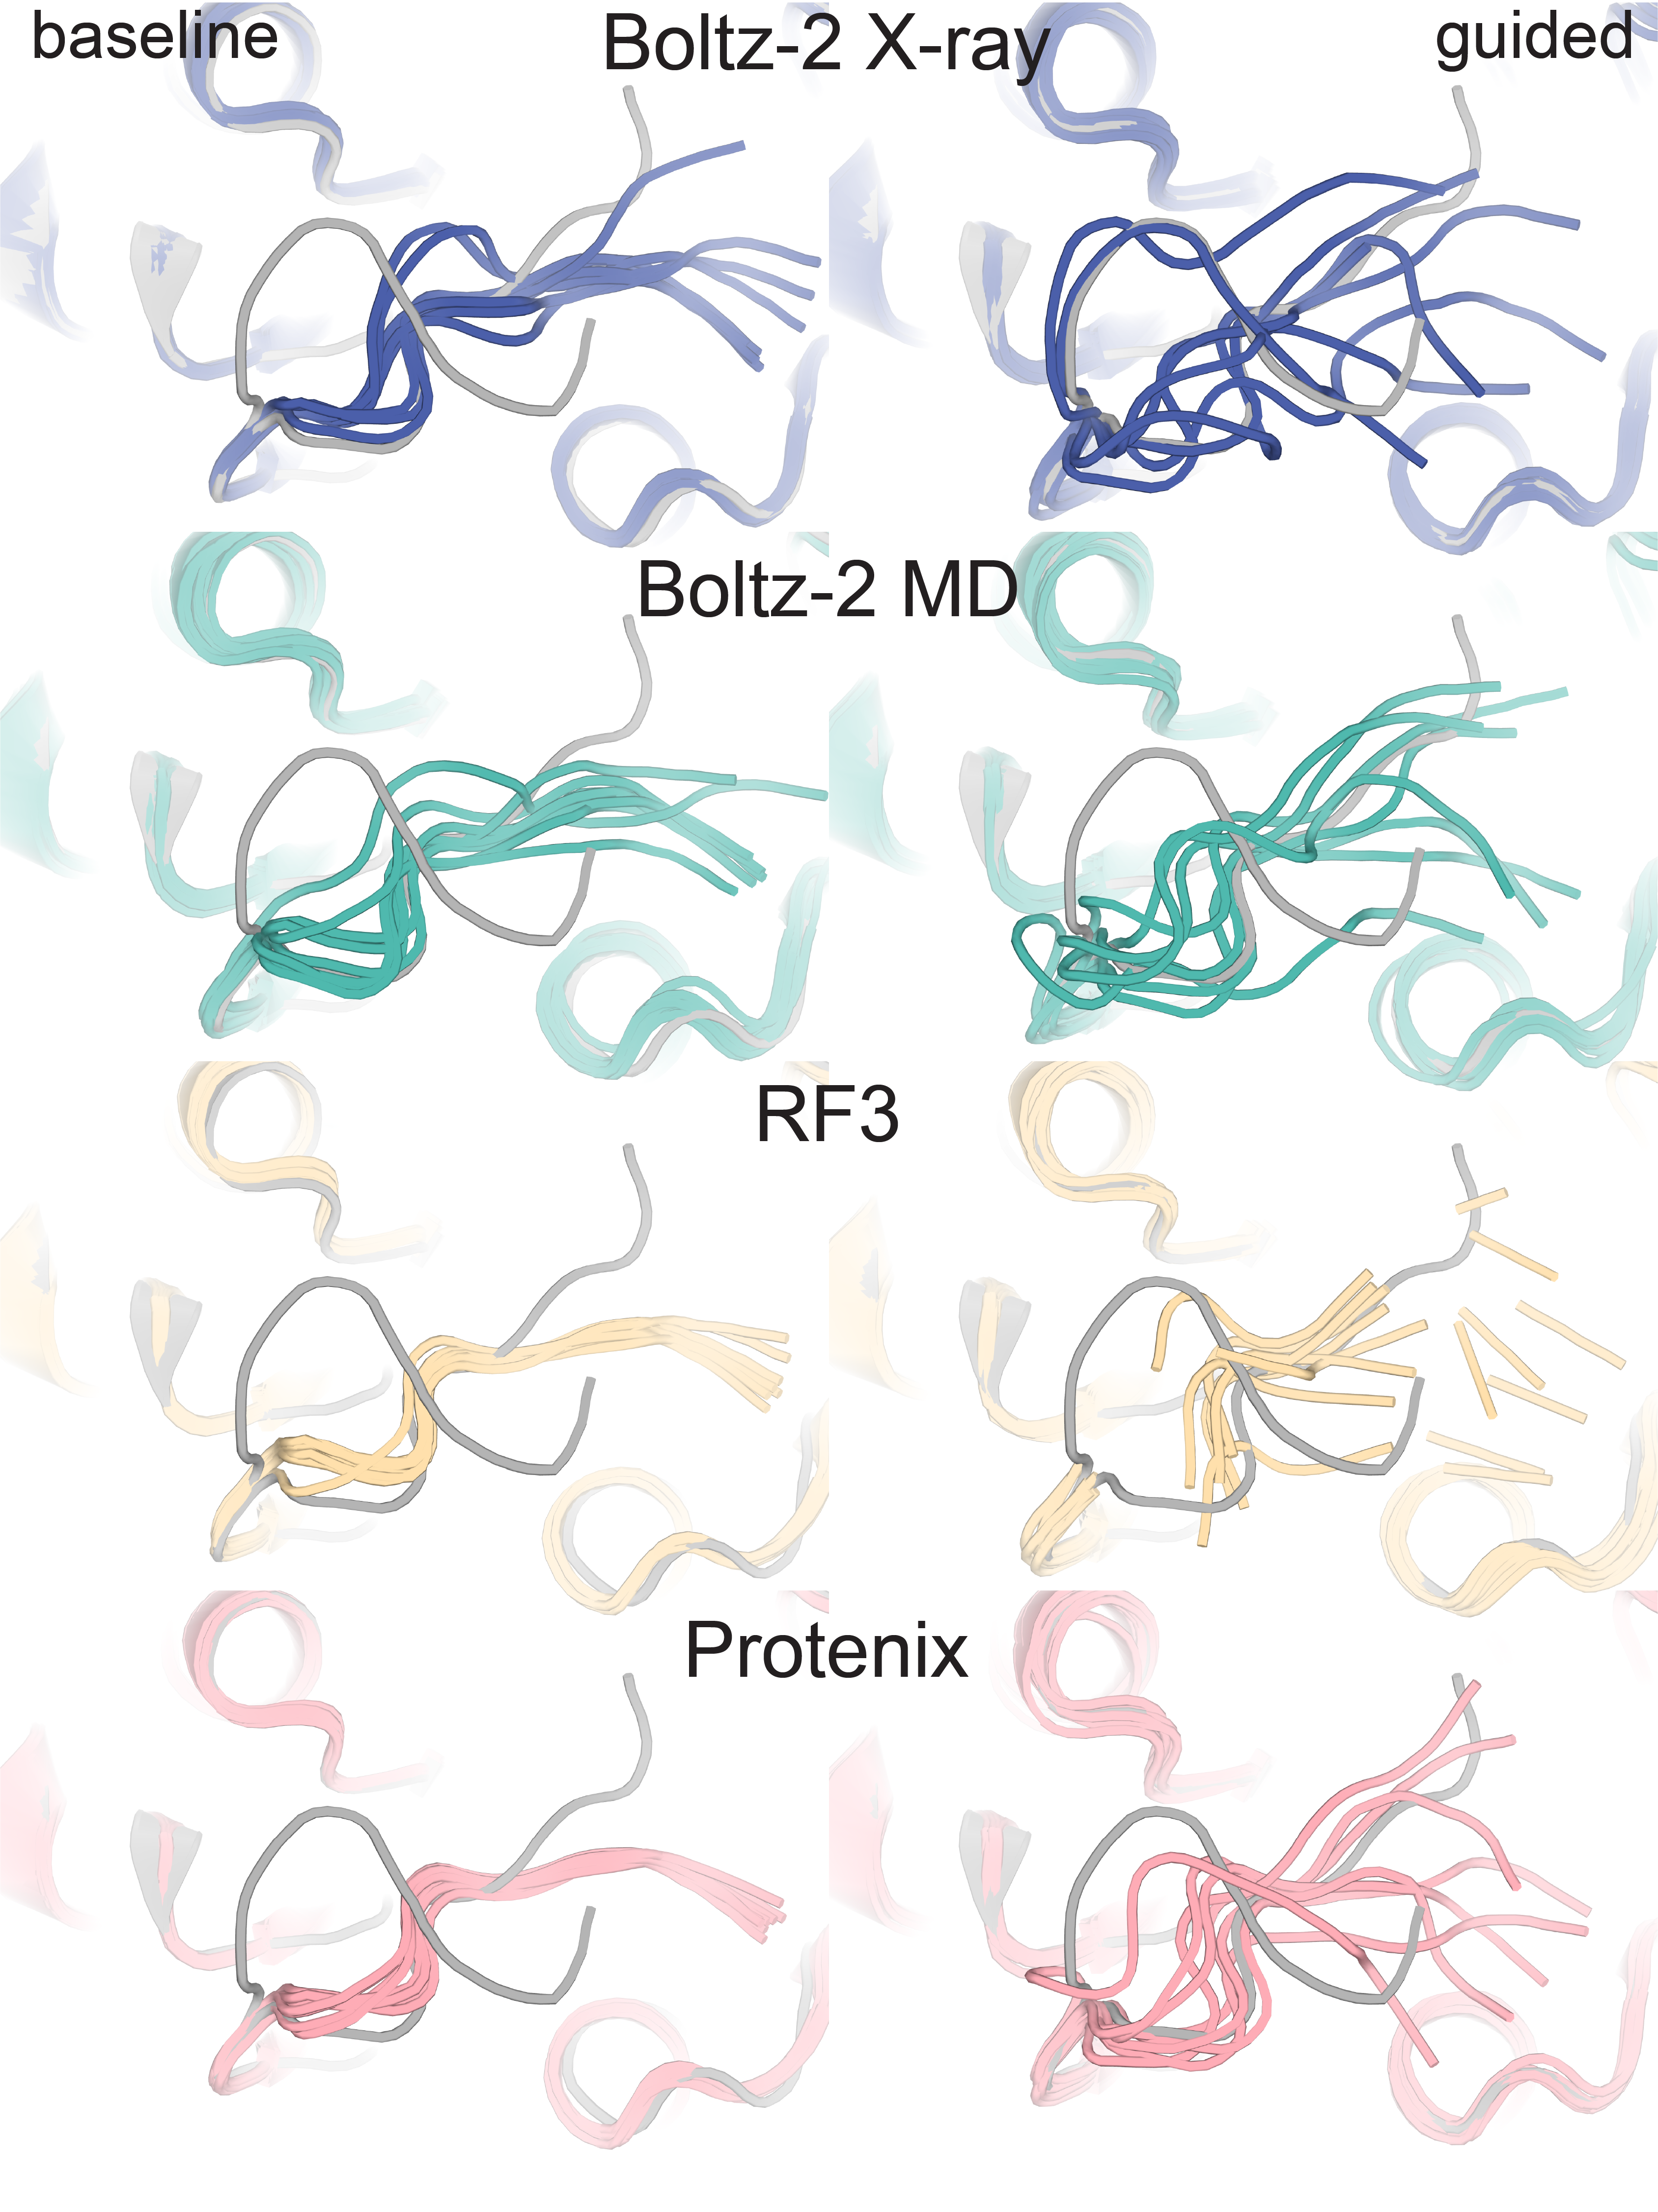
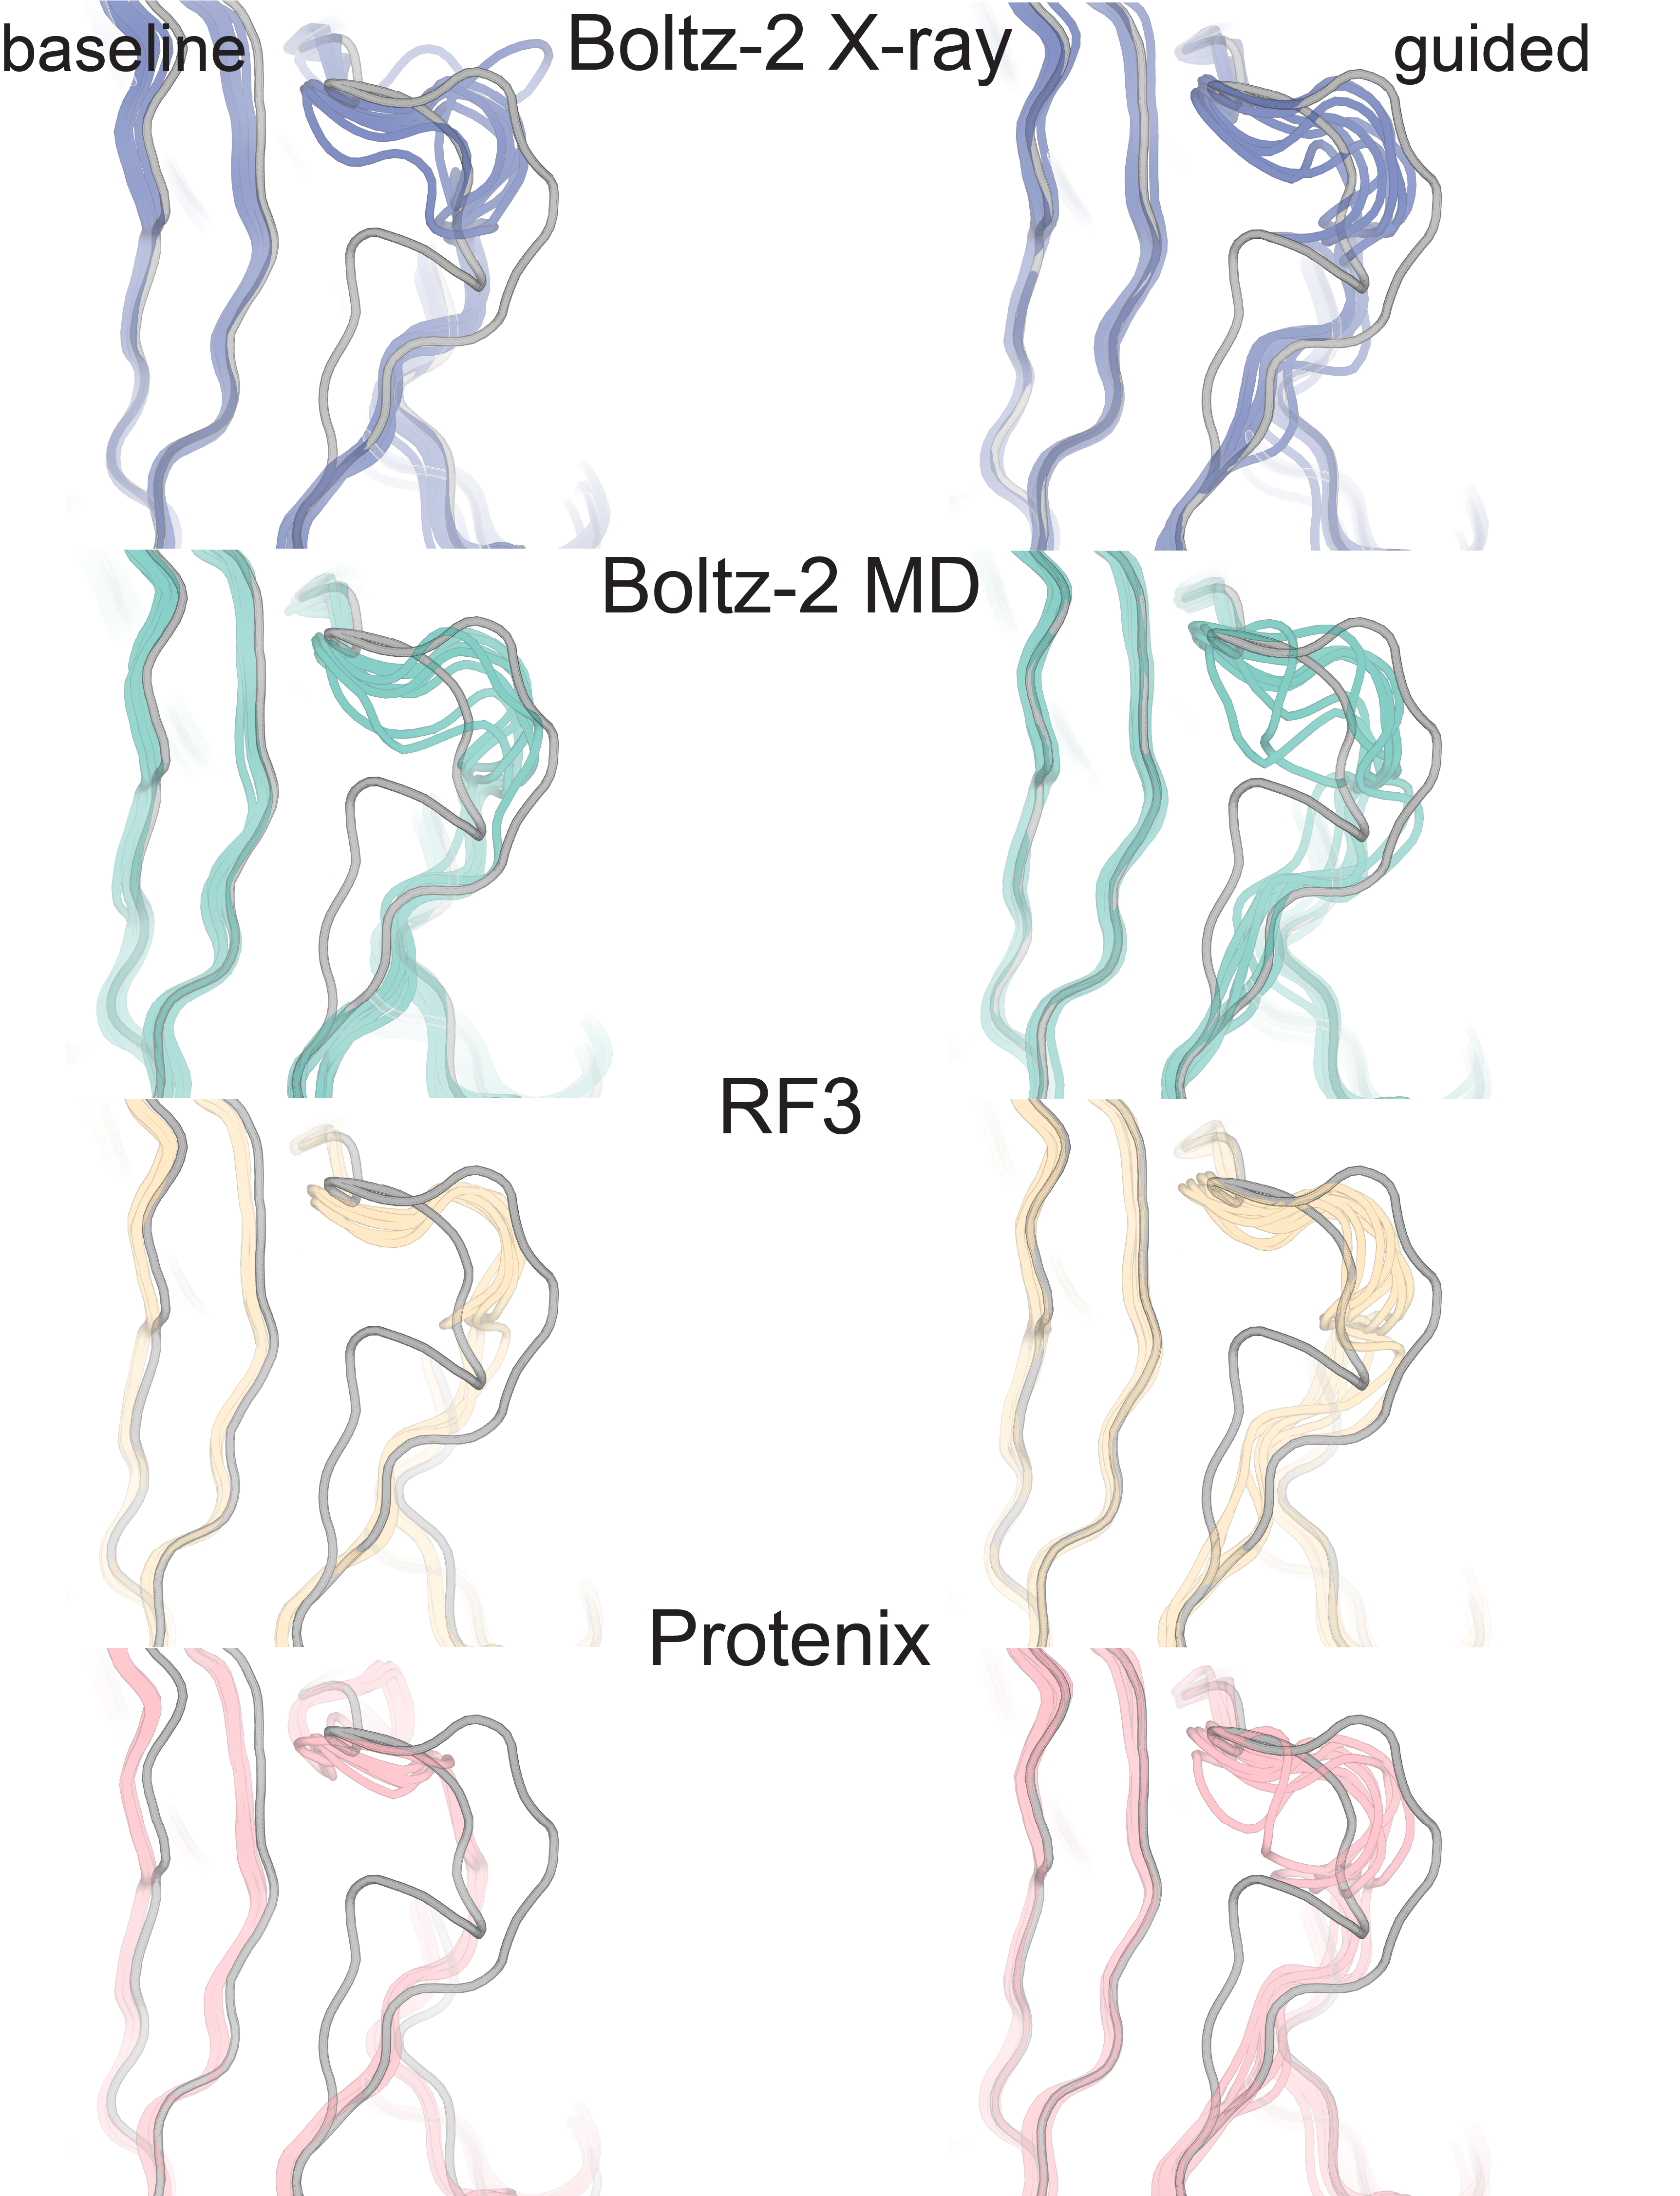
Figure 2. Figure 2: At baseline, structure predictors do not produce ensembles consistent with manually modeled alternative conformations (“altlocs”).
A) We use two metrics to evaluate ensembles in this report: RSCC and a clustering score (Methods). We evaluate ensemble fit by computing the RSCC between density maps calculated from the predicted and deposited atomic ensemble models. The clustering score measures whether the output ensemble properly clusters and covers all conformations in the deposited reference ensemble (higher = better). The example ensemble has two conformations of a loop (A, B in gray). The baseline predictions of the structure predictor (dark blue) are biased to conformation A, whereas the guided ensemble (purple) is balanced between both conformations. B) Examples of how ensemble models fit to density and are evaluated by clustering score. (i) The predictor produces an ensemble that does not cluster well to the deposited A or B and does not fit to the density. (ii) The predictor predicts a single conformation well, which will result in a moderate RSCC and a low clustering score, indicating that it did not cover both conformations. (iii) The predictor produces both conformations, resulting in high RSCC and clustering score. (iv) The predictor produces a geometrically degraded structure, which fits the density map (high RSCC) but clusters poorly to the reference coordinates (low clustering score) C) The RSCC and clustering score cumulative distribution functions (CDFs) for all altloc selections in a 40 structure dataset. For each structure, we generated a baseline ensemble of 8 unguided predictions. These were compared to the synthetic density map generated from the deposited reference model (RSCC) and the reference altloc coordinates (clustering score). A CDF further to the right indicates more predictions with better fit with the map and a better clustering to the reference altlocs. Each structure predictor shows a slightly different RSCC and clustering score distribution, suggesting different biases in the training set. D) On the left side of the panel, in blue isomesh, is the noiseless synthetic map calculated from the reference altlocs at equal occupancy, and the two altlocs in gray. The right side of each panel shows the predicted ensemble at baseline (meaning no guidance) for the structure predictors tested (Boltz-2 X-ray, Boltz-2 MD, Protenix, RF3, shown in colors). Predictors show different biases towards different conformations of PTP1B (PDB ID 6B8X). E) The density map and structure predictor colors are the same as in D. For this example, all predictors sample only the A altloc in the fungal laccase (5MHX).
To benchmark how well each of three different structure predictors capture alternative conformations, for each we generated a baseline ensemble of 8 structures per target using distinct random seeds, without any guidance applied across the 40 PDB entries in our dataset (Figure 2A). We then compared the generated baseline ensembles against both the (synthetic, noise-free) density map and the reference altlocs (Figure 2B).
To evaluate how well an ensemble of structures produced by a structure predictor fits the reference altlocs, we compute two metrics. First is the real-space correlation coefficient (RSCC), comparing the density map computed from the predicted ensemble and density map computed from the deposited reference ensemble in the area around the altloc segment. RSCC does not impose any restrictions on the physical validity of the structure. Typically, an RSCC of 0.8 or greater indicates that the model fits into the map well 50–51. Across all predicted baseline ensembles, 45.4% of the altloc selections meet this threshold (Figure 2C). In many cases, this is due to the altlocs being quite close to each other, such that predicting a single altloc well crosses this threshold. When we increase the threshold to 0.9, this drops to 15.1%, indicating that predictions may be capturing a single altloc well when there are two close together, but are rarely fitting both altlocs.
The second metric, which we call the "clustering score" (CS in figures), captures how well the generated baseline ensemble separates into and reflects the “ground truth” reference altloc conformations. This score combines structural accuracy, how closely each ensemble conformer matches its nearest reference conformation, with whether the ensemble reproduces the expected occupancy of each state. The occupancy determination is computed through the fraction of the ensemble members that are closer to altloc A vs. altloc B divided by the expected occupancy. Recall that all examples in our evaluation here have equal occupancy between the two altlocs in the deposited model, meaning that the expected occupancy is 0.5 in all cases. A clustering score of >0.5 indicates coverage of both deposited reference altlocs. For example, consider a case where the ensemble has 3 of 8 members closer to A than B. The 3 members closest to A have an average LDDT of 0.8 and the 5 members closest to B have an average LDDT of 0.7. The expected occupancy comparison would be , and the LDDT average would be , and the clustering score would then be 0.5625. Only 1.6% of the predicted ensembles had a score of 0.5 or greater, indicating that very few cases are close to capturing both altlocs.
Next, we examined two specific examples with alternative loop conformations related to function, PTP1B (PDB 6B8X, Figure 2A) and a fungal laccase (PDB 5MHX, Figure 2B). These two examples tell different stories about whether unguided structure predictors recapitulate deposited reference ensembles at baseline. 6B8X is a structure of PTP1B, a protein tyrosine phosphatase, with both conformations of the activation loop of the enzyme in the deposited model 52. Importantly PTP1B is an example where the alternative conformations have been observed both within a single dataset as altlocs and as the primary (or only) conformation modeled across multiple different datasets. In contrast, the alternative conformations of the M. murashkinskyi laccase, PDB 5MHX, have only been observed as an alternative conformation within a single dataset. In this laccase, there are two loop conformations present near the substrate binding cleft and active site 53. For both the PTP1B and laccase examples, no structure predictor successfully samples both A and B altlocs across the 8 different random seeds, even though these conformations are approximately isoenergetic, as evidenced by their similar occupancy in PDB-deposited models.
In PTP1B, most structure predictors are dominated by altloc A, with only Boltz-2 predicting the open conformation corresponding to altloc B. Interestingly, when we use the molecular dynamics method conditioning feature of Boltz-2, this bias returns to altloc A. The difference in bias with the default X-ray diffraction method conditioning for Boltz-2 is likely due to training on the large number of structures deposited from X-ray crystallography fragment screening campaigns for PTP1B 52, 54, where the open (altloc B) configuration dominates. Indeed, 167/255 (65.5%) structures in the 40% sequence identity cluster containing PTP1B that is used by Boltz-2 with X-ray conditioning for training are closer to altloc B than A.
In the fungal laccase, no models predict the B altloc. There are fewer total structures in this protein’s training cluster (69 in the 40% sequence identity clustering). However, 32/69 (46.4%) structures are closer to the B altloc when measured by LDDT. While the B altloc has substantial representation in the training cluster, the smaller overall sample may mean that the structure predictors are more likely to memorize this particular sequence to conformation mapping compared to PTP1B, which has greater conformational diversity across different datasets. These examples are illustrative of the overall trend; the predicted ensembles are strongly clustered to a single alternative conformation and the fit to density is not ideal. With this baseline, the next challenge is to determine whether density map guidance can improve the ability of structure predictors to sample alternative conformations (Figure 2A).
Guidance with density maps improves conformational sampling in all structure predictors, but fails to reliably capture all conformations
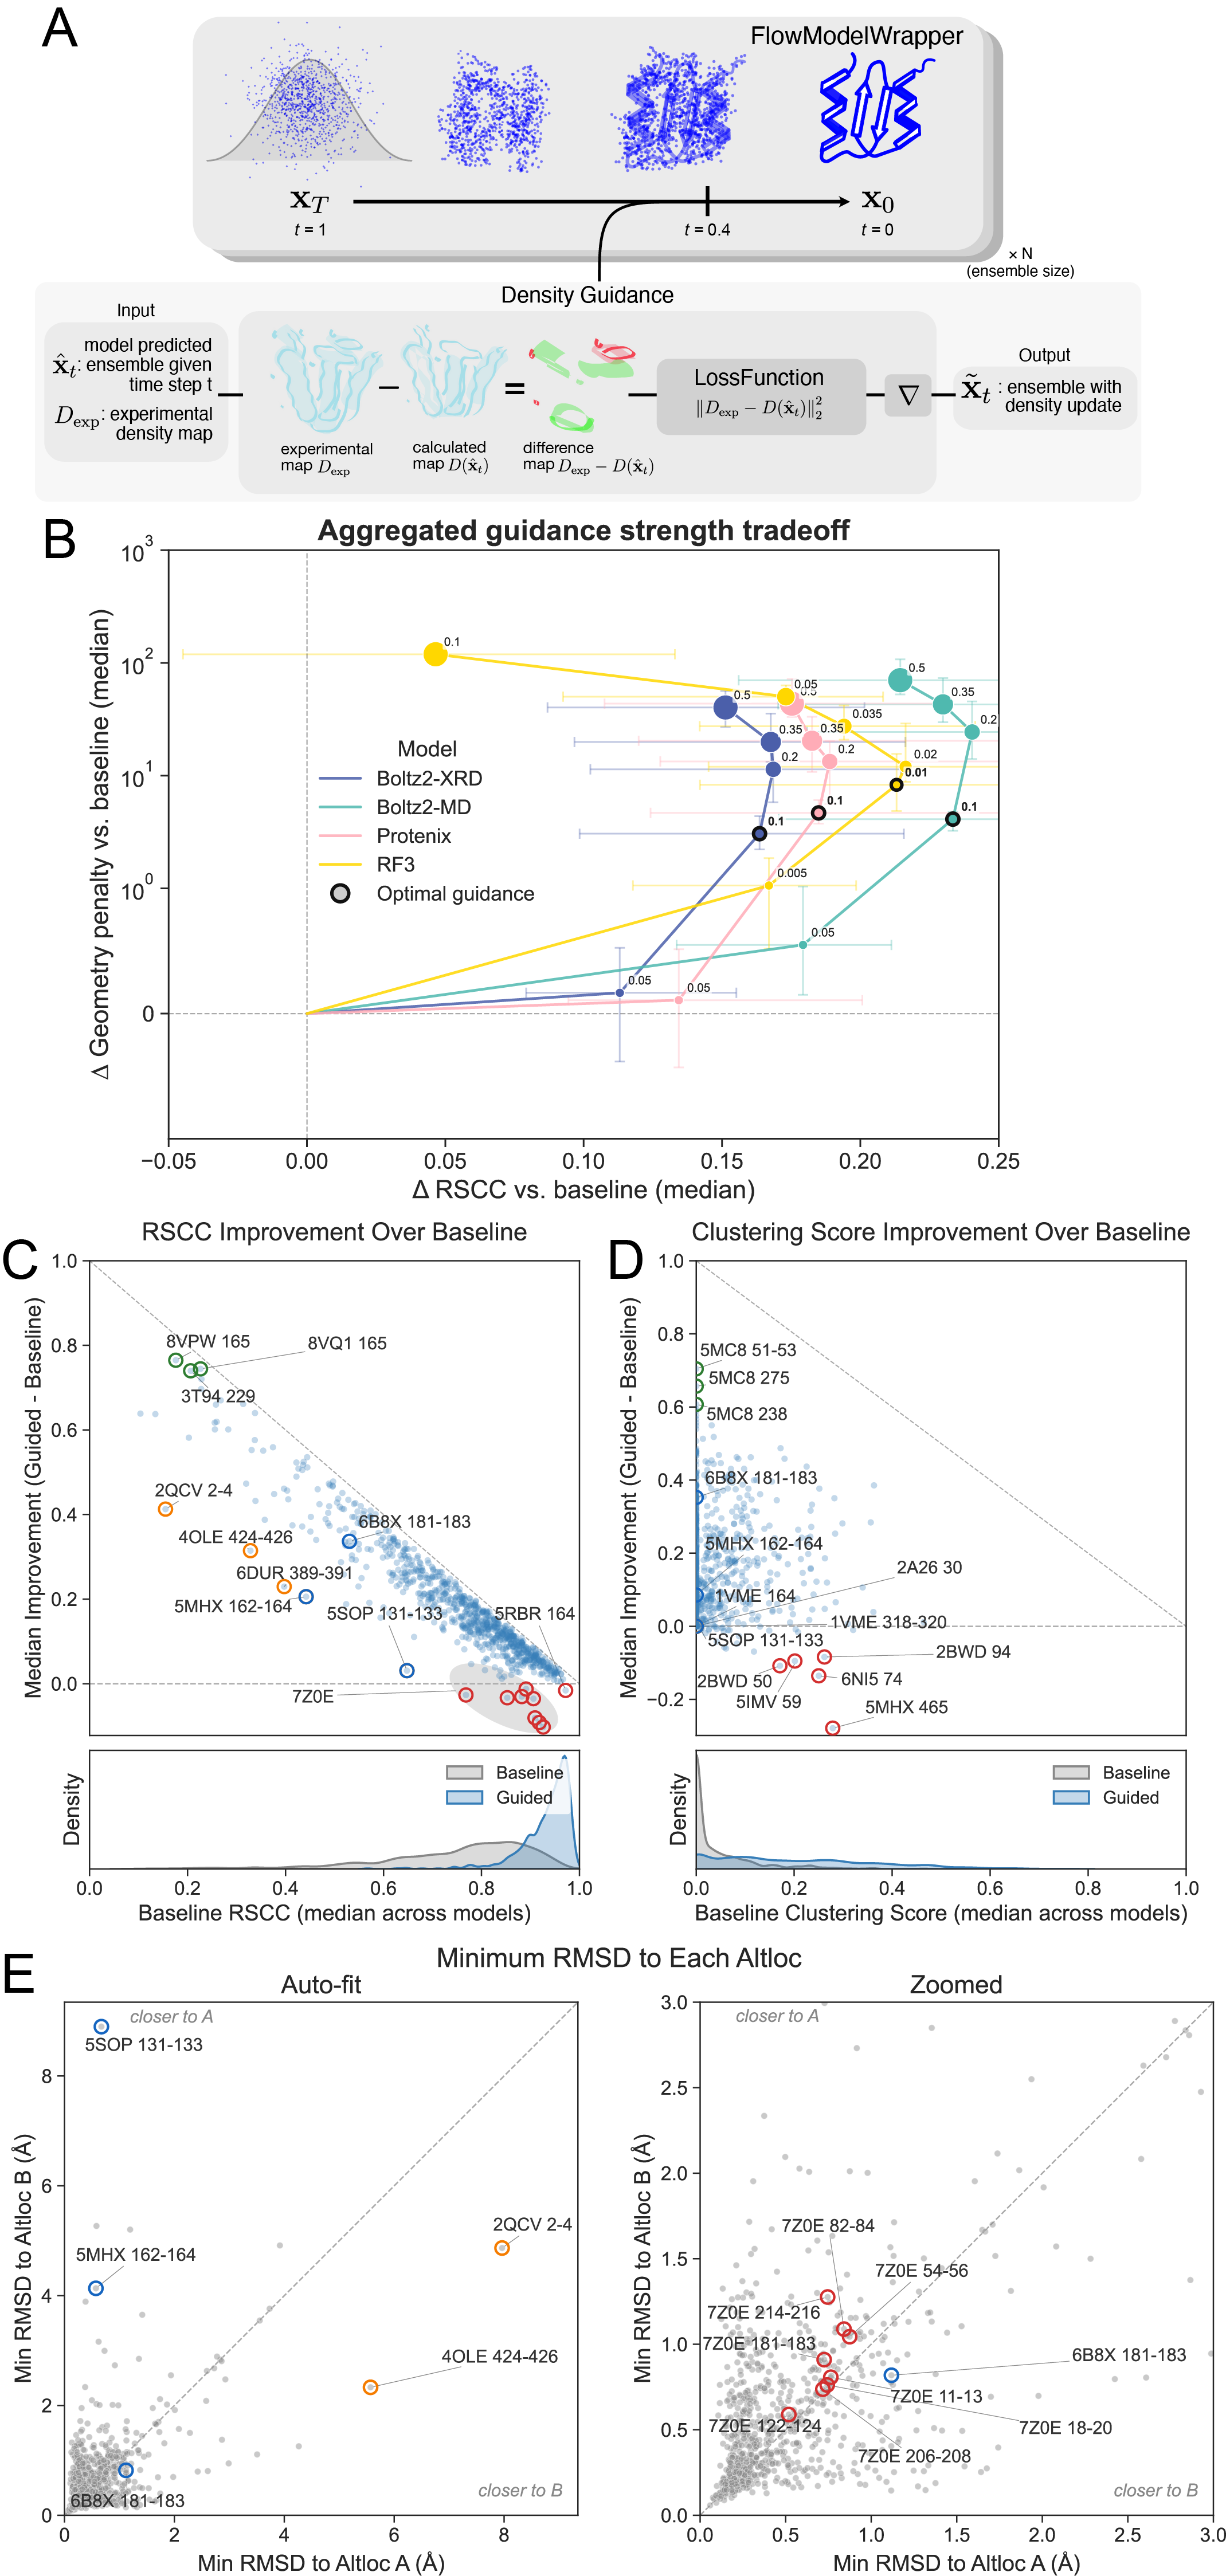
Figure 3. Figure 3: Structure predictors improve fit to data when guided
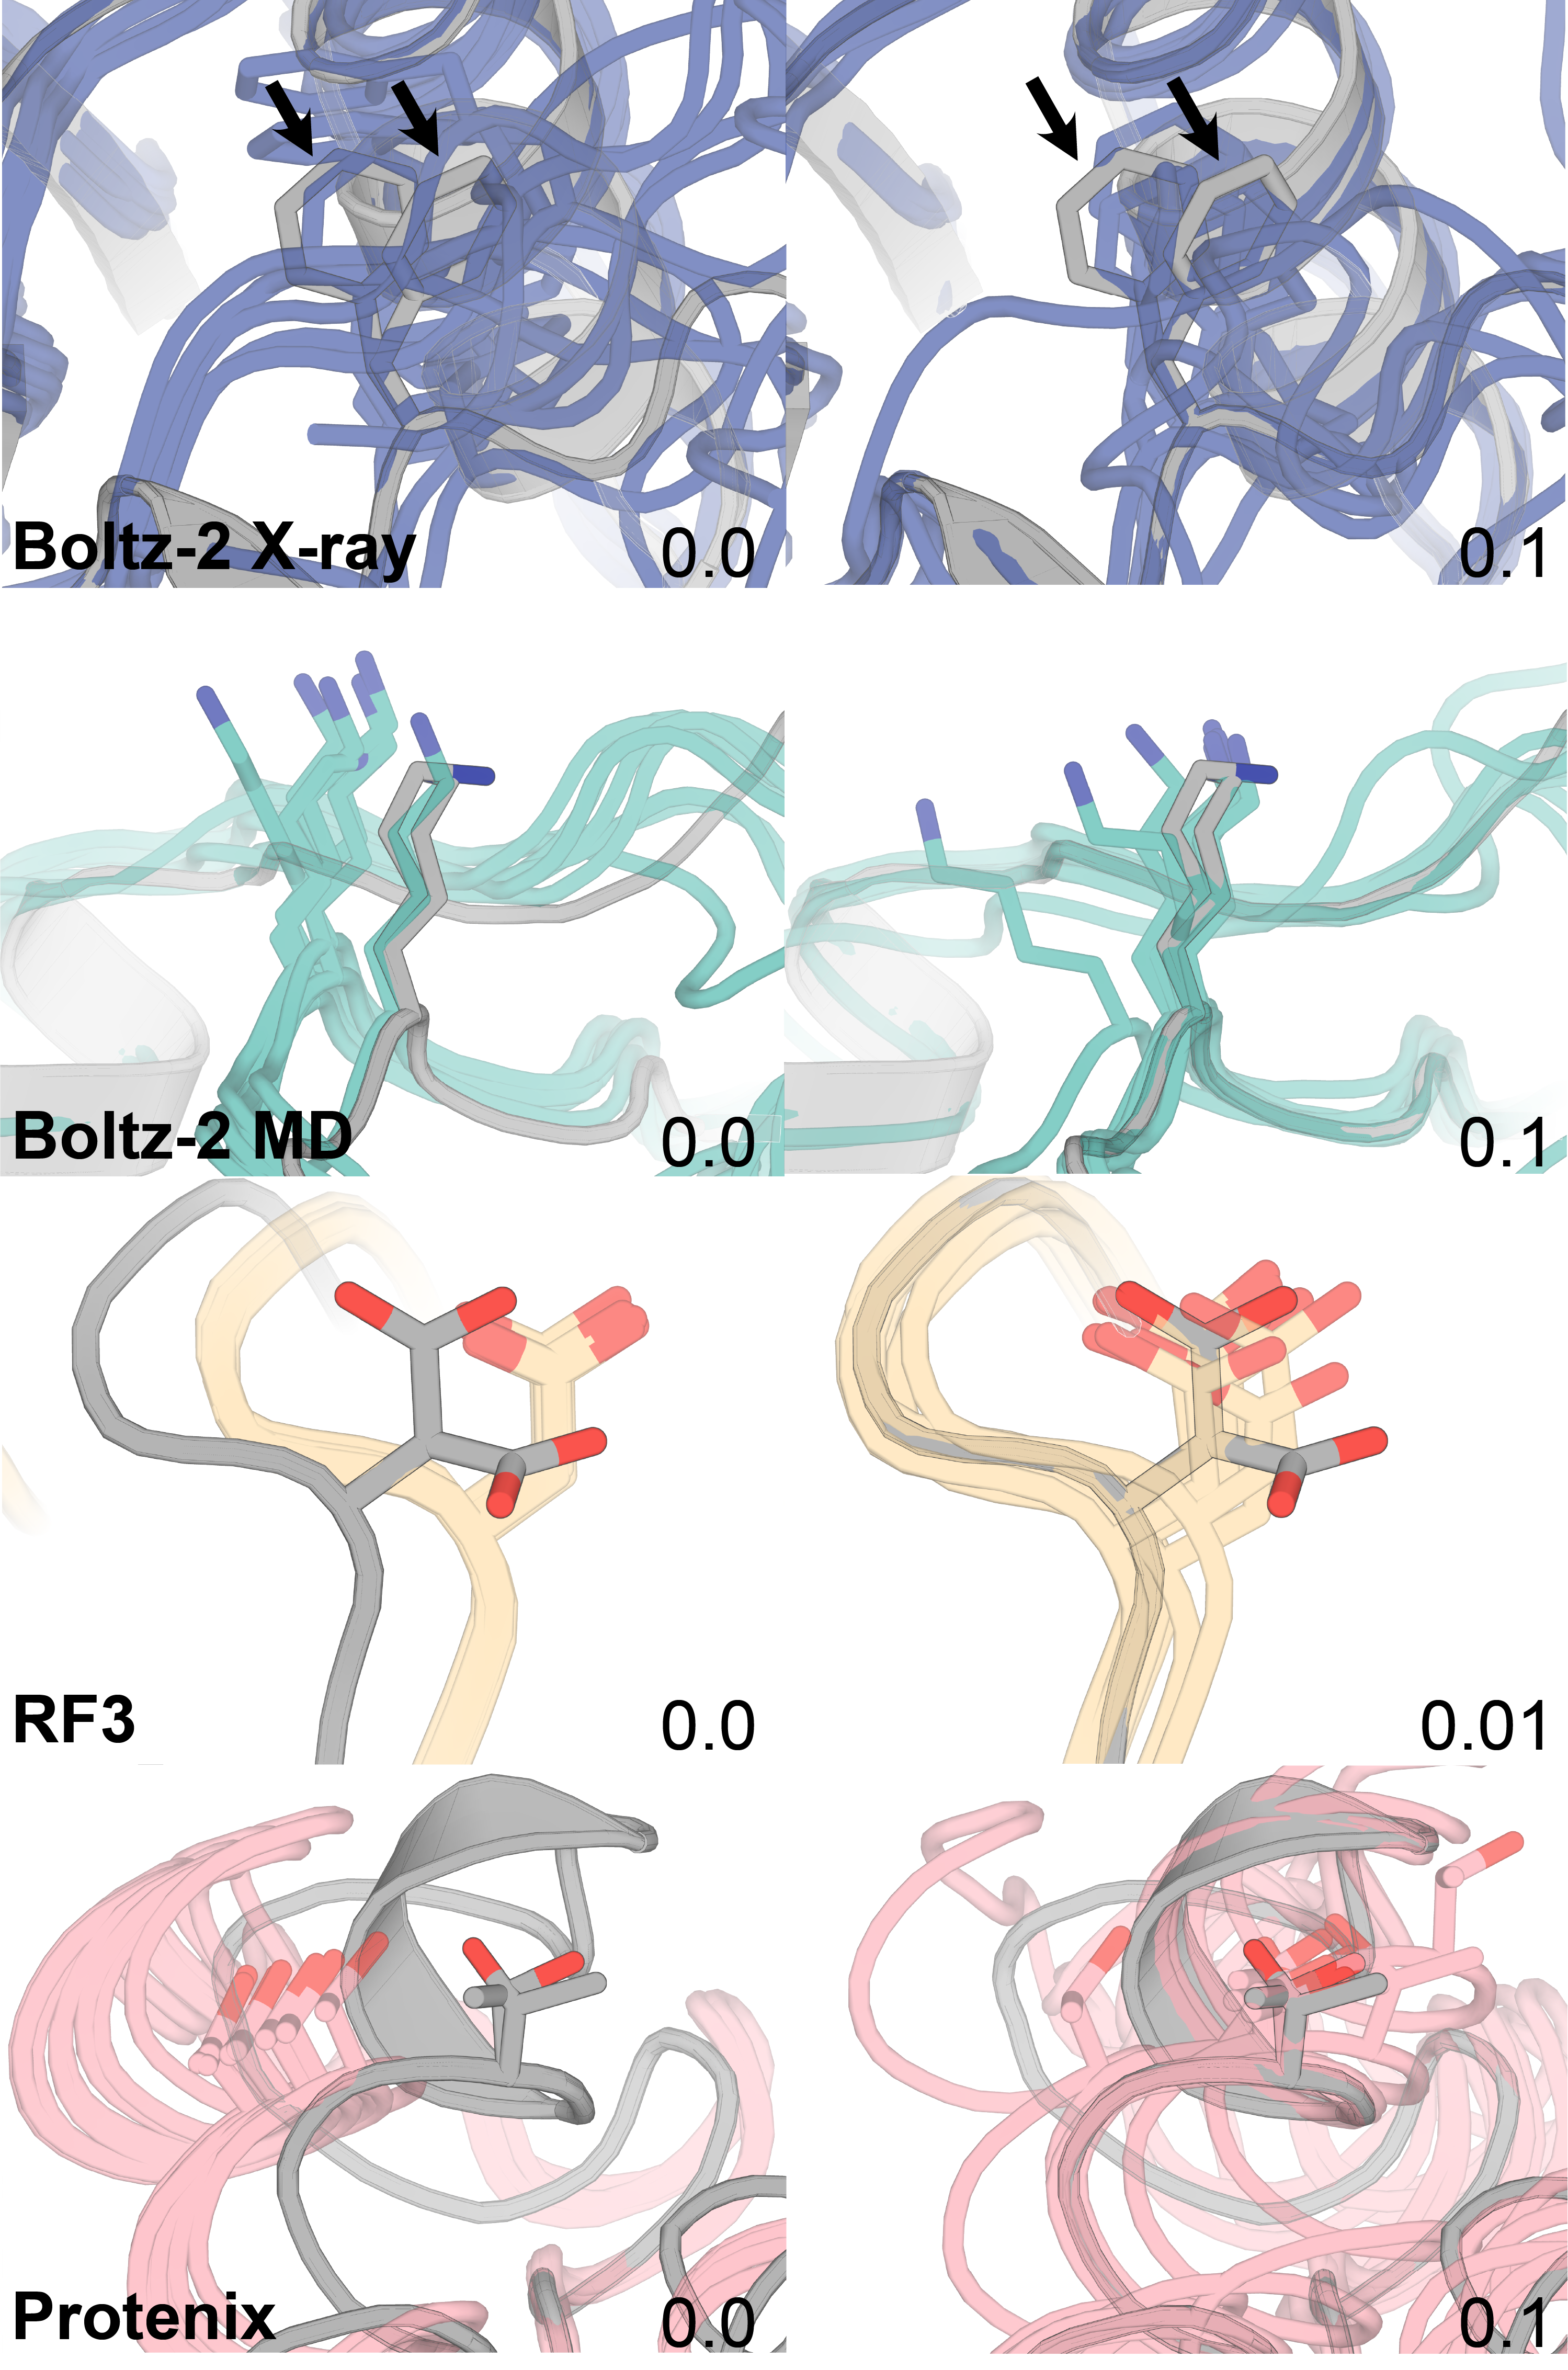
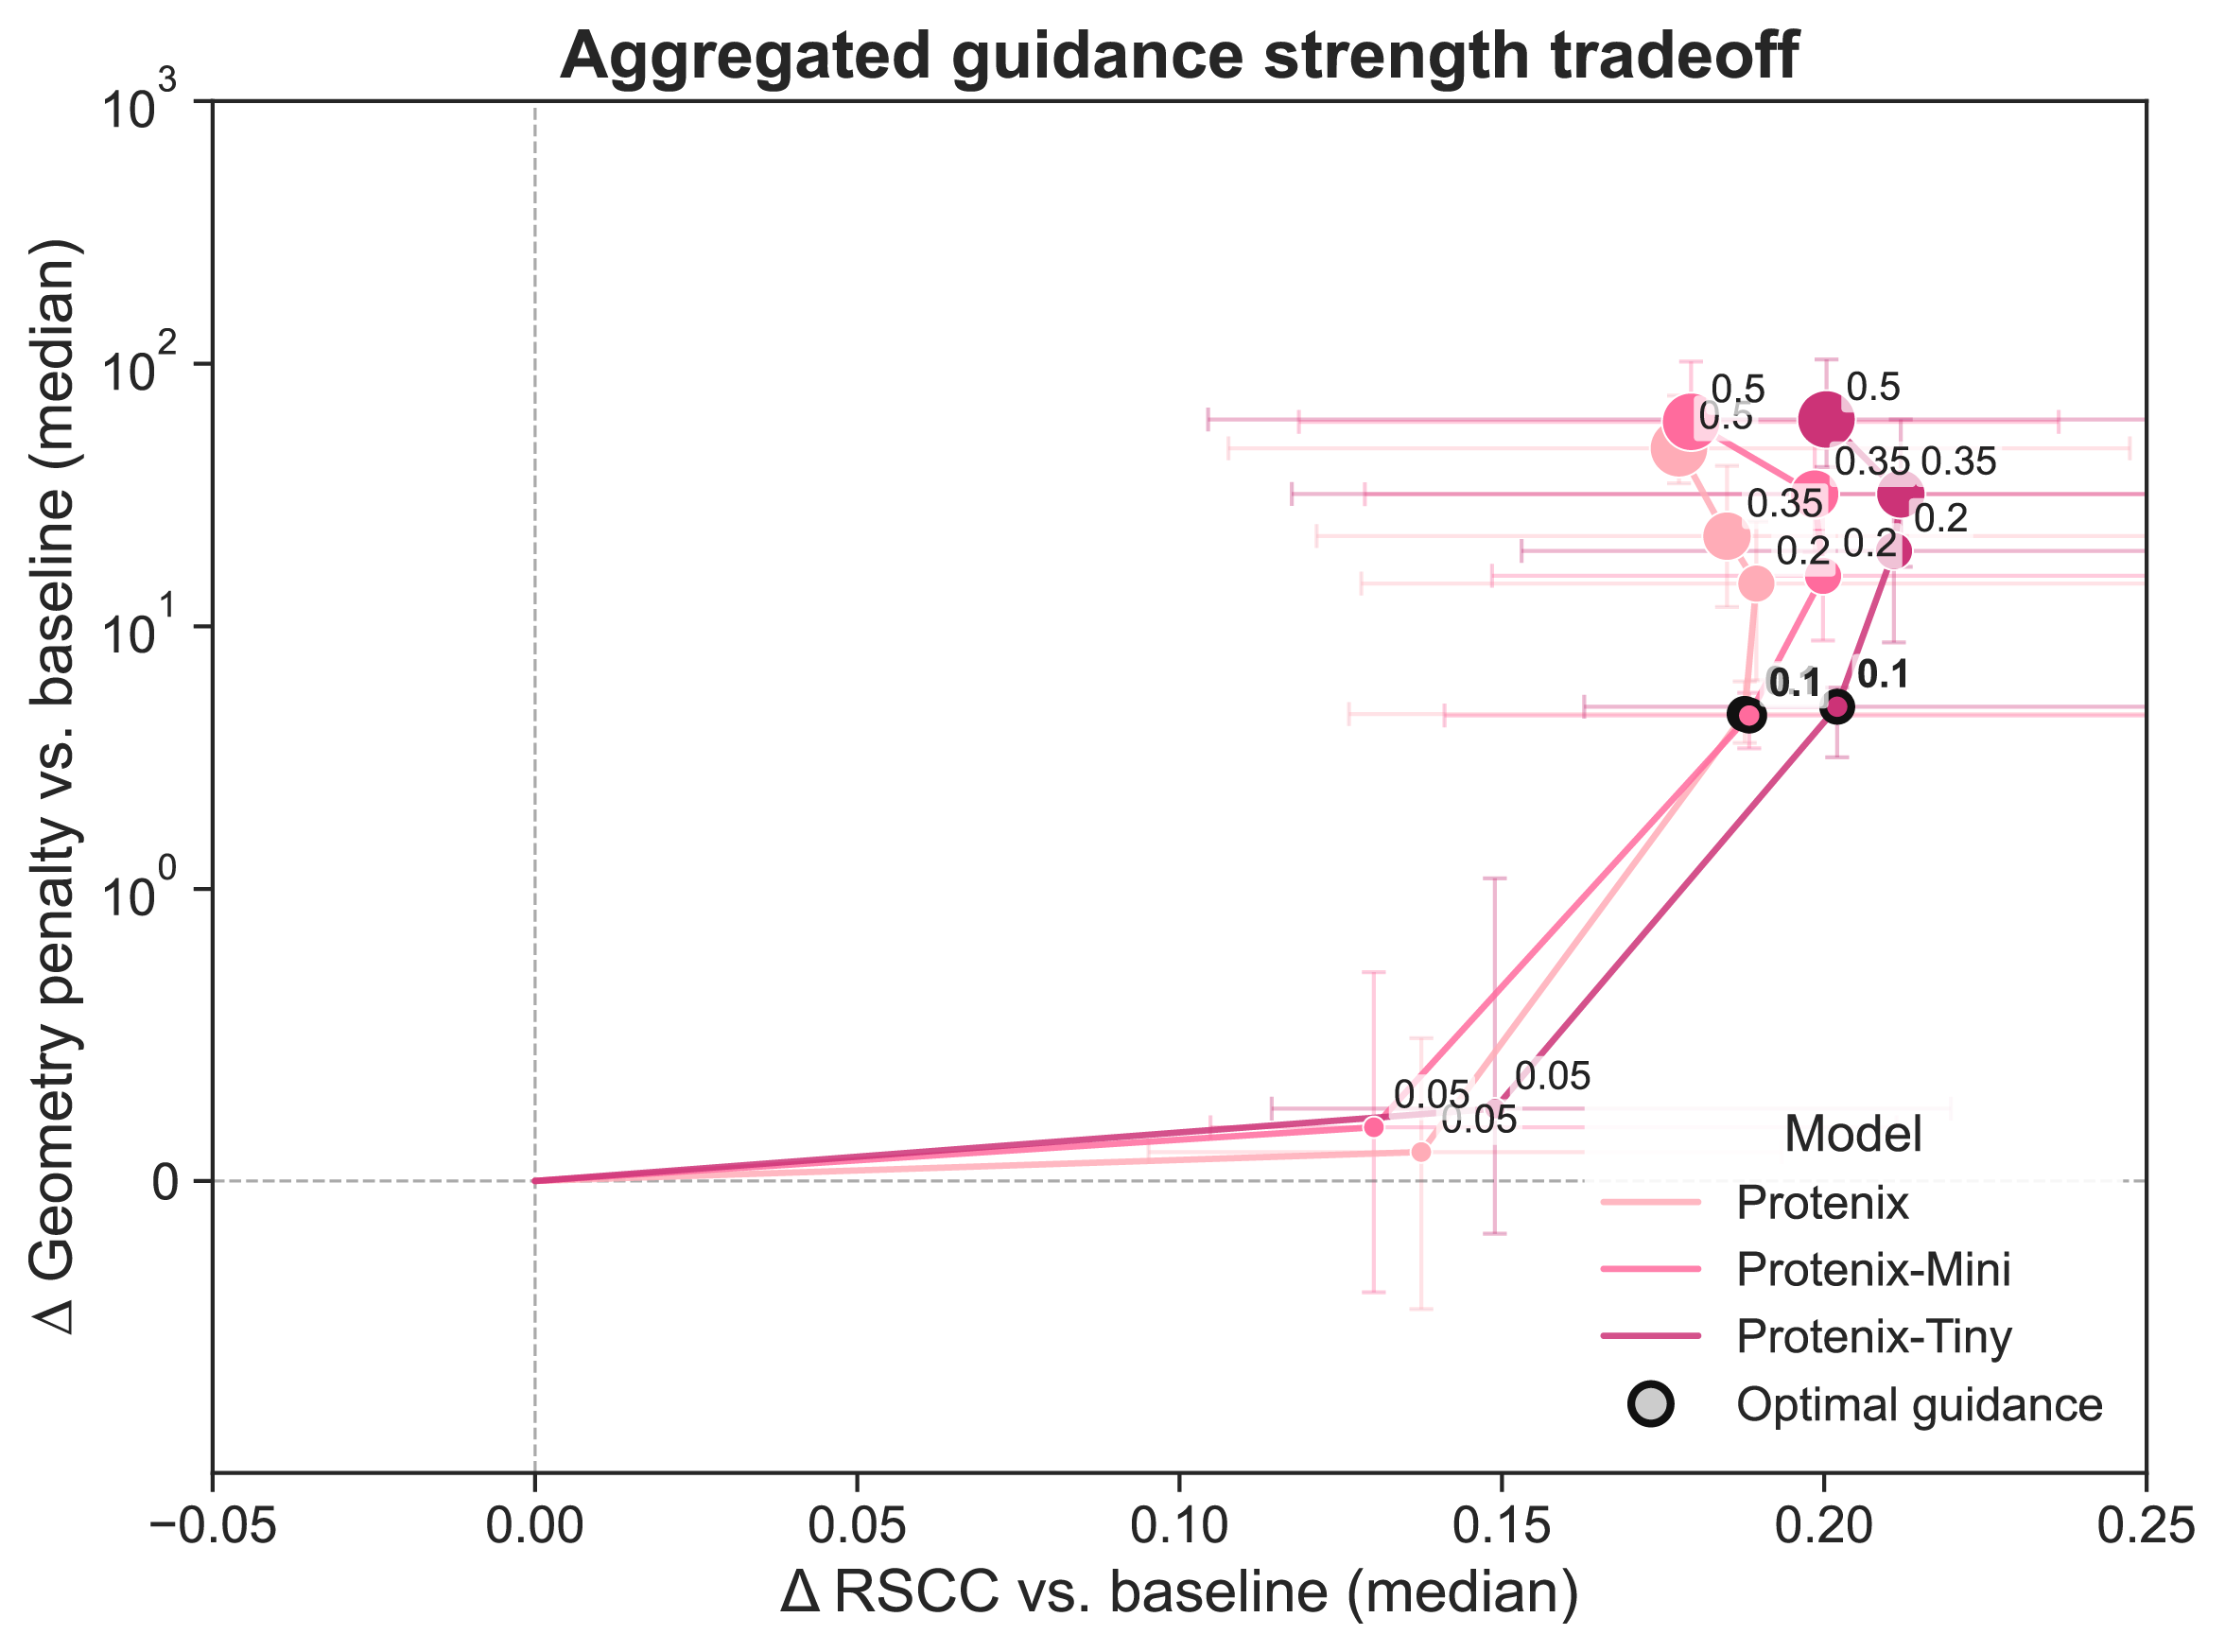
A) We apply diffusion guidance to each structure predictor, starting 60% of the way through the diffusion trajectory (step 120/200). We use the L2 norm over the difference between the synthetic 1 Å map calculated from the deposited reference altlocs (D_{exp}) and the map calculated from the predicted ensemble. B) We plot the difference in RSCC compared with differences in ideal geometry across all altloc segments as we increase the guidance strength for each structure predictor (size of sphere). Increasing the guidance strength generally increases RSCC over the baseline ensemble, but at the cost of an increase in the geometry penalty. We elect to use the guidance strength that increases the RSCC most, but before the penalty increases more than 10 (note the log scale). Points are the median, error bars are the inter-quartile range. C) We show the median RSCC improvement over baseline (no guidance, Figure 2) for each altloc selection over all structure predictors when using the highlighted “optimal” guidance strength. Each datapoint is the median altloc section RSCC across structure predictors. When the predicted baseline ensemble already fits moderately to the data, guidance can improve fit. Achieving a fit near the maximum (grey dashed line) when the predicted baseline ensemble does not fit well (further left) is more challenging. The green highlighted dots are cases where guidance improved the predicted ensemble the most. The orange highlighted dots are cases where the predictors are the furthest from the diagonal line (which indicates 1.0 RSCC), and thus have the most room for improvement. The red highlighted dots are cases where the RSCC decreases after guidance. Blue bolded dots are additional examples we discuss in the text. D) We show the clustering score improvement over baseline. Points are the median across structure predictors. Coloring applies the same as in C. E) We calculate the minimum root mean square deviation (RMSD) over the predicted guided ensemble to both altloc A and altloc B of the ground truth and average across structure predictors. The predicted guided ensembles in some cases achieve low RMSD to the deposited reference altloc coordinates as well, but even with improvements in RSCC, predicted ensembles do not always achieve low RMSD to both altlocs. All points are the mean across all structure predictors. Points are colored the same color as they appear in C.
We next sought to improve the fit of the predicted ensembles by applying density guidance. To do this, we generated synthetic density maps for each deposited model with an equal mixture of two altlocs present. This map is the same as the map used to evaluate the baseline ensemble predictions, and will be used to also evaluate the guided ensembles. We use this map to apply diffusion guidance at inference 29.
As previous studies have demonstrated the need to find an optimal guidance weight 27, 29, we first set out to identify the guidance parameters that best fit the density without degrading the chemical validity of the model. We generated ensembles of structures for each protein with increasing guidance strength (0.0 to 0.5) and quantified the tradeoff between RSCC and a geometry score (Figure 3A). At the lowest guidance strengths, the models substantially improved their fit to the experimental data (96.0% >= 0.8 RSCC, 10.9% >= 0.5 Clustering score) without incurring substantial geometry penalties, measured by clashes and amount of bond angle and length outliers (see Methods). As the guidance strength increases, the RSCC of the guided ensembles improves further, but the resulting structures incur greater geometric penalties. At the highest guidance strengths (0.35, 0.5), clashes and unrealistic distances between bonded atoms are present in nearly every residue, and the guided ensembles actually fit the data worse (Supplementary Figure 4). Although the unrealistic geometry was expected at higher guidance strengths as the density term gains dominance over the prior, the degradation in the fit to data is counterintuitive. We speculate that high guidance strengths yield steps along the density gradient that are too large to converge, destabilizing the sampling trajectory.
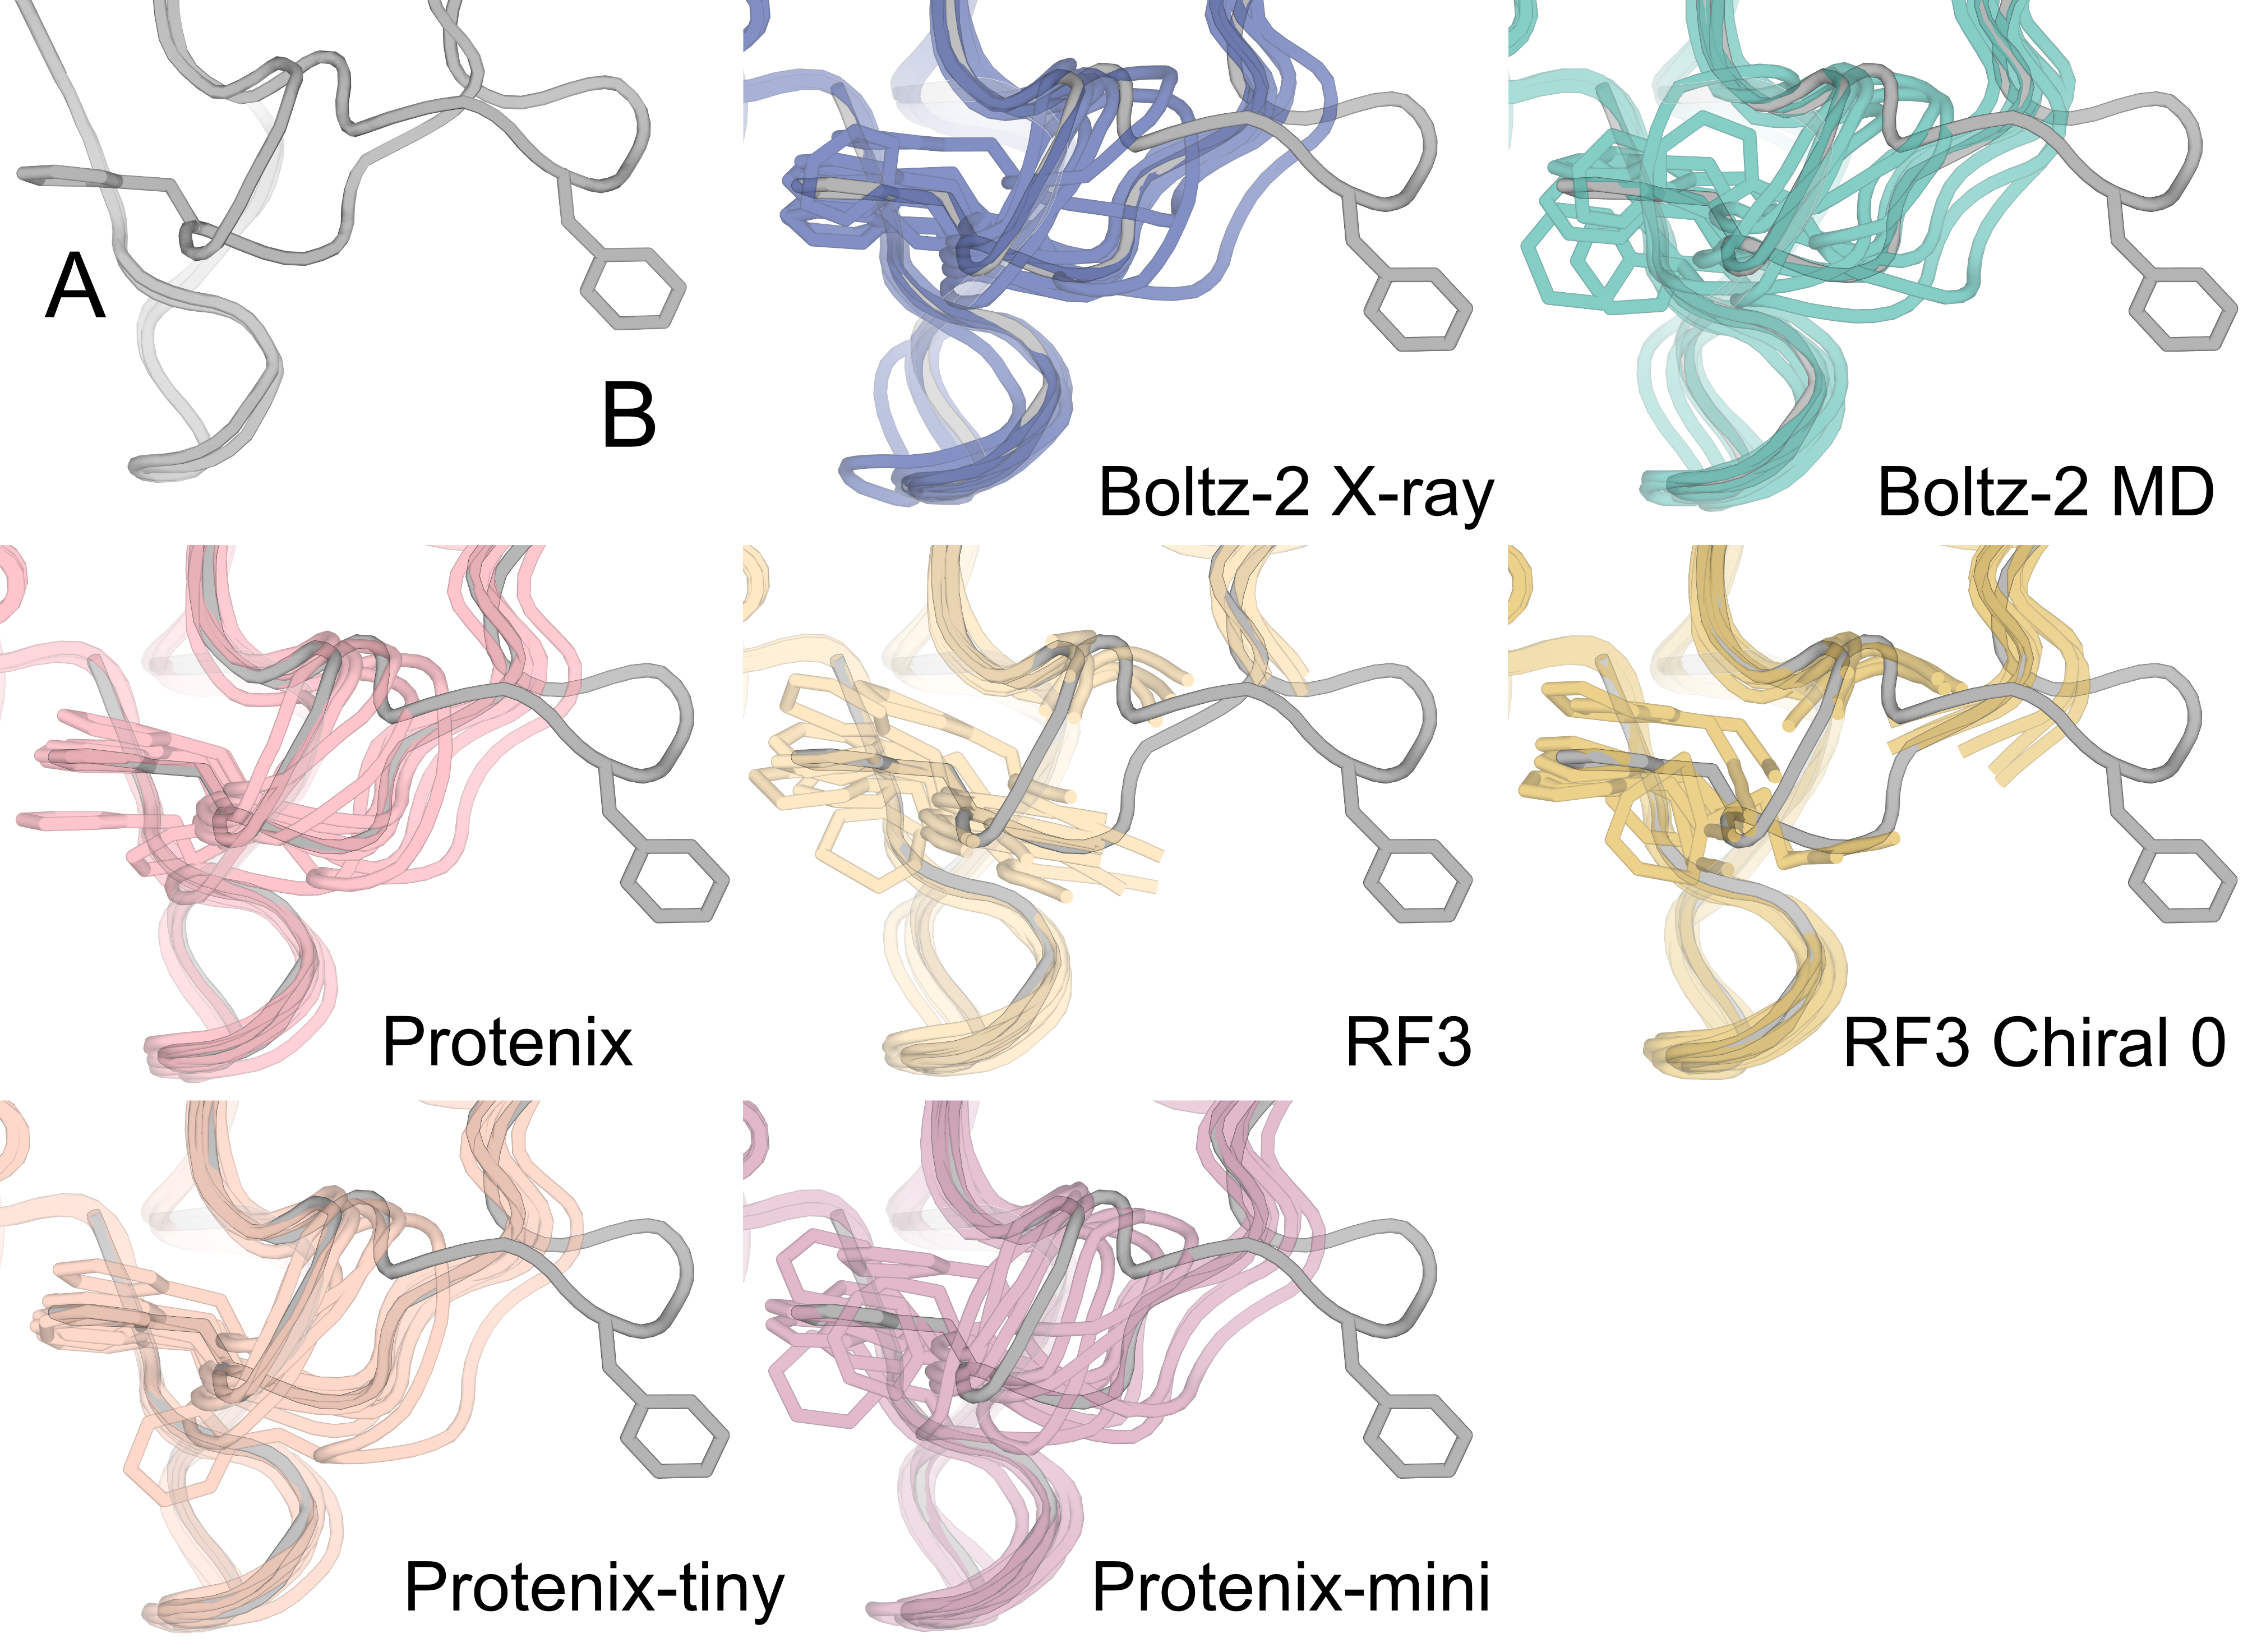
For each structure predictor, we selected the guidance strength that yielded the largest improvement in RSCC without degrading the structural geometry, defined as a geometry penalty of greater than 10. For Boltz-2 and Protenix, this was guidance strength 0.1, which is the same strength as the most similar previously published guidance method 29. RF3, when tested with the same guidance strength as the other models, produces many more stereochemical violations, so we settled on a 10-fold lower guidance strength (0.01) than the other predictors. We suspect this could be due to differences in how the model was trained. RF3 was trained with a disorder distillation strategy using Rosetta 43, and also uses a set of "chiral features" that help the model respect chirality. We also tested guidance with these features set to zero, but did not find that it changed the amount of stereochemical violations (Supplementary Figure 7).
We suspected that the ability of a protein to be guided into density was partly a function of the structure predictor's training data composition. Specifically, some of the variation in model performance may reflect which alternative conformations are represented in training datasets. Since only a single conformer is retained during training (typically altloc A), alternative conformations are only included in training if they appear as the major conformation in a different deposited structure of the same protein. For example, in PTP1B (PDB ID 6B8X), the altloc B conformation for that specific training sample is removed during training data curation, yet this open conformation is well represented across many structures deposited from X-ray crystallography fragment-screening campaigns for this protein, in which the open state dominates 52.
We next examined the clustering scores and observed that guidance generally reduces the bias towards a single conformation that we observed in the baseline ensemble predictions. However, most clustering scores are still well below 0.5, indicating that both conformations are not well sampled (Figure 3D). To examine the origins of these results, we compared the minimum root mean square deviation (RMSD) across sampled ensemble members to each alternative conformer. In some cases (such as 6B8X) the guided ensembles reflect the deposited conformations with ensemble members that have a low RMSD to both alternative conformations. In other cases, the guided ensembles do a poor job at capturing both alternative conformations. For example, in 5SOP, although the guided ensembles improve RSCC, they do so by fitting the altloc A better and do not successfully capture altloc B (Figure 3E). There are additional extreme examples (e.g. 2QCV, 4OLE) where we observe that the RMSD to both conformations remains high after guidance, even if the fit to experimental data is better (Figure 3E, Supplementary Figure 8a, Supplementary Figure 8b).
Our results indicate that while guidance can improve the fit to data, it does so through many means. It can more accurately sample the conformations in the deposited ensemble; however, it can also just improve fitting of a single conformation (as in 5SOP) or find distinct new alternative conformations that collectively improve the fit (2QCV, etc). Despite these failure modes, there are many cases where we observe improved fit and sampling of both the deposited conformations.
Guided structure predictors reflect memorization of the training set
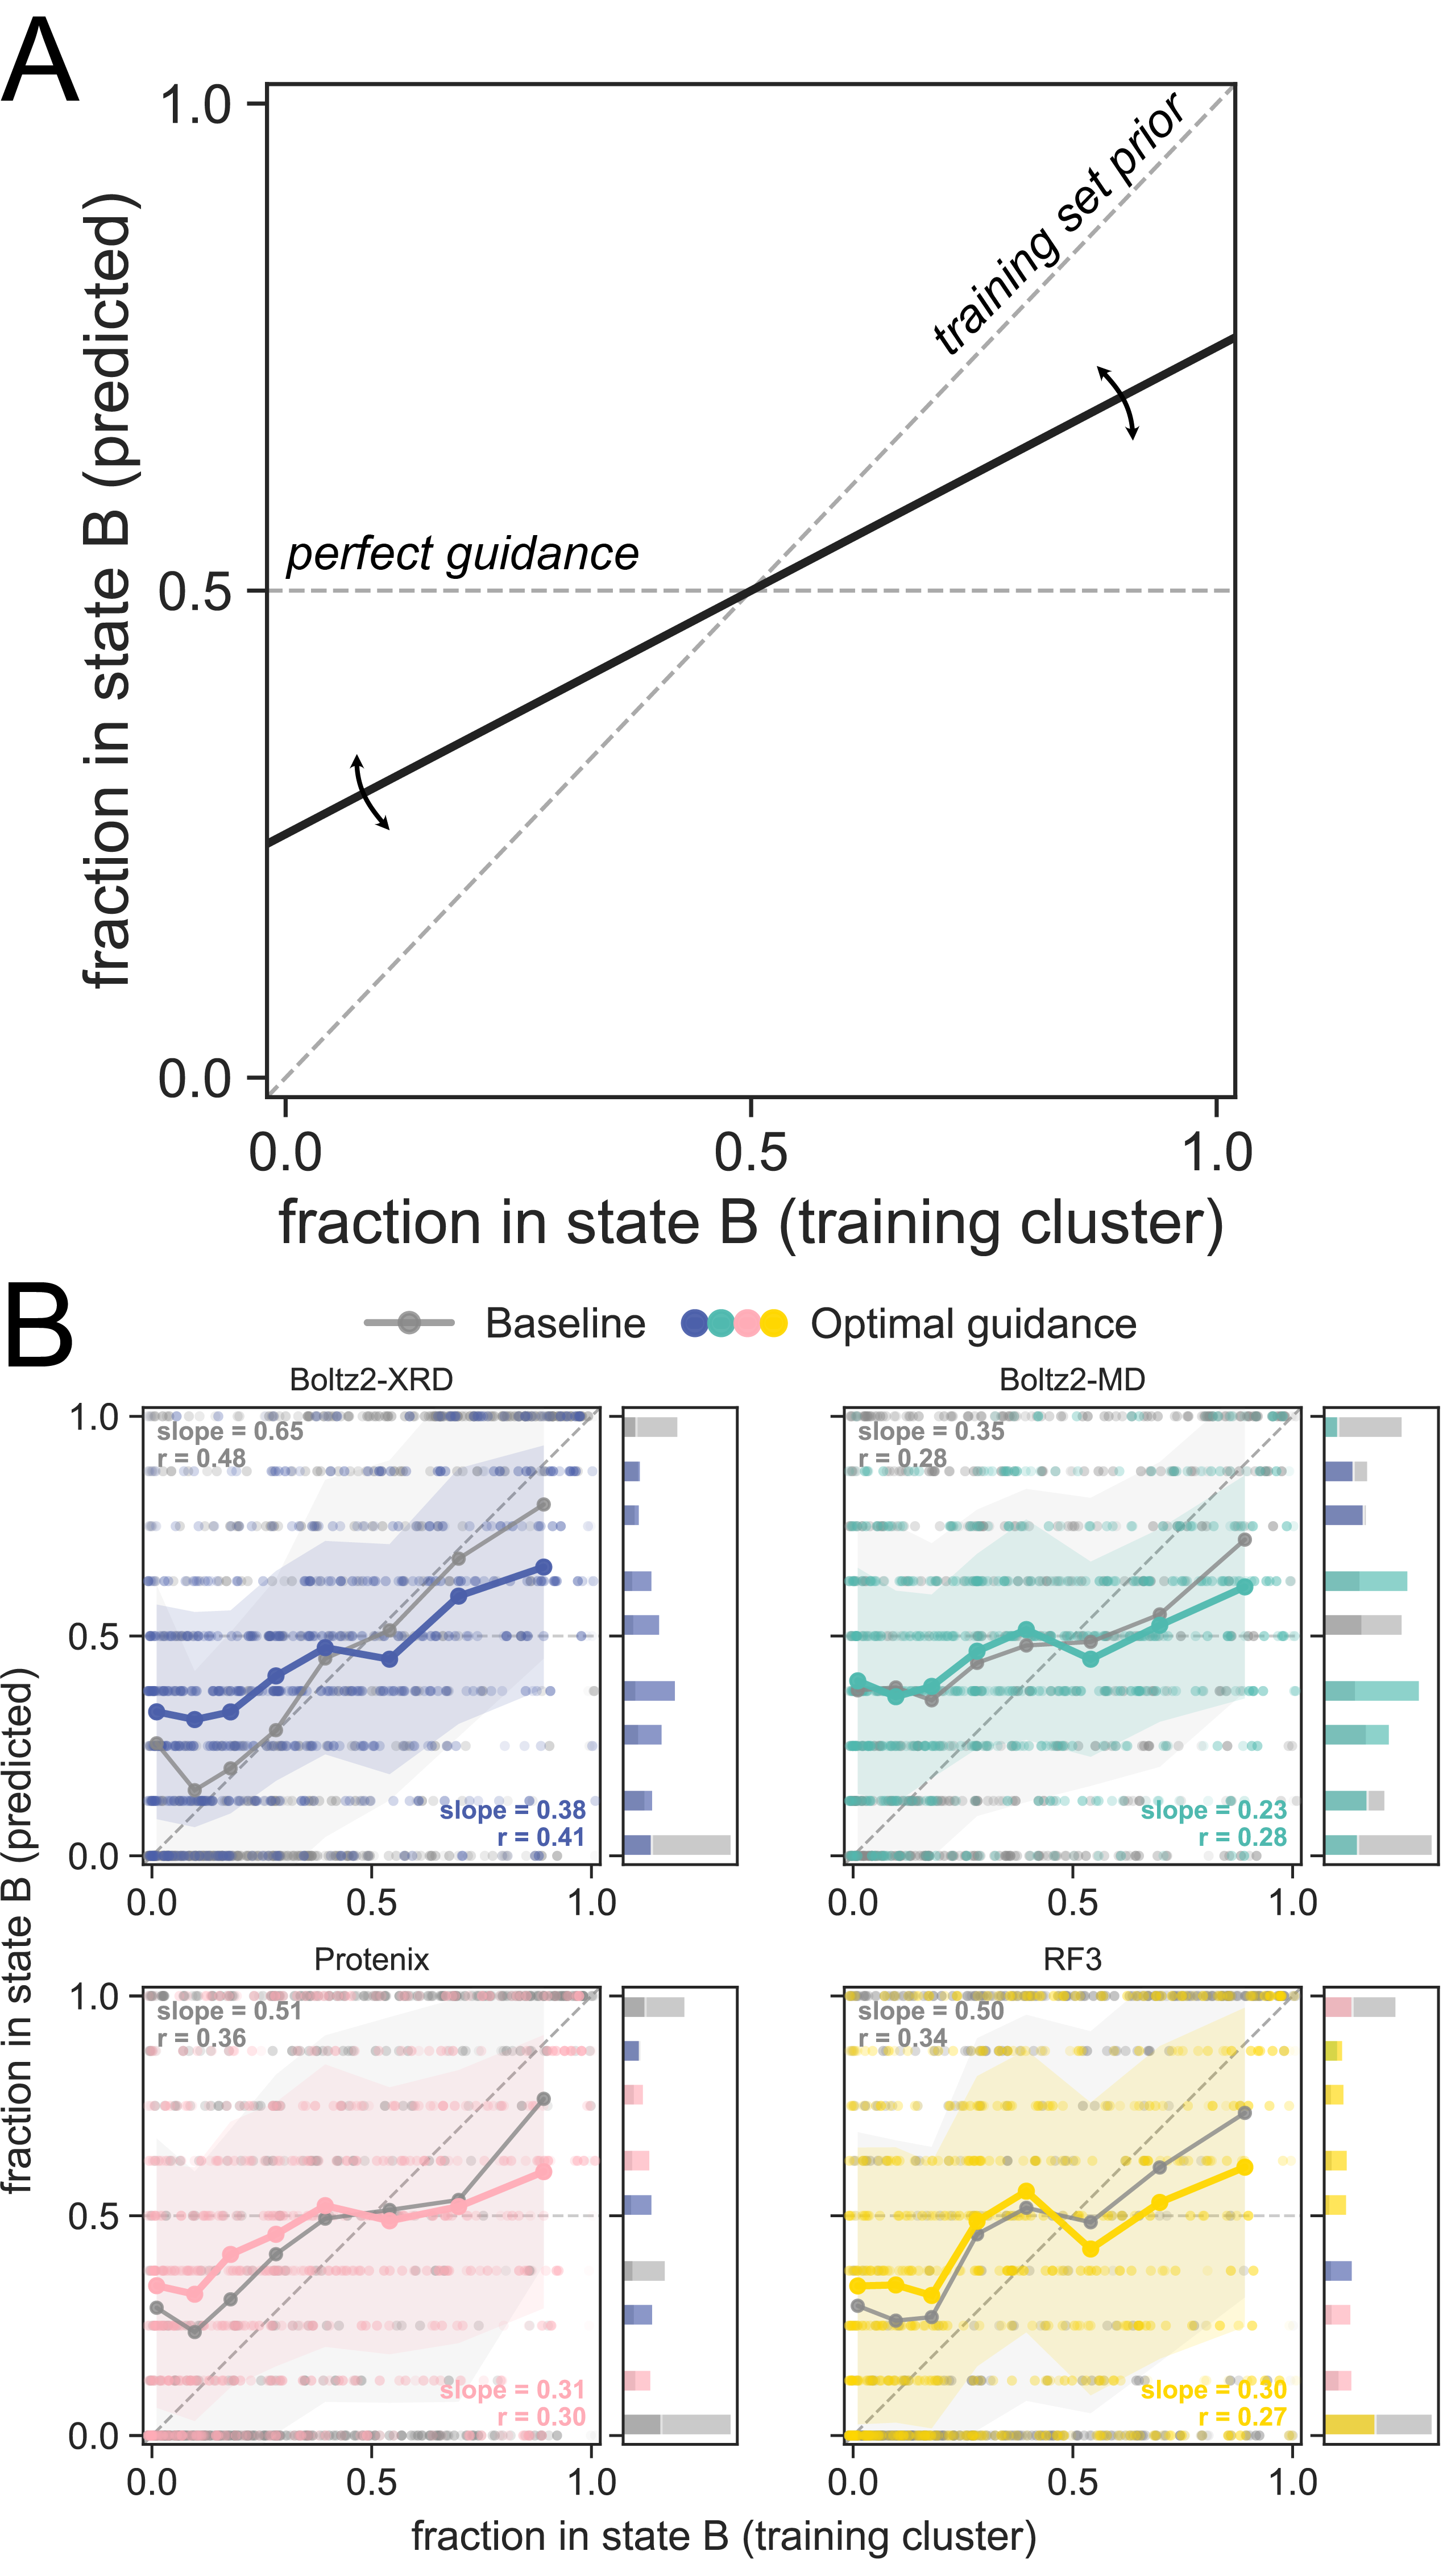
Figure 4. Figure 4: The training set distribution of conformations aligns with guided ensemble state occupancies.
A) A predictor that produces a flat line produces ensembles that are evenly split between altloc A and altloc B, while a predictor producing a line with positive slope is biased towards reproducing the training set distribution of conformations. B) We plot the fraction of ensemble members closer to state B from each predictor (y-axis) against the fraction of the deposited structures in the training set closer to B (x-axis) for both the baseline predictions (gray) and the guided (color). Each predictor is biased towards the training set prior rather than producing an ensemble that agrees with guidance.
We suspected that the ability of a protein to be guided into density was partly a function of the structure predictor's training data composition. Specifically, some of the variation in model performance may reflect which alternative conformations are represented in training datasets. Since only a single conformer is retained during training (typically altloc A), alternative conformations are only included in training if they appear as the major conformation in a different deposited structure of the same protein. For example, in PTP1B (PDB ID 6B8X), the altloc B conformation for that specific training sample is removed during training data curation, yet this open conformation is well represented across many structures deposited from X-ray crystallography fragment-screening campaigns for this protein, in which the open state dominates 52.
To test how much the training dataset affects our ability to guide structure predictors toward density, we identified all structures within 40% sequence-identity training clusters for each target protein. For each altloc segment, we then calculate the number of structures that were closer to altloc A versus B (training cluster fraction). We expected that at baseline the models would reflect the conformational distribution from the training set (Figure 4A). If the predictors responded perfectly to guidance, we would expect that the models would reflect the equal mixture of both altloc A and altloc B in our guidance target map instead of the training cluster fraction. Perfect guidance performance would result in a flat line at 0.5 when the training cluster fraction is plotted against the predicted ensemble fraction (Figure 4A).
We observe that the baseline ensembles reflect a substantial bias towards the training set distribution of conformations (Figure 4B). When applying guidance, the trend towards matching the training cluster fraction is reduced, but the guided predictions still sample observed conformations in the training data more frequently, concluding that while guidance reduces bias, it does not eliminate it completely (Figure 4B). Here, Boltz-2 MD has the lowest slope, suggesting that the additional fine-tuning on molecular dynamics data increases "guidability". We hypothesize that the low conformational diversity in training ensembles causes models to "memorize" training conformations, limiting their ability to sample the deposited alternative conformations. This result suggests an origin for the differences in performance across segments and structure prediction methods.
Inconsistent gains across structure predictors highlight targeted strategies for future model development
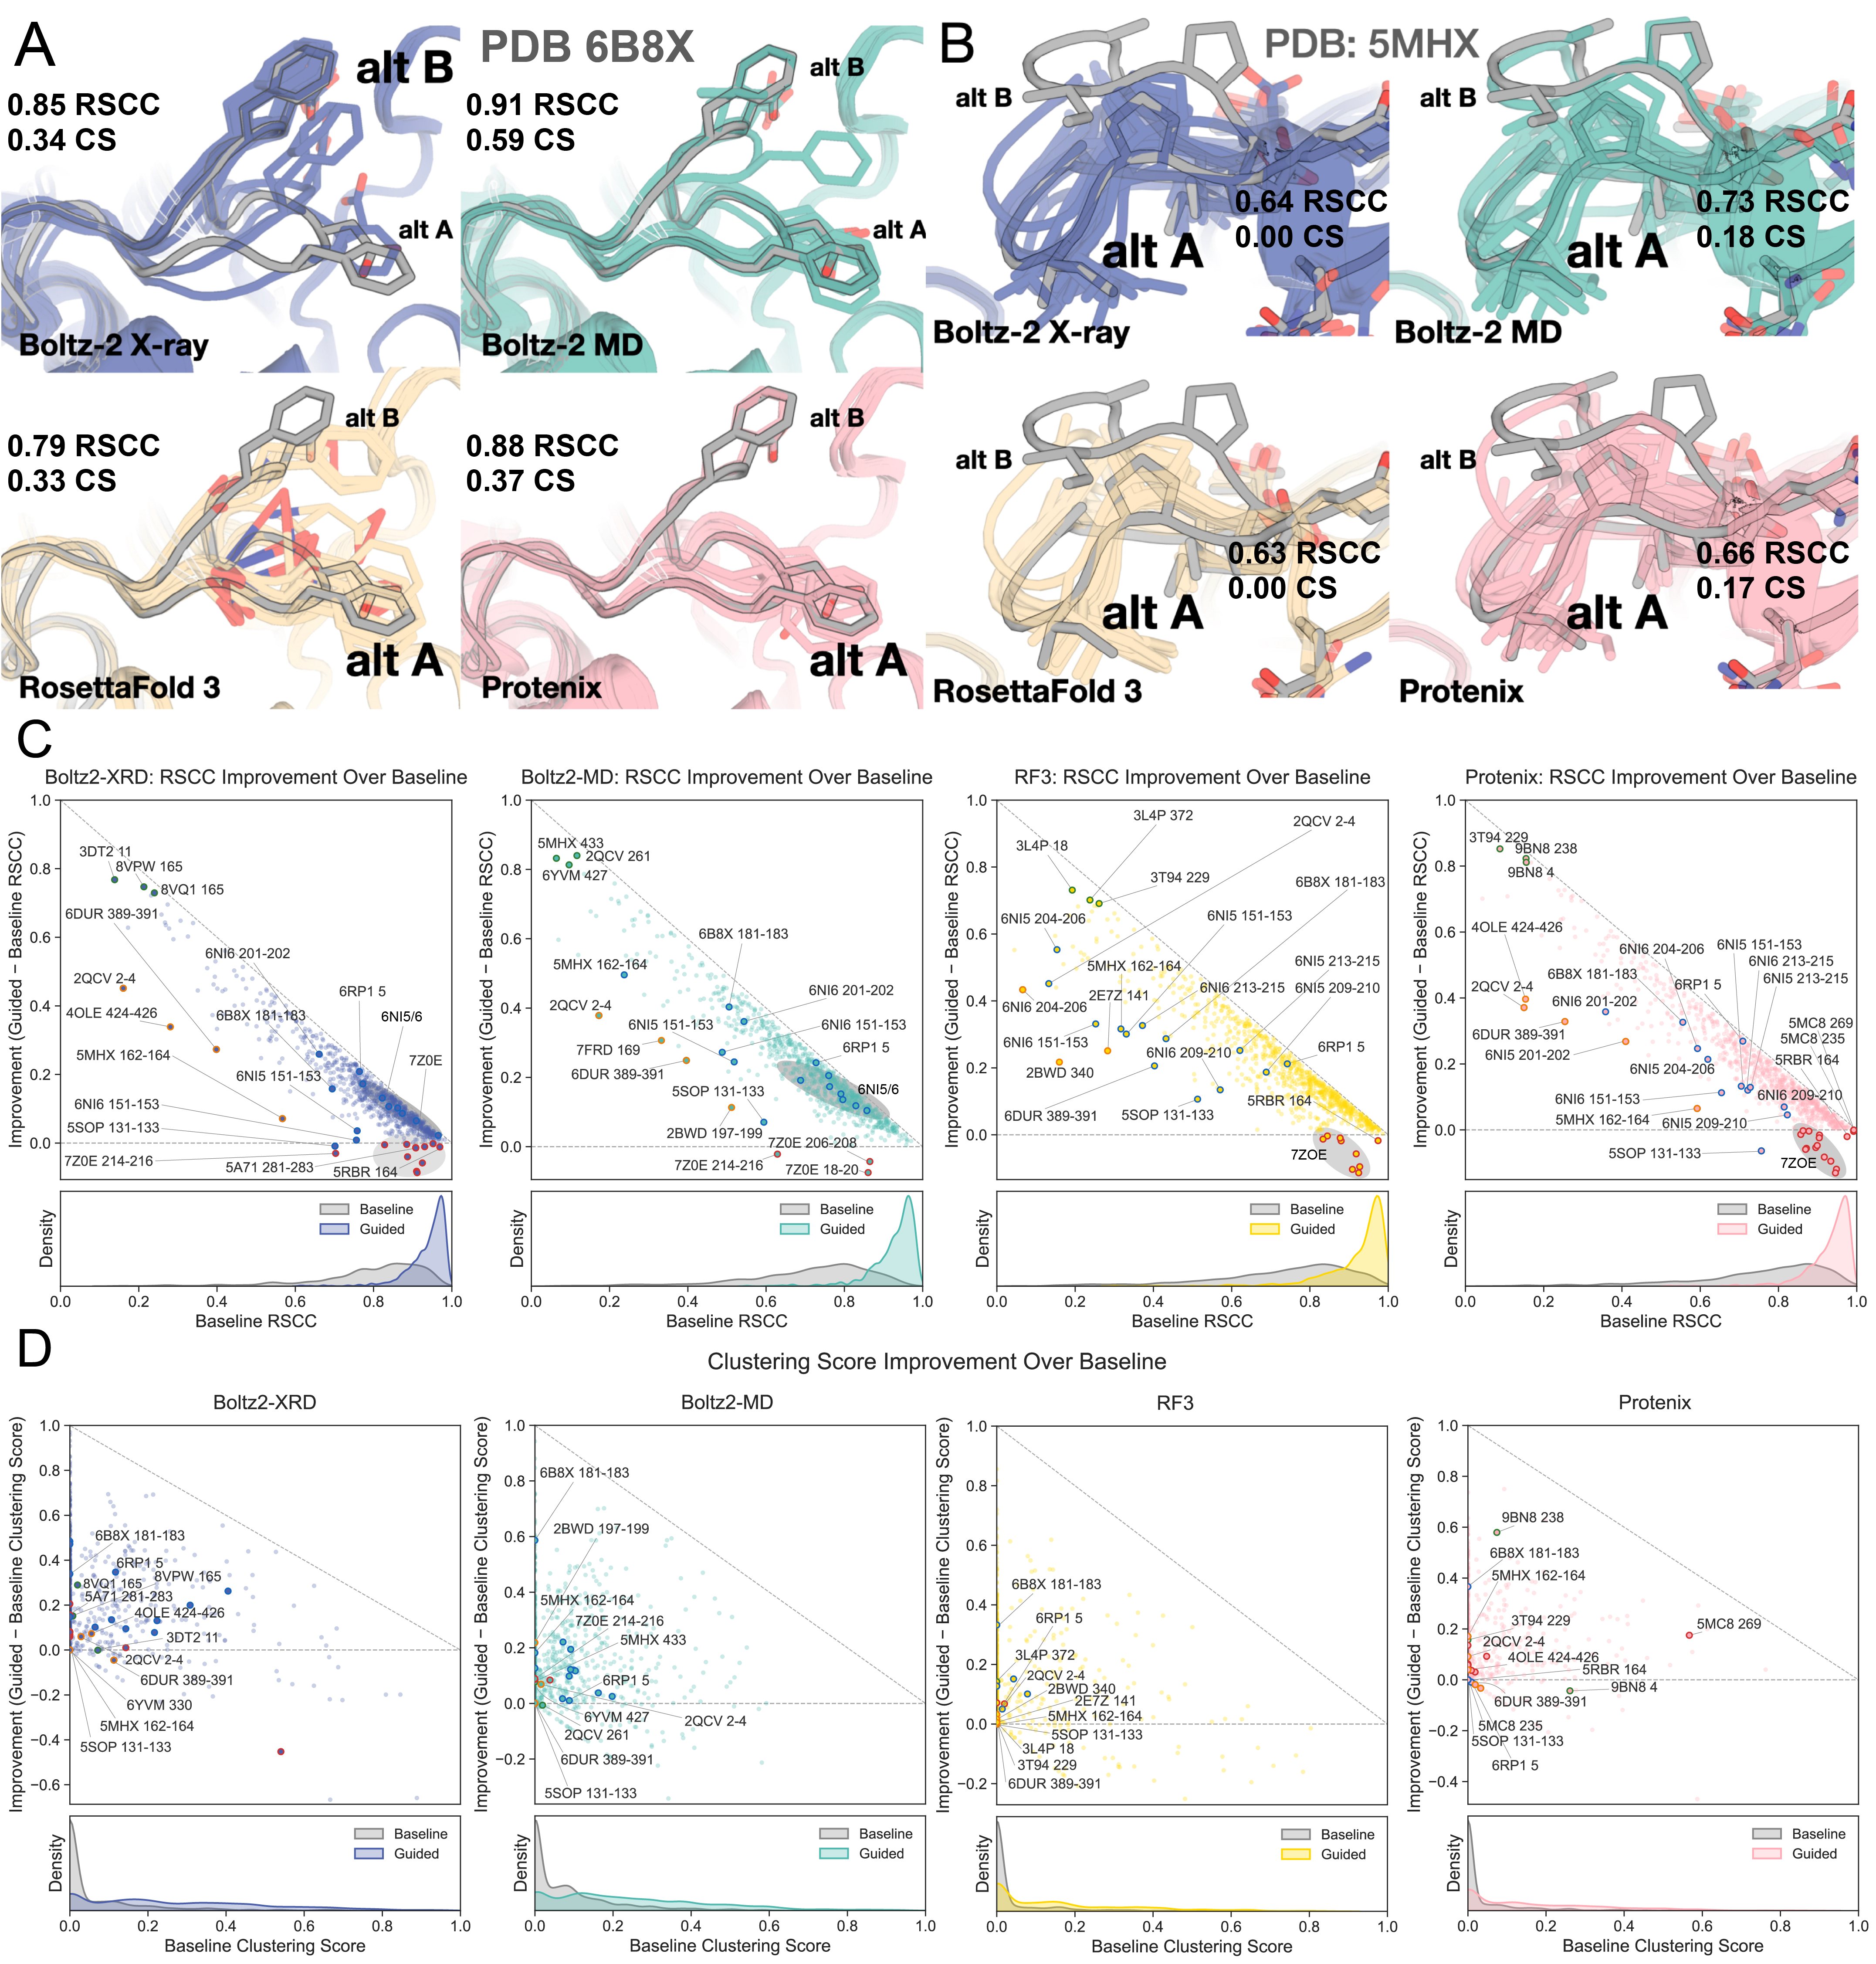
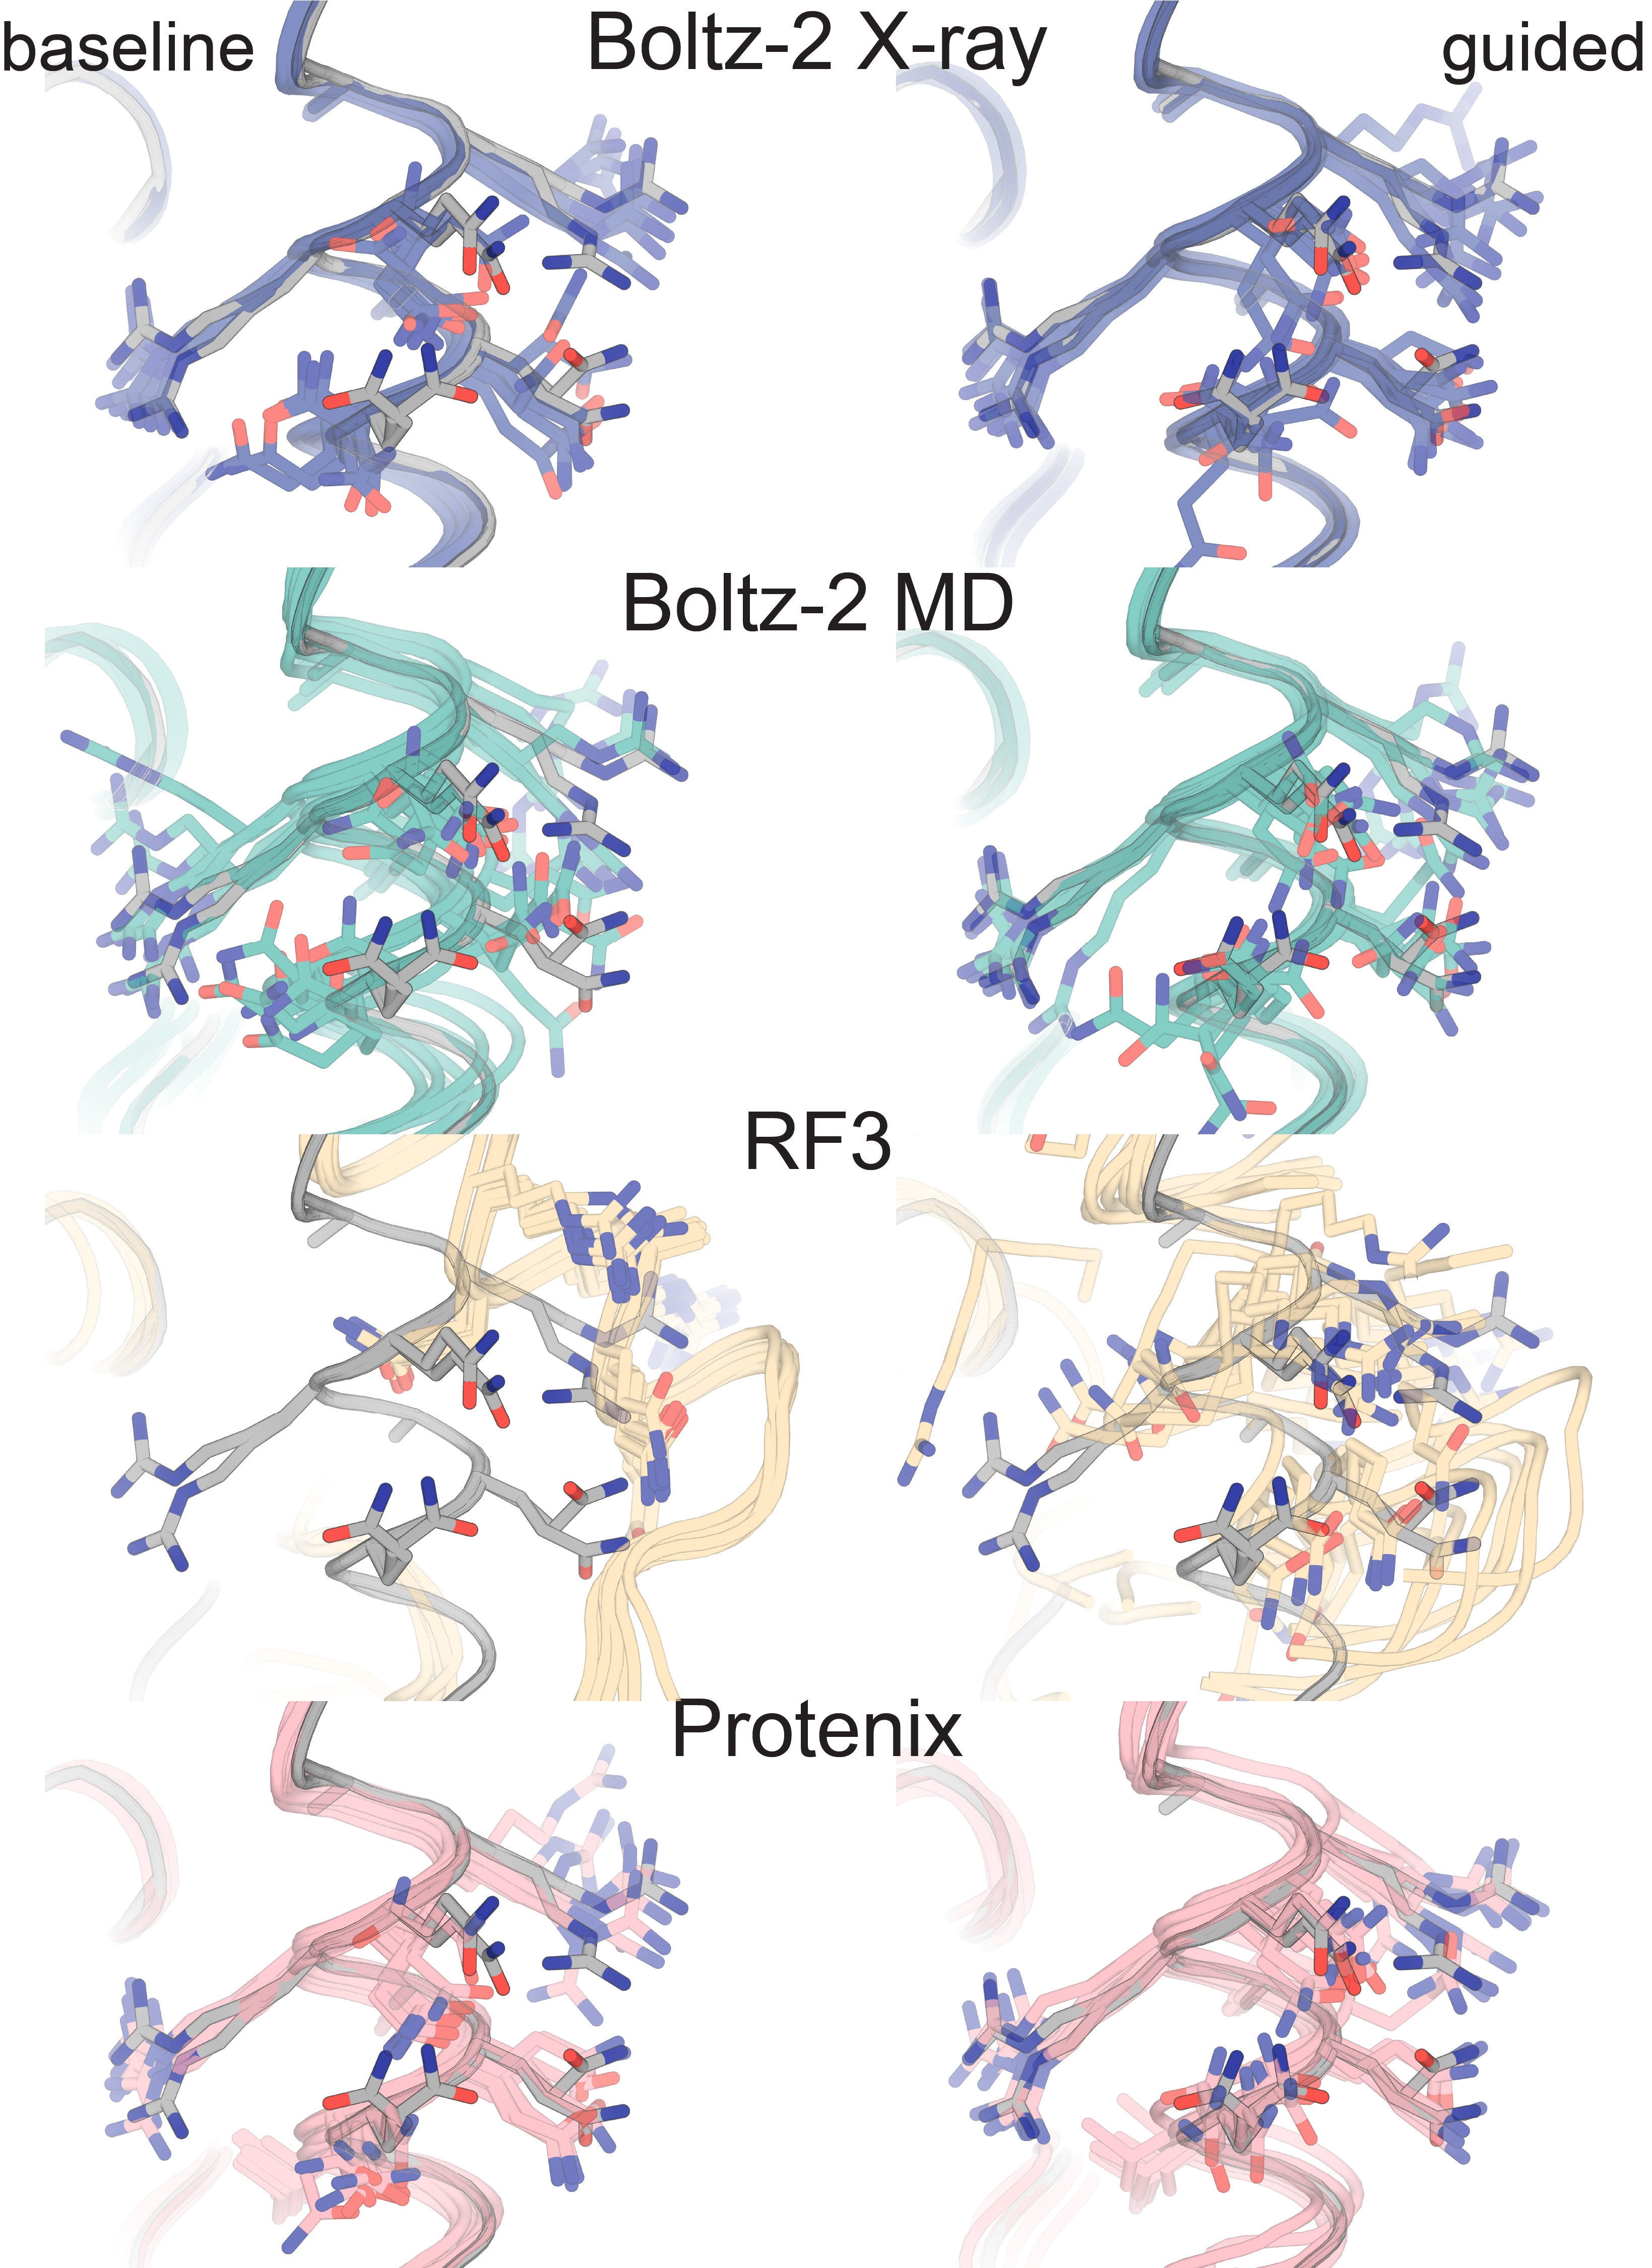
Figure 5. Figure 5: Between predictors, we observe differences in the improvement of RSCC for the same protein.
A) In PTP1B (PDB 6B8X 181-183), we observe that all structure predictors can capture A and B-like states. RSCC and clustering score shown. B) Only Boltz-2 MD captures the B altloc in PDB 5MHX 162-164, RSCC and clustering score shown as in A. C) The residual RSCC plot for each structure predictor demonstrates differences in performance across the same proteins. We highlight various points as in Figure 3: The green highlighted dots are cases where guidance improved the predicted ensemble the most. The orange highlighted dots are cases where the predictors are the furthest from the diagonal line (which indicates 1.0 RSCC), and thus have the most room for improvement. The red highlighted dots are cases where the RSCC decreases after guidance. Blue highlighted cases are additional proteins of interest discussed in the text. D) The residual Clustering Score plot for each structure predictor shows where improvements in RSCC are not related to corresponding improvements in clustering score. The colored highlights in this panel inherit their color from panel C. The highlighted blue points with no text label are from 6NI5 and 6NI6, and highlighted red points with no text label are from 7Z0E, which we avoid labeling for the sake of clutter.
Because of the differences in the training set bias between predictors in the previous section, we decided to explore in more detail how each structure predictor performed across all altloc selections. For example, in PTP1B (PDB 6B8X), we observe that while all guided ensembles contain members that adopt A-like and B-like conformations, clear biases similar to the unguided ensembles remain (Figure 5A). There is a bias towards alt B in Boltz-2 when run with the X-ray method conditioning. As in the unguided case, this is likely a result of the higher representation of the open state in the X-ray structures in the training set; however, guidance reduces that bias here. A similar bias towards alt A is retained in both RosettaFold 3 and Protenix. We also observe that most predictors fail to model the laccase (PDB 5MHX) well (Figure 5B). The exception is the ensemble from Boltz-2 with MD conditioning, which contains a single ensemble member overlapping with the B conformation.
We notice that most structure predictors respond well to cases whose deposited altlocs are nearly identical to each other and where the predicted ensemble already samples side chain conformations that fit the density. However, if the structure predictor cannot get either of the deposited altlocs, such as RF3 with 6NI5 and 6NI6, guidance is generally not able to recover the deposited conformations without degrading the geometry of the predicted guided ensemble (Supplementary Figure 9).
Overall, guidance improves the fit across all individual protein structure predictors (Figure 4C). We observe that the structure predictors do not yield the same results when guided with the same map on the same protein, often paralleling their differences at baseline. Outliers likely reflect biases in the training set (memorization), and the lack of generalization to alternative conformations suggests that ensemble guidance might be a sensitive method to detect paths to improve structure predictor performance.
Discussion
Here, we present sampleworks, a piece of infrastructure to accelerate biomolecular ensemble prediction enhanced by experimental data. Experiments and evaluations in sampleworks are straightforward, and it is accompanied by a thorough design document (see Github). We have engineered this platform to enable others to contribute and build upon it for further algorithmic development and experiments.
Using the sampleworks' platform, we compared the ability of different structure predictors to generate conformational ensembles guided by simulated experimental data. As observed by other methods 26, 28–29, 31, we obtained improvement in the fit to density maps when using density map guidance. However, structure predictors differ how well they respond to guidance to generate ensembles for different segments. Guidance algorithms assume that diffusion models can be interpreted as implicitly defined priors and therefore used to solve posterior sampling problems. However, our results suggest that these priors are biased towards what exists in the training dataset and cannot yet be generalized to fit physically plausible solutions supported by the experimental data. Even for the simplified task of fitting synthetic electron density maps, current AlphaFold 3-like structure predictors cannot reliably generate the experimentally observed, nearly isoenergetic conformations of a protein. Others have had some success with latent-space optimization and related techniques, but these have yet to be systematically tested across structure predictors 27–28, 30.
Our results point to the value of considering alternative conformations in designing both training and validation sets to encourage physical validity and plausible conformational sampling. Because many alternative conformations are "in distribution" in a physical sense but "out of training set" in a data sense, they represent an untapped source of conformational variability for training the next generation of predictors. Additional strategies to enhance balance between the multiple conformations of single proteins in the training set might be useful. An example strategy is used by BioEmu 18 where training is biased to sample based on conformational diversity, not solely on representation in the PDB. Other data augmentation approaches and the use of MD simulations seem similarly promising. Indeed, Boltz-2 with MD conditioning had superior results for some proteins than the default X-ray conditioning. It is likely that structure predictors trained on datasets designed to break the single-sequence-to-single-structure paradigm will help produce predictors that are more easily guided. We envision that the guidance methods implemented in sampleworks can be used to guide a more "adventurous" structure predictor to maintain consistency with experimental data, and the effectively regularized outputs can be used for additional rounds of structure predictor training. As an added benefit, the new structure/ensemble predictors trained on the ensemble prediction task should also fit the experimental data better than any existing single-structure predictors. Longer term, reframing the prediction task to reflect new data sources that directly measure the ensemble will be necessary, along with approaches to quantify the sources of variation in the ensemble outputs 42, 55–56.
In the current work, we exclude all ligands and binding-induced conformational changes (except 5SOP) and limit predictions to a single chain. Expanding our dataset to include multiple chains and ligands is a high-priority future direction. Dealing with compositional heterogeneity remains a distinct challenge. In the one case where we include a conformation that co-occurs with a ligand binding event (5SOP), the ligand is partially occupied, meaning that not all copies of the protein are bound to the ligand after the ligand is soaked into the crystal. Occupancy is not explicitly exposed to current structure predictors, so all atomic coordinates in the training structure are assumed fully present. In fragment screening campaigns, which make up a large and rapidly growing fraction of structures in the PDB 57–58, the deposited ligands are often at partial occupancy. In such cases, compositional heterogeneity (the ligand not being fully present) is convolved with conformational heterogeneity in both the ligand and protein. This complicates both the modeling and the guidance. A multiconformer representation with explicitly modeled occupancies might be better suited to this setting than a fixed-size multi-copy ensemble that represents full occupancy of all atoms 48. Applying guidance in this scenario will require thinking creatively about how to best incorporate heterogeneity in the inference procedure. We are excited for the field to stress test these capabilities that are particularly relevant to ligand co-folding and affinity prediction.
We expect that latent-space optimization techniques might be inherently superior to the diffusion guidance used here. Roughly speaking, larger loop movements may be difficult to achieve with real space guidance and diffusion posterior sampling, because the atoms to displace must first traverse through a region where there is no electron density. The necessity of traversing intermediates that are not supported by the density resembles a sort of "activation barrier" that might be more easily overcome in the latent space. We will evaluate this hypothesis systematically in future work, but others have reported some success with latent space inference-time optimization 27, 30. An alternative path to counter the "memorization" we observe here is to use smaller models, such as RFDiffusion 3 59 or Protpardelle-1c 60. These models may have poorer performance in single structure prediction tasks, but improved ability to respond to guidance for ensembles. Testing these ideas is made much more simple in the sampleworks framework.
Conclusion
sampleworks provides a platform for accelerating the development and benchmarking of structure predictors used in tandem with experimental data. As an example of the types of evaluations that can be done with sampleworks, we test performance of multiple structure predictors on capturing deposited alternative conformations from the PDB under density guidance, and reveal weaknesses in structure predictors that suggest avenues for new training paradigms for structure ensemble predictions. We also observe differences in which proteins we can successfully guide towards alternative conformations using the density. We demonstrate that predicted ensembles recapitulate training set trends (memorization) rather than generalizing to the true distribution of structural states and their associated likelihoods. sampleworks is an important step towards augmenting our predictive and modeling methods to reflect the ensembles in experimental measurements. We hope sampleworks proves useful for the machine learning and structural biology community.
Methods
The codebase is hosted on GitHub (DOI: 10.5281/zenodo.20584989).
Our pipeline for applying guidance across models was implemented in sampleworks. We detail the design of sampleworks and describe how we implement ModelWrappers in the separately attached design document.
Models
For the evaluation presented here, we ran 5 different model checkpoints in the Boltz, Protenix, and RosettaFold 3 model families through guidance. Each model was run using the default featurization pipeline, which means that for Boltz, MSAs were generated using the ColabFold server. Protenix has its own MSA server, which we opted to use to maintain as close a match to the original inference procedure as possible. RF3 does not provide MSA generation in their repository, so we used the cached ColabFold MSAs from Boltz during inference.
| Model | Checkpoint | Recycles | Sampling steps | Guidance weight | Other configuration |
|---|---|---|---|---|---|
| Boltz-2 | boltz2_conf | 3 (default) | 200 | 0.1 | MD, X-RAY DIFFRACTION method conditioning |
| Protenix | protenix_base_default_v0.5.0 | 10 | 200 | 0.1 | |
| Rosetta Fold 3 | rf3_foundry_01_24_latest_remapped | 10 | 200 | 0.01 | |
| Protenix-Mini (Supplement) | protenix_mini_default_v0.5.0 | 10 | 200 | 0.1 | |
| Protenix-Tiny (Supplement) | protenix_tiny_default_v0.5.0 | 10 | 200 | 0.1 |
Each model was sampled from using the default parameters specified in the AlphaFold 3 supplement, except for , which we set to 0.2 instead of 1.0. This means slightly more stochasticity was used during sampling than the default Karras et al. sampler. Additionally, given the larger trunk of Boltz-2, we use their default number of recycles (set to 3). During inference, we apply the random augmentation as described in AlphaFold 3 and then align the coordinates to the initial coordinates before computing the loss and applying guidance. We also apply alignment of the noisy coordinates to the denoised coordinates during Boltz-2 inference, which is detailed in their paper 46. We do not apply this to the other models.
To generate an ensemble, we simply use the batch dimension. Here, a structure consists of a set of coordinates, elements, occupancies, and B-factors describing all heavy atoms in a given protein sequence. We set the occupancies, which are per-atom scalars that mark the atom's contribution to the density given the B-factor, to uniformly sum to one across the ensemble. The B-factors, which typically describe harmonic thermal motion of atoms that spread the density, are set to 20. The ensemble, then, is a collection of arrays describing these properties, each with batch size of 8.
Dataset
The dataset we used consists of forty structures gathered from the PDB. All structures were solved using X-ray crystallography. We detail the attributes of each structure in the table below.
| PDB_ID | Pre_post_cutoff | Resolution | Rfree (deposited) | Rfree (re-refined) |
|---|---|---|---|---|
| 8VPW | Post | 1.3 | 0.152 | 0.1529 |
| 8VQ1 | Post | 1.3 | 0.1713 | 0.1689 |
| 8Z76 | Post | 1.8 | 0.21728 | 0.2004 |
| 9BN8 | Post | 1.35 | 0.1575 | 0.1587 |
| 2I6H | Pre | 1.75 | 0.1992 | 0.1975 |
| 2IGT | Pre | 1.89 | 0.19236 | 0.1961 |
| 2E7Z | Pre | 1.26 | 0.19512 | 0.1740 |
| 2P97 | Pre | 1.65 | 0.189 | 0.1986 |
| 2QCV | Pre | 1.9 | 0.196 | 0.1933 |
| 3HYN | Pre | 1.2 | 0.139 | 0.1448 |
| 3I7M | Pre | 1.46 | 0.198 | 0.1910 |
| 3IAC | Pre | 2.22 | 0.18094 | 0.1939 |
| 6RP1 | Pre | 1.49 | 0.15302 | 0.1461 |
| 3DT2 | Pre | 1.5 | 0.185 | 0.1660 |
| 4GMU | Pre | 1.2 | 0.1958 | 0.1617 |
| 7AVG | Pre | 1 | 0.1341 | 0.1359 |
| 7P6M | Pre | 0.89 | 0.1531 | 0.1336 |
| 5MHX | Pre | 1.35 | 0.14385 | 0.1247 |
| 2XLW | Pre | 1.17 | 0.191 | 0.1868 |
| 2YL0 | Pre | 0.95 | 0.14968 | 0.1553 |
| 5I09 | Pre | 1.44 | 0.1663 | 0.1589 |
| 7Z0E | Pre | 1.22 | 0.1951 | 0.2524 |
| 2BWD | Pre | 1.15 | 0.144 | 0.1567 |
| 7FRD | Pre | 1 | 0.162 | 0.1519 |
| 5RBR | Pre | 0.9 | 0.1553 | 0.1445 |
| 2A26 | Pre | 1.2 | 0.19833 | 0.1873 |
| 5IMV | Pre | 1.05 | 0.1474 | 0.1464 |
| 3HVV | Pre | 1.75 | 0.19526 | 0.2191 |
| 3L4P | Pre | 1.45 | 0.166 | 0.1538 |
| 3T94 | Pre | 1.452 | 0.1853 | 0.1641 |
| 5A71 | Pre | 0.91 | 0.13197 | 0.1444 |
| 5MC8 | Pre | 1.18 | 0.15749 | 0.1574 |
| 6B8X | Pre | 1.74 | 0.2059 | 0.2073 |
| 6DUR | Pre | 1.8 | 0.1933 | 0.2123 |
| 6NI5 | Pre | 1.3 | 0.1519 | 0.1547 |
| 6NI6 | Pre | 1.201 | 0.1398 | 0.1448 |
| 6YVM | Pre | 1.25 | 0.1581 | 0.1474 |
| 1VME | Pre | 1.8 | 0.229 | 0.1896 |
| 5SOP | Pre | 1.05 | 0.173 | 0.1601 |
| 4OLE | Pre | 2.52 | 0.194 | 0.2065 |
We classify all altloc segments in each of the forty structures by the type of conformational change. The side chain only class corresponds to cases where only side chain atoms of a residue have altloc labels. The small loop class corresponds to cases where backbone atoms have altloc labels and the all-atom LDDT between the two altlocs is >0.75. The large loop class takes the remaining cases <=0.75 LDDT. There is one structure with a domain shift, which is classified separately.
Dataset processing
All the structures we gathered from the PDB were stripped of ligands and solvent for this evaluation, and we aim to expand to testing ligand induced conformational changes soon. We also took only a single chain, opting for the chain with the most altlocs if they differed between chains, and the first chain alphabetically otherwise. We removed all instances of proteins where ligands or another polymer chain were clearly the cause of the conformational change (e.g. clashing) except for 5SOP, which we discuss in the text.
We compute synthetic density maps from all altlocs in the structure processes as described above using the synthetic density generation algorithm described below. We generated density maps first for uniform occupancy over all alternative conformations present in the structure. We then generated synthetic maps for occupancy sweeps, where we took just altloc A and B, and started at 0.0 occupancy in A and 1.0 occupancy in B, and transitioned to 1.0 occupancy in A and 0.0 occupancy in B in 0.25 occupancy increments.
All density maps were generated at a 1.00 Å resolution.
In a given guidance run, we provide the map and initial structure (parsed with altloc="first" in the Biotite loading, meaning that only altloc A is present). This initial structure is noised to obtain the partially noised structure at reverse time 0.6, meaning step 120/200 when we run with 200 steps in the sampler. The standard deviation of the noise at this scale is ~18 Å. The noised initial structure is passed to the model in the guidance loop as the initial state. We also use the clean initial structure as an alignment reference during inference as mentioned in the models section. Sometimes, the model deposited in the PDB has unmodeled residues. In those cases, we generate the full set of heavy atoms given the sequence and match those atoms to the ones in the initial structure. We only use existing coordinates in the alignment operation.
Guidance
We apply guidance after partial noising of an initial structure to time step 120/200. We apply guidance in the noised space, meaning that we compute the loss on the denoised ensemble coordinates and then backpropagate through the model to the noised input coordinates. While this is more computationally expensive than doing guidance in the data space, we noticed much improved performance (and this is also what was done in related work, see 29). We apply two approaches to manage the gradient of the real-space loss function: we first normalize the gradient magnitude to that of the denoising update in the EDM sampler, and then we scale that using a guidance strength parameter. This parameter is what we change when we scan across that hyperparameter to find the optimal guidance strength.
It is important to distinguish that here, we are asking the models to recapitulate the voxel values in the density exactly when using the MSE as the loss function in guidance. This means that the models will be penalized for putting too many atoms in the ensemble in one conformation over the other - we need to match the occupancy of each conformation, not just the presence of any given conformation.
Synthetic density calculation
We calculate density maps using the commonly used approximation of 5 Gaussians centered on each atomic coordinate each scaled according to empirically derived coefficients defined in 61. To accomplish density guidance with a low memory burden over the structure prediction model, we implemented a CUDA kernel that computes each atom's contribution to the density in each voxel. We implement our framework in PyTorch and make the custom CUDA kernel available as a PyTorch extension. This CUDA kernel parallelizes the computation used in earlier work 11.
Evaluation Metrics
sampleworks uses a variety of standard protein structure evaluation metrics, and introduces a clustering score to capture how well any given ensemble reflects the ground truth ensemble when one is available. We start by covering the standard geometric metrics, then discuss how we apply real space correlation coefficients, and finally describe our approach to clustering the ensemble and measuring its similarity to the ground truth.
Protein Structure Geometric Metrics
We run the command phenix.clashscore 62 from the Phenix package 63 on every structure model in a given ensemble generated by sampleworks. We average over the model scores to get an ensemble score, and average over the number of clashes in each model to obtain the ensemble number of bad clashes. According to the Phenix documentation, a bad clash is an atom pair overlap of 0.4 Å or more. The clashscore is:
We modified code from peppr (GitHub) to compute bond length and angle outliers. Again we report averages over the ensembles for the number of outliers in each case.
The geometry penalty, used in Figure 3 to decide on the optimal guidance strength, is computed as:
Each delta is between the predicted baseline ensemble and the predicted guided ensemble at the specified guidance strength.
Real Space Correlation Coefficients
We compute standard real-space correlation coefficients between a map generated from the ensemble of structures and the target map that was used for guidance. This uses the same forward calculation that is used in the guidance procedure. (See Synthetic Density Calculation, above). In the evaluation stage we compute the correlation coefficient over voxels of the map within 2.0A of any atom center of a selection. In this way we avoid including any parts of the protein which are nearby but don’t display conformational heterogeneity, and which would increase RSCC trivially. For all RSCC calculations shown here, when an altloc segment contains more than 3 residues, we select all atoms in the 3 residue subsegment that maximizes RMSD between the two altlocs we evaluate against. For 3 residues and below, we select all atoms in the residues in the altloc segment.
Local Distance Difference Test (lDDT) based clustering and evaluation
In order to evaluate how well generated ensembles capture the ground truth states, we developed a simple “clustering” technique and metrics. This procedure can indicate whether the ensemble shows multiple distinct states, and how well the conformers match the existing ground truth states. We do assume that the existing “altloc” conformations in a PDB entry are ground truth “states” for the purposes of this analysis.
First, we compute the lDDT 64 metric for each residue in the selection of interest for each conformer in the ensemble, using all available altlocs as references. So, if the generated ensemble has 8 conformers, and there are two altlocs in the reference structure for the selection of interest, we have 8 x 2 =16 total lDDT calculations. Each generated conformer is assigned to the closest altloc structure.
From this "nearest neighbor" assignment we compute something similar to a silhouette score 65, referred to in the main text as the clustering score. In this case, we simply compute the "distance" to the nearest and next-nearest cluster center, for each conformer. We report the silhouette score based on these as the average over the all clusters. Formally the calculation is , where the cluster centers are the ground truth altloc conformers, and the mean is over the conformers. (The lDDT statistic itself is already an average over the selected residues).
Then, when we report the clustering score, we report this score multiplied by the minimum occupancy of the two states in the generated ensemble divided by the expected occupancy in the map (which is 0.5 in all cases here).
Supplementary Figures
Supplementary Figure 1: Cases that appear easier to guide to fit the density are typically where the original conformation was missed, not because both conformations were sampled
The cases where the predictors improve most over the baseline are those where the conformation is close to correct in the baseline ensemble, but the baseline prediction is not aligned with the density. In some of these cases, even though the prediction then aligns well with the density, the alternate rotamers of the side‑chain altloc are not predicted correctly.
Supplementary Figure 2: Protenix-mini and -tiny do not appear more easily guided compared to the standard Protenix checkpoint
None of the Protenix models appear to have an improved response to guidance strength than the others, which would be indicated by a greater ∆RSCC alongside a lower guidance penalty.
Supplementary Figure 3: Mac1 Phe loop (5SOP) altloc B is not predicted by any models.
5SOP, a structure of Mac1 containing an open loop altloc, is only predicted in altloc A by all of the structure predictors. The altloc B conformation is not present in the training data.
Supplementary Figure 4: Geometry degradation occurs at high guidance weights
As the guidance strength increases from left to right for all models, the histidine ring in the guided ensemble gets further distorted.
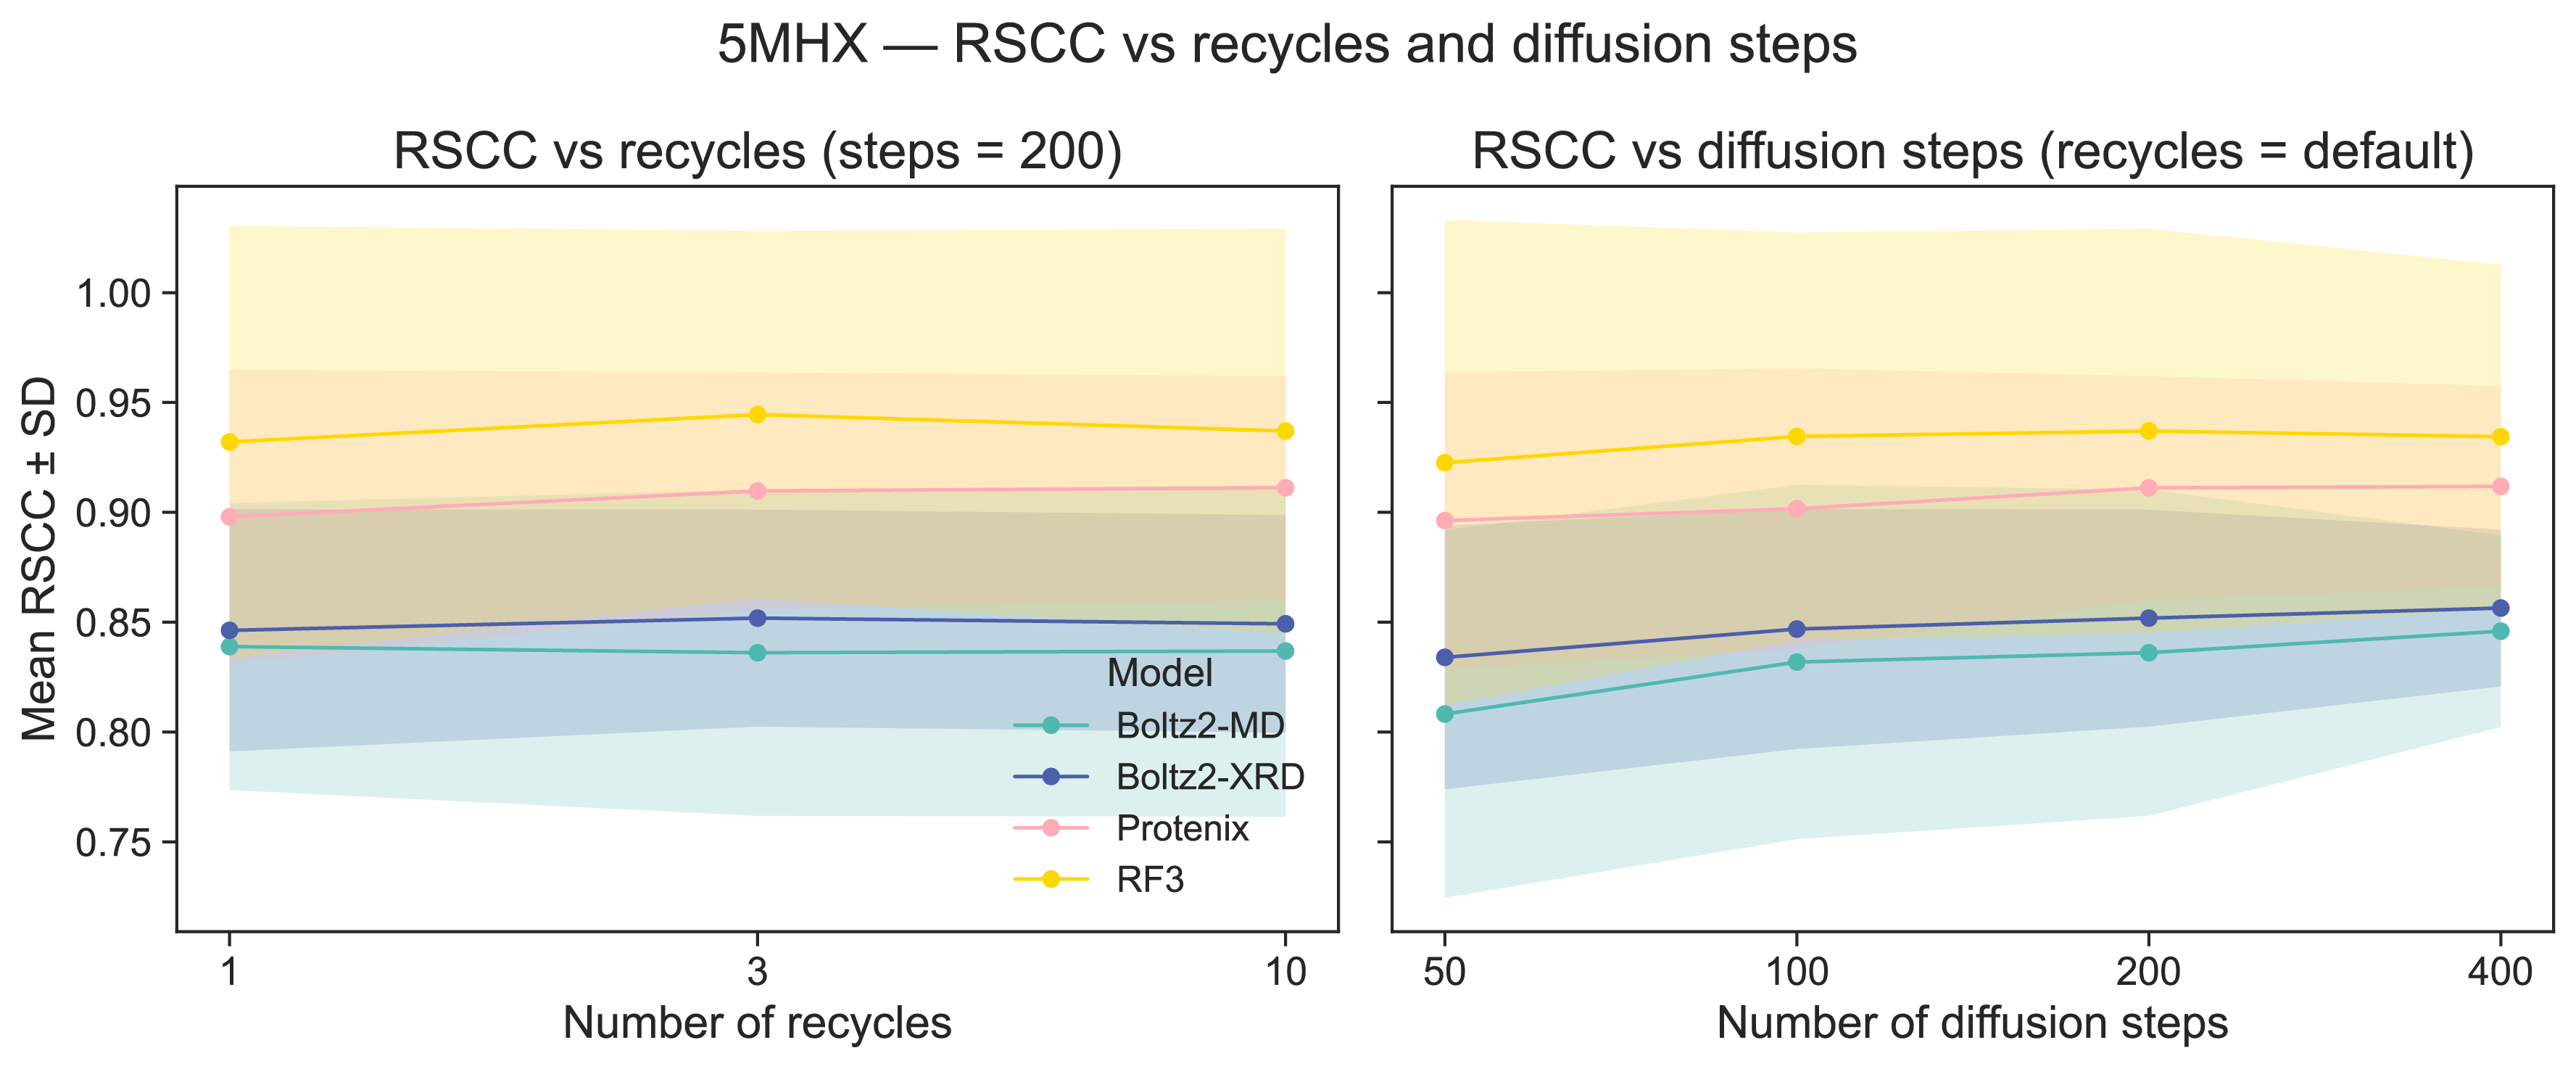
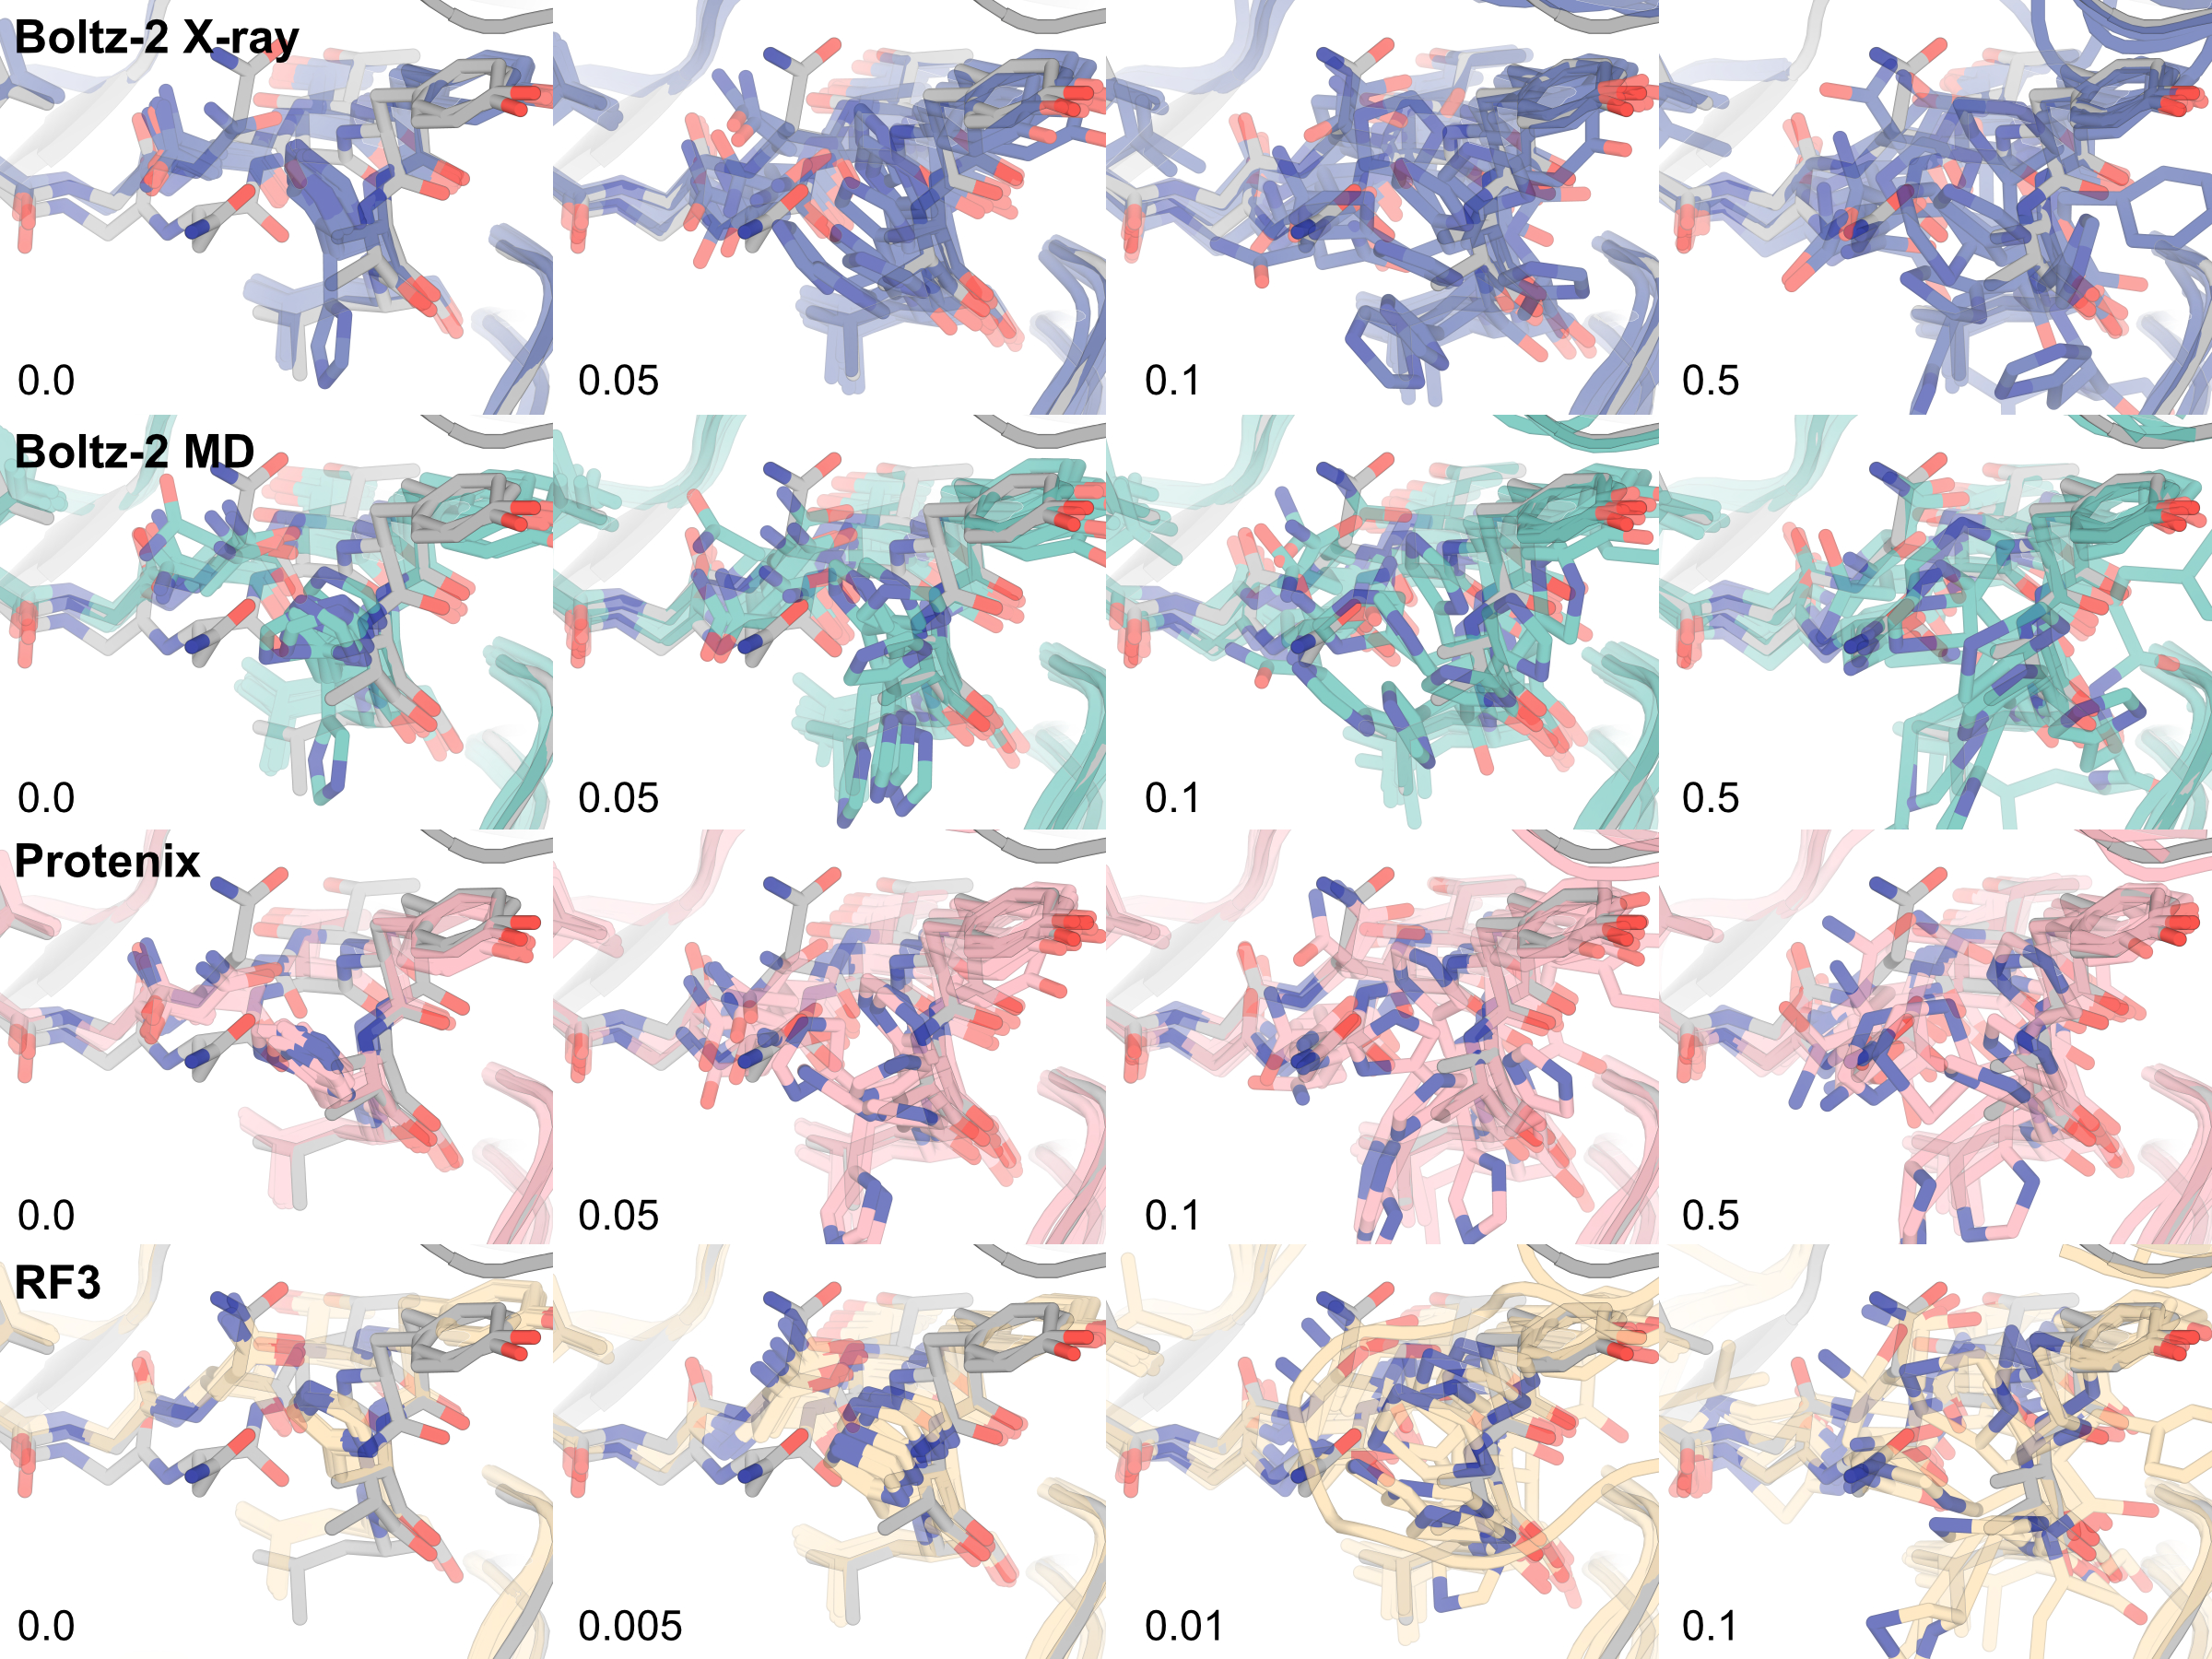
Supplementary Figure 5: Effects of increasing recycling and number of diffusion steps on RSCC in 5MHX
The number of pairformer recycles does not appear to significantly increase RSCC for any models, but increasing the number of diffusion steps does improve RSCC, perhaps by reducing the magnitude of the diffusion update such that it is more agreeable with the guidance update. Each point is the mean RSCC across 20 altloc selections in 5MHX
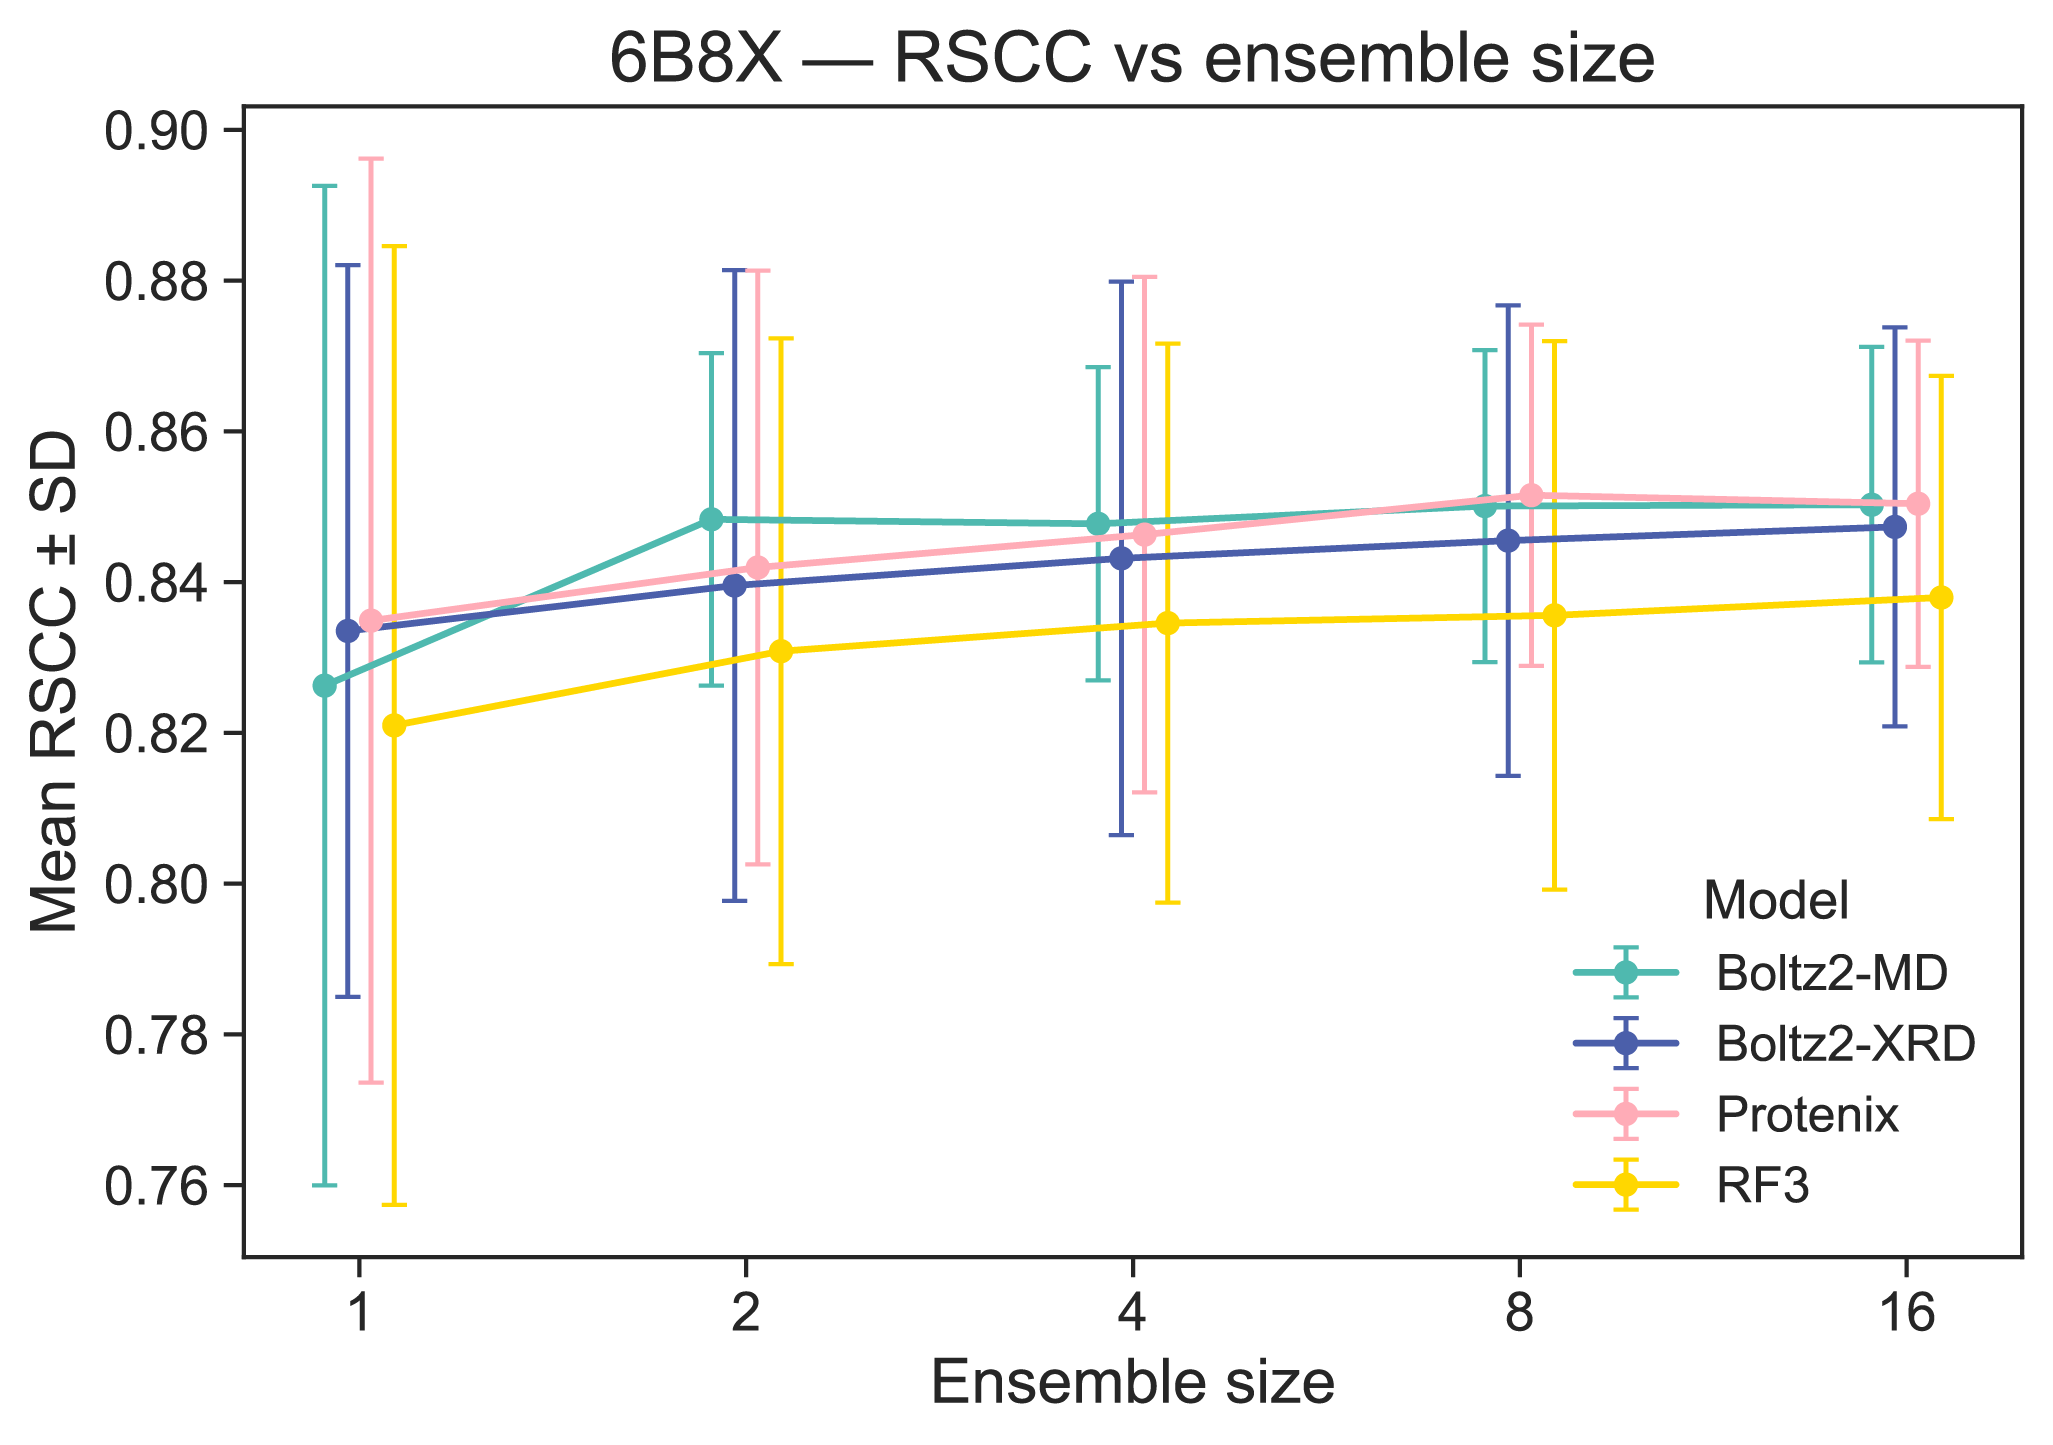
Supplementary Figure 6: Effects of ensemble size on RSCC and clustering score in 6B8X
Ensemble size appears to increase RSCC (as expected), but only up until ensemble size 8, which is what we elected to run in our evaluations. Increasing ensemble size also tightens the RSCC distribution. Each point is the mean RSCC across 32 altloc selections in 6B8X.
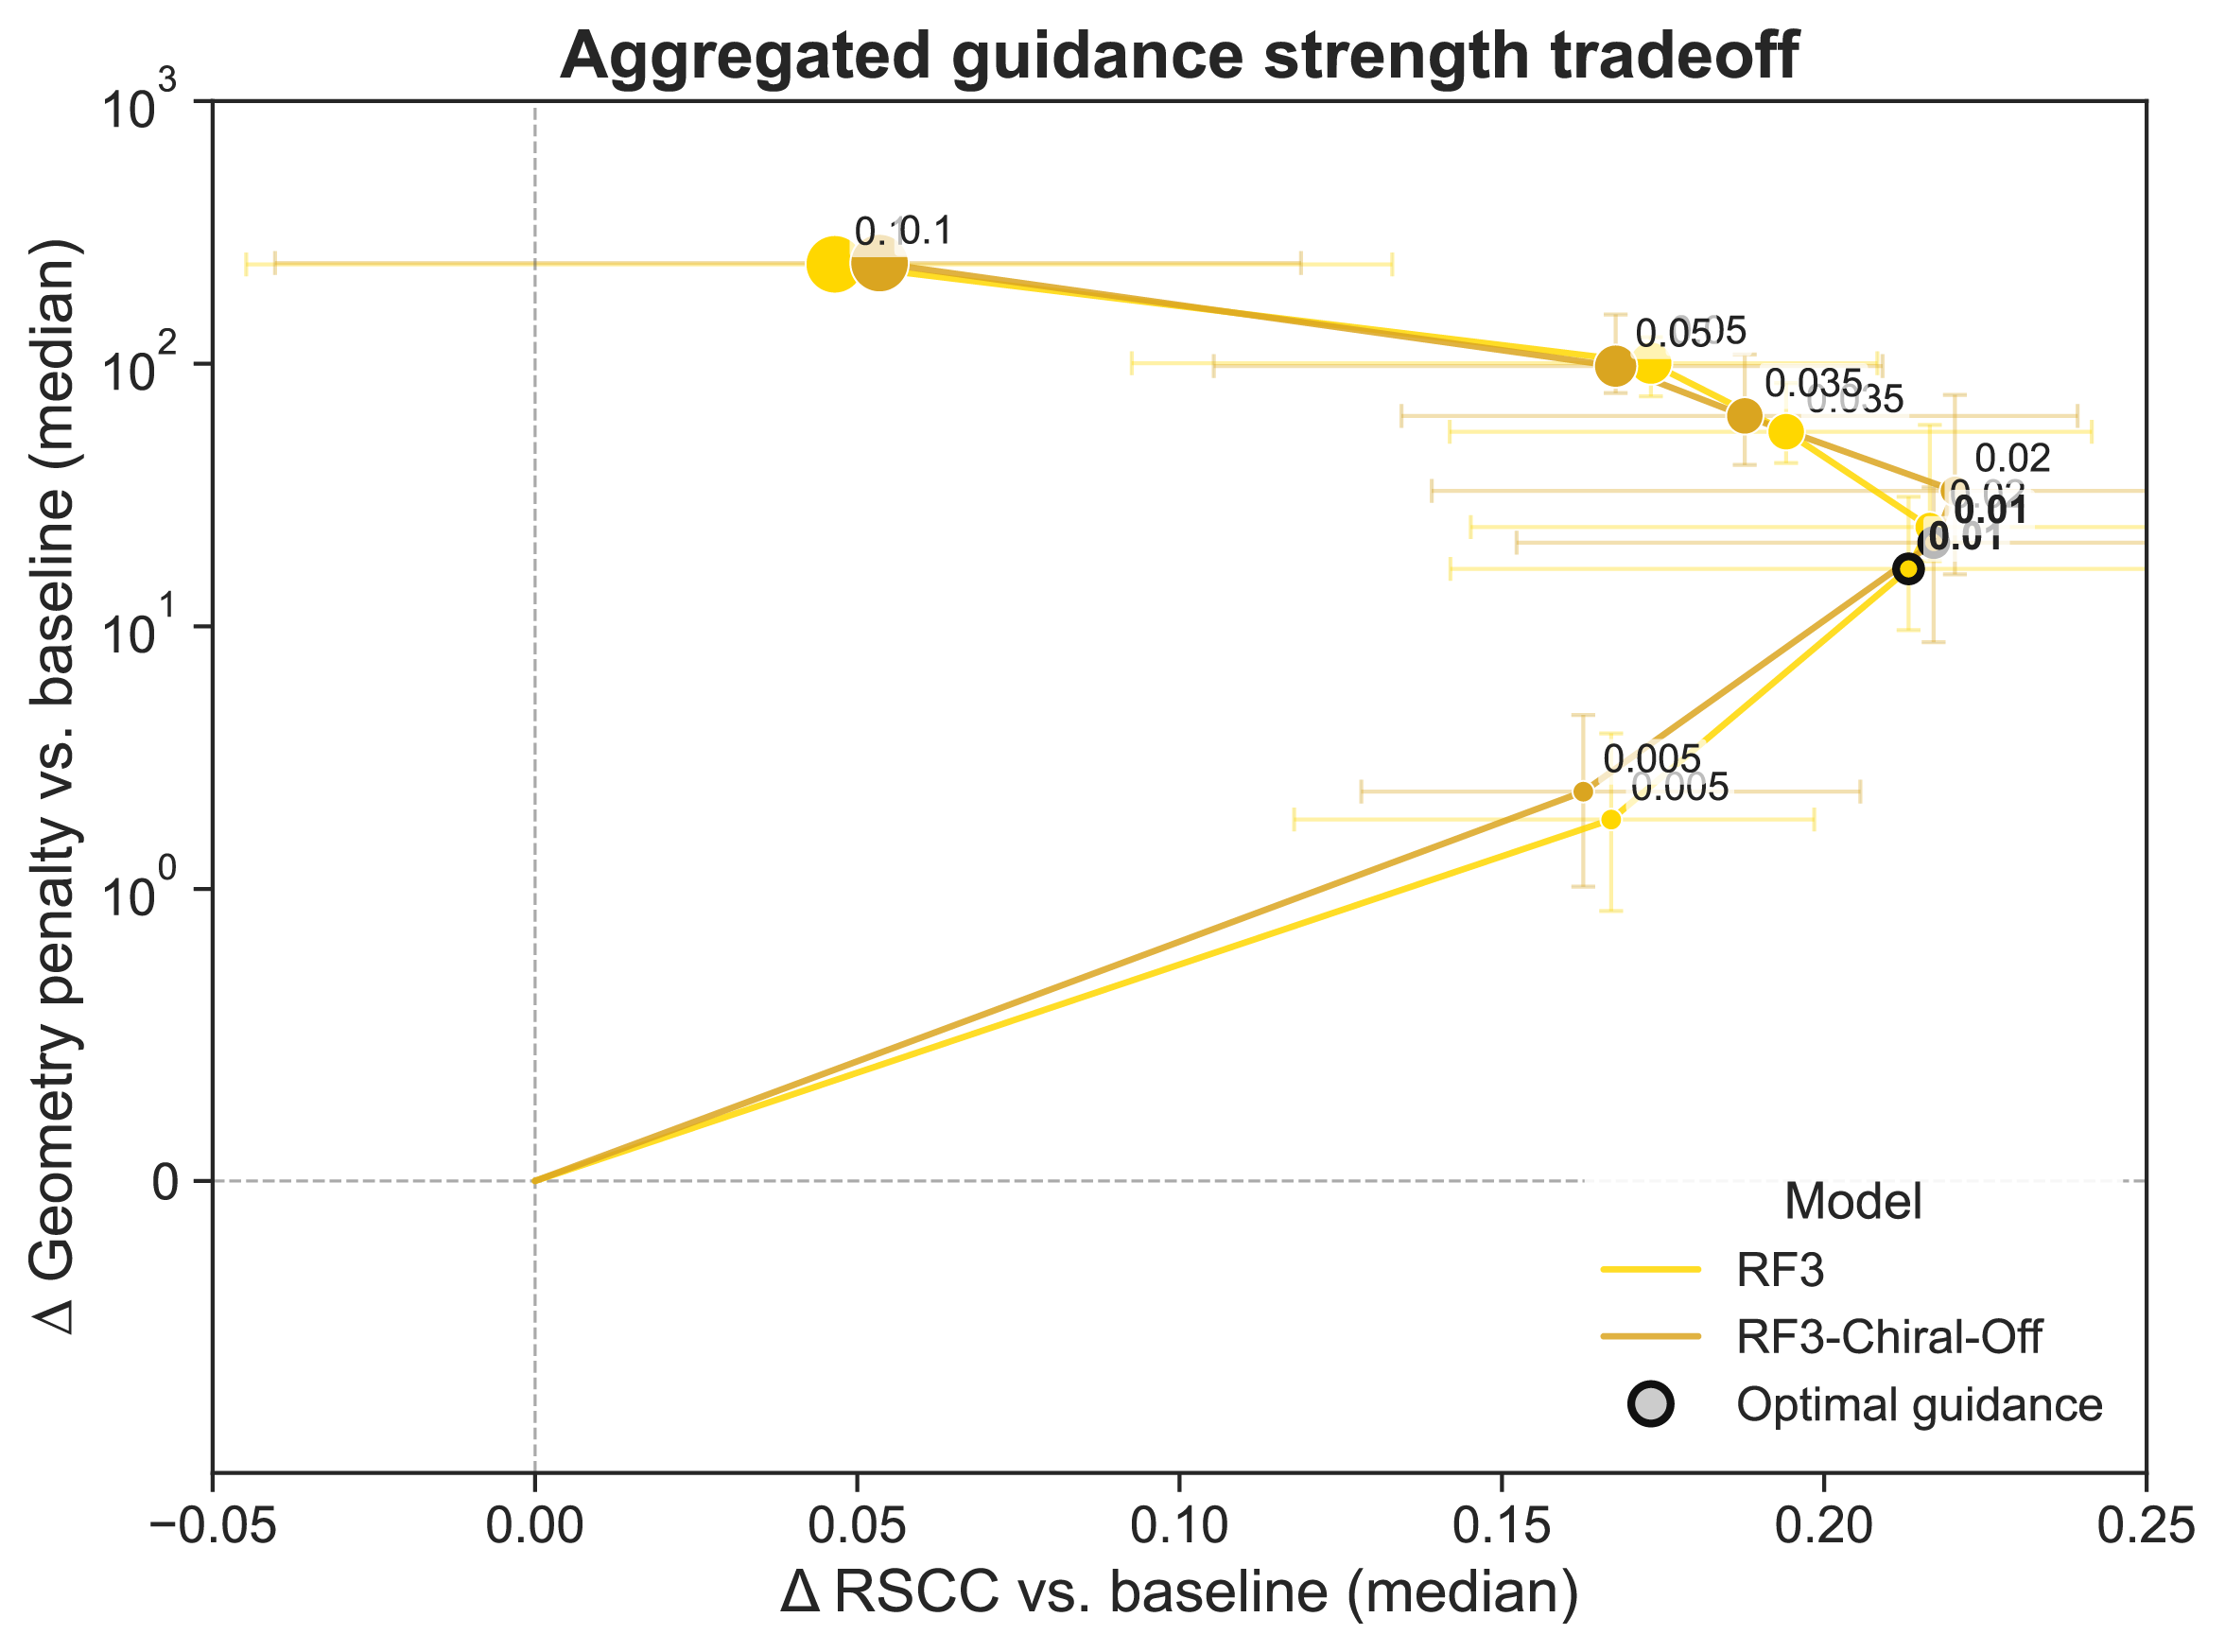
Supplementary Figure 7: RF3 with chiral features zeroed retains increased sensitivity to guidance strength
When compared with the default RF3, zeroed chiral features do not appear to change the optimal guidance strength for RF3.
Supplementary Figure 8a: Examples where RMSD remains high to both deposited conformations after guidance (2QCV)
In 2QCV, structure predictors (color) improve fit with the density by sampling more broadly relative to baseline (left), but do not converge on the deposited altlocs (gray) when guided (right)
Supplementary Figure 8b: Examples where RMSD remains high to both deposited conformations after guidance (4OLE)
Similarly to 2QCV, structure predictors (color) sample in 4OLE more broadly when guided relative to baseline, but do not successfully sample the deposited altlocs.
Supplementary Figure 9: Structure predictors do well in cases where the side chain rotamers in the deposited altloc ensemble are already sampled in the baseline prediction
Supplemental Figure 9: For 6NI6 (and 6NI5) the predicted baseline ensemble already contains similar side chain rotamers, and guidance sharpens the distribution towards states that fit with the density. However, RF3′s baseline ensemble contains a helical shift away from the deposited backbone, and is not able to recover the deposited altloc ensemble.
Be the first to comment on this publication.