Purpose
Genomic campaigns across diverse organisms increasingly begin with large strain collections, where DNA extraction largely determines cost and throughput. For cell-walled microbes such as microalgae, the cell wall makes this step especially slow and costly.
To facilitate these campaigns, we developed a xanthate-based lysis approach and two downstream DNA cleanup workflows. The first cleanup is low-cost, high-throughput, and bead-based, yielding DNA amenable to standard molecular biology workflows. The other cleanup is higher fidelity and uses ethanol precipitation to minimize shearing and achieve greater yields of high-molecular-weight DNA.
We developed our approaches using Chlamydomonas reinhardtii and the interfertile Chlamydomonas smithii, both with cell walls that can resist standard DNA preparation approaches. We found that these approaches avoid significant DNA fragmentation and enable efficient downstream molecular biology. The distinguishing feature of our approach is that we bypass steps that make existing long-read-grade algal preparations hard to scale: phase separation (phenol:chloroform or otherwise), spin columns, and sample grinding. Instead, xanthate disrupts cell walls and sequesters organic contaminants in a single step.
We hope these workflows will be useful to anyone extracting genomic DNA from cell-walled microalgae, including and potentially beyond Chlamydomonas (diversity collections such as mutant and hybrid panels, mutagenesis libraries, and bioprospecting isolates), as well as those looking to automate genomic DNA extraction and those looking to implement downstream long-read sequencing. We've shared our workflows on protocols.io and captured development insights in this pub to help readers expedite optimization and adaptation for other use cases or organisms.
Background and goals
The cell wall and surrounding extracellular matrices can complicate genomic DNA extraction from microbes, and cell wall composition varies with both genotype (at the species and strain level) and cell state 1–3. To develop extraction methods insensitive to the phenotypic diversity present in Chlamydomonas, we focused our protocol development efforts on the phenotypically disparate Chlamydomonas reinhardtii (CC-124) and Chlamydomonas smithii (CC-1373) 4, as well as haploid progeny of a cross between the two. We used this cross because CC-124 and CC-1373 are among the most divergent readily available Chlamydomonas strains, so their progeny have a diversity of phenotypes. C. smithii often forms palmelloid clusters: non-motile aggregates of daughter cells retained within the mother cell wall after division 5, embedded in a thick acidic polysaccharide matrix, similar to but distinct from the C. reinhardtii hydroxyproline-rich glycoprotein cell wall 6–8. These matrices resist most traditional lysis methods, and DNA obtained from Chlamydomonas often co-extracts with large amounts of matrix polysaccharide as a result 9–10. Therefore, we expected C. smithii × C. reinhardtii haploid progeny to inherit a continuum of intermediate palmelloid phenotypes, and a protocol developed using these strains should be robust to this cell wall variation.
We built our high-throughput method for reduced-representation genotyping: sequencing a reproducible, genome-wide subset of the genome across individuals for population-scale comparison. That use case demands an extraction that works across our strains without strain-by-strain adjustment, since lysis inefficiency in any individual introduces error and possibly bias in downstream genotyping. We also aimed to develop a paired, higher-fidelity method: one that yields high-molecular-weight (HMW) DNA for long-read library preparation and de novo assembly of the C. smithii parent, which has no reference genome.
The problem
At the scale of a diversity collection (thousands to hundreds of thousands of genotypically different individuals), DNA extraction, not sequencing, can determine the overall cost and throughput. Mutant and hybrid panels, insertional-mutagenesis libraries, and bioprospecting isolates routinely run to thousands of strains, each of which must yield DNA before it can be genotyped. Extraction methods sensitive to genotype or culture state can fail DNA extraction non-randomly, biasing the panel. The methods that reliably produce high-quality DNA from recalcitrant, cell-walled organisms, especially microalgae such as Chlamydomonas, often don't scale well. Cetyltrimethylammonium bromide (CTAB)-based methods are the standard for Chlamydomonas and other organisms with polysaccharide- and polyphenol-rich cell walls and extracellular matrices; they can yield pure, HMW DNA, but they're inherently manual 11. They're long, multi-step, and involve repeated chloroform-based phase extractions that are difficult to automate 12.
While column and spin kits can parallelize extractions more readily, they cost significantly more per sample and, on polysaccharide-rich cells, recover less DNA than other chemistries 13–14. Barcoding and insertional tagging sidestep extraction entirely, but give no direct genomic readout and require genetic editing, a limiting step in Chlamydomonas 15–16. None of the existing options is inexpensive per sample, automatable, and free of sample grinding or organic handling, the combination that a collection-scale workflow needs.
Our solution
We developed protocols based on xanthate chemistry (potassium ethyl xanthate), a decades-old yet underused approach to DNA isolation. Xanthate salts react with the hydroxyl groups of polysaccharides, rendering them water-soluble so we can wash them away after lysis. They also react with the amines of proteins and single-stranded RNA, rendering them insoluble so we can remove them along with cell debris during lysate clearing 17. Because they act on polysaccharide and protein constituents common to cell walls and extracellular matrices of diverse composition, researchers have used different xanthate-based methods across kingdoms 17–19. Previous methods have generated HMW DNA without deproteination or homogenization 20, but they’re low yield and rely on manual, difficult-to-automate steps 17, limiting their more recent application to niches such as no-grind plant-virus and viroid diagnostics 21 and omics from environmental microbialite communities 22.
Because xanthate extraction requires no organic phase separation, DNA can be extracted directly from the lysate using either bead-based or alcohol-precipitation-based cleanups (Figure 1). We adapted a Chlamydomonas xanthate miniprep from the Chlamydomonas Resource Center into two protocol tracks (high fidelity, high throughput) that avoid sample grinding and phase separation. The high-fidelity track uses ethanol precipitation with minimal shearing to recover HMW DNA for long-read library preparation. This protocol recovers HMW DNA from Chlamydomonas as a dominant band above 50 kb, suitable for PCR-based applications. With additional optimization to further reduce contaminants, including residual RNA, it may also provide suitable input for long-read sequencing such as Oxford Nanopore Technologies (ONT) or PacBio HiFi.
The high-throughput track cleans the lysate using solid-phase reversible immobilization (SPRI) magnetic beads in 96-well plates (automatable on a liquid handler such as an Opentrons Flex) for reduced-representation genotyping at collection scale. The core protocol processes a full 96-well plate at once, without per-tube precipitation, to lower hands-on time and cost per sample. This recovers mostly HMW DNA, although at a lower yield. Within the high-throughput track, cleanup can stop after a single SPRI pass (hereafter "single-SPRI") or continue through a proteinase K/RNase digestion and a second SPRI pass that removes RNA (hereafter "RNA-free;” Figure 1).
To our knowledge, no prior method pairs xanthate lysis with direct SPRI cleanup, and existing 96-well preparations for Chlamydomonas (such as Chelex-based colony PCR 23) yield crude PCR templates rather than purified HMW DNA. We provide quality-control data from both tracks, including results from independent runs by a second operator.
The method
Step-by-step protocols for genomic DNA from Chlamydomonas by xanthate lysis at high fidelity (ethanol precipitation) or high throughput (SPRI) are available on protocols.io.
In this section, we share a conceptual overview of this method. The subsections below follow the workflow in Figure 1: cell culture, lysis and DNA extraction, and quality control. For each step, we describe what the two tracks share, where they diverge, and which choices affect yield and fragment size.
Look to our linked protocols for step-by-step details. Jump to “Methodological details specific to our testing” for complete information on strains, culture volumes, reagent catalog numbers, and conditions behind the data we report in the pub.
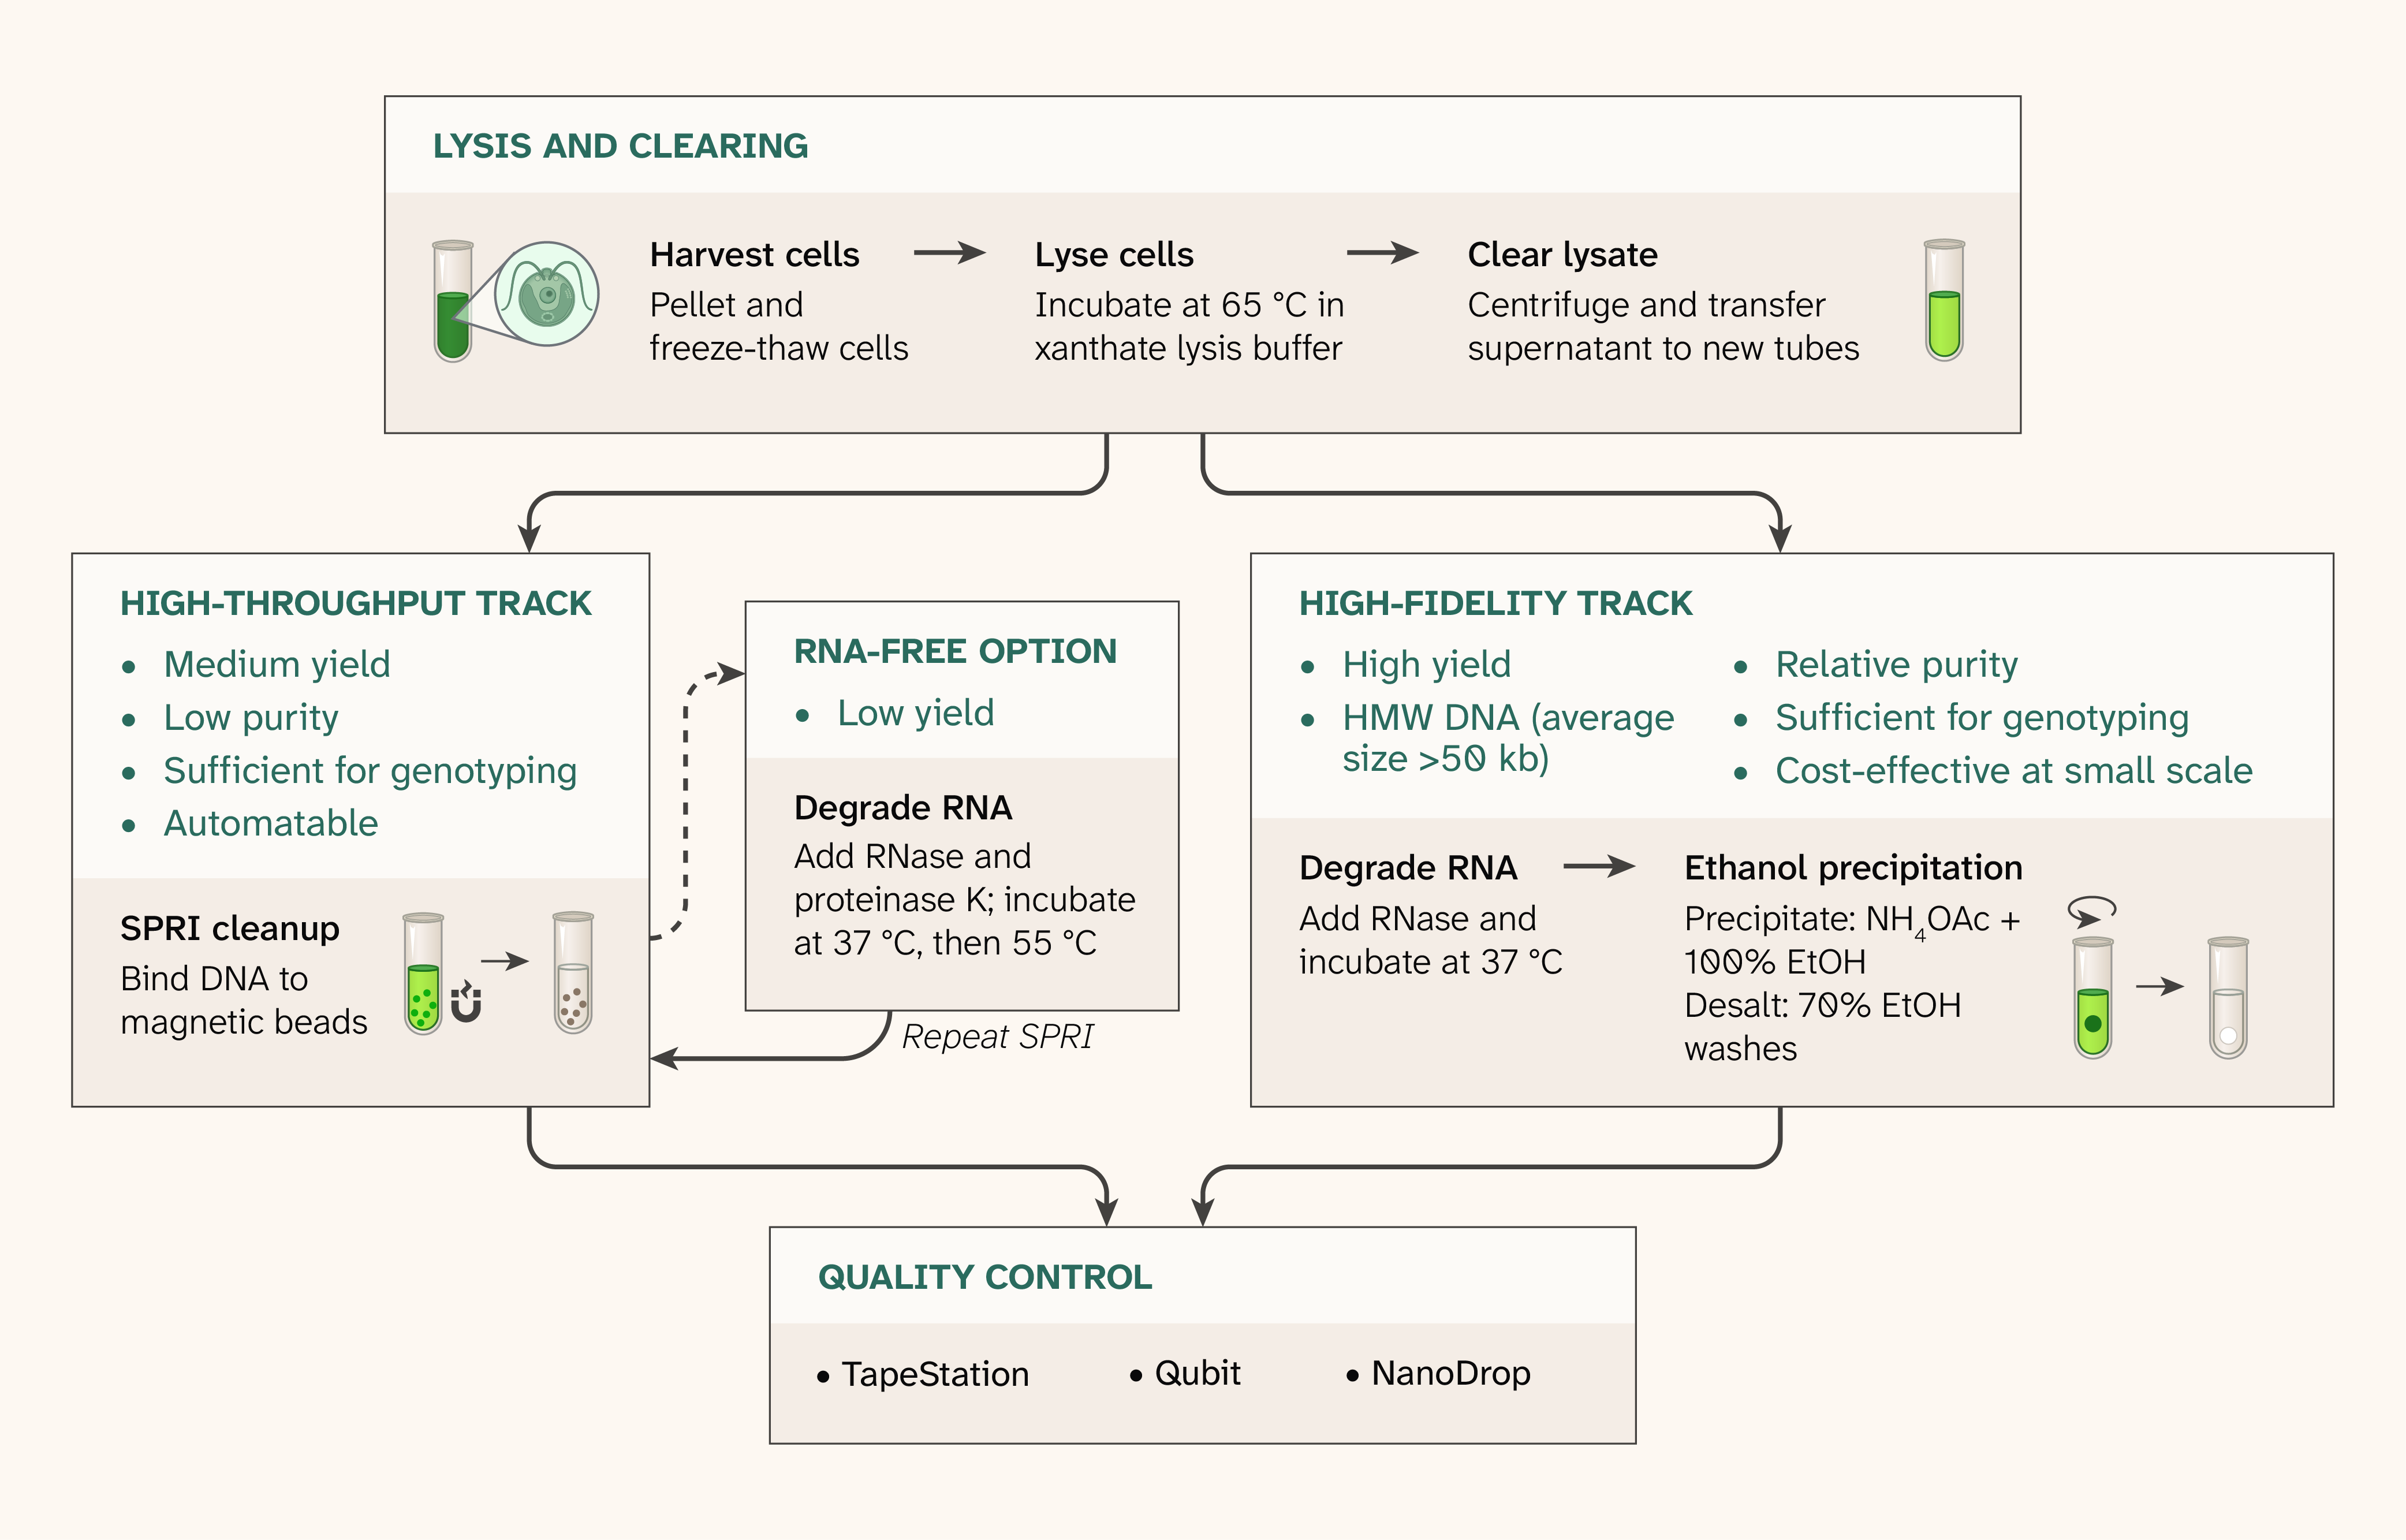
Figure 1. Overview of the genomic DNA extraction workflow and two cleanup tracks.
Both tracks share lysis and clearing: We pellet and freeze-thaw cells, lyse them in xanthate lysis buffer at 65 °C, and clear the lysate by centrifugation. The high-throughput track cleans the lysate with solid-phase reversible immobilization (SPRI) magnetic beads in 96-well plates ("single-SPRI"), yielding DNA at medium yield and low purity; an optional RNase and proteinase K digestion followed by a second SPRI cleanup ("RNA-free") removes RNA. The high-fidelity track digests RNA, then recovers DNA by precipitation with ammonium acetate (NH4OAc) and ethanol (EtOH), yielding high-molecular-weight (HMW) DNA (average size above 50 kb) at high yield and relative purity. We assess all outputs by TapeStation, Qubit, and NanoDrop for quality control (QC).
Choose the high-fidelity track when you need high-molecular-weight DNA from a small number of strains and your downstream application tolerates residual contaminants, like PCR does. If your application requires complete removal of RNA and/or non-nucleic-acid contaminants (for example, long-read library preparation), you'll need to do further development.
Choose the high-throughput track when you need DNA from many strains for genotyping. It utilizes 1 mL cultures in 96-well plates, can run on a liquid handler, and costs less per sample, but recovers less DNA at lower purity. Within the high-throughput track, “single-SPRI” is the default: RNA carries into the eluate but the eluate is compatible with downstream molecular biology. Add the “RNA-free” step only when RNA carryover interferes with downstream processing. Both tracks often fall below conventional NanoDrop purity ratios, so confirm that your downstream application tolerates this.
DNA extraction
For both tracks, we culture cells in liquid media, shaking, under continuous light. The high-throughput track runs in 96-well plate format end to end. The high-fidelity track runs in tube format end to end. Both tracks employ a single cycle of −80 °C freeze and 4 °C thaw to initiate lysis. We lyse the cells in a buffer containing potassium ethyl xanthate, sodium chloride, Tris-HCl, and EDTA, incubated at 65 °C. For the high-fidelity track, this buffer also contains dithiothreitol (DTT), proteinase K, polyvinylpyrrolidone, molecular weight 40,000 (PVP-40), and increased EDTA to help mitigate DNA shearing and minimize polysaccharide and protein carryover. We treat the supernatant after centrifugation with RNase A/RNase T1 digestion and subsequently isolate DNA by ethanol precipitation. For the high-throughput track, we clean up the cleared lysate by directly adding SPRIselect beads (you could also use equivalent AMPure-style beads) with 80% ethanol washing to remove all visible green pigment. As an optional “RNA-free” add-on, we treat the resulting SPRI eluate with an RNase A/RNase T1/proteinase K mixture and perform a second SPRI cleanup.
Quality control
For both tracks, we use ultraviolet–visible (UV–Vis) spectroscopy (NanoDrop One; dsDNA setting), fluorescent DNA quantification (Qubit; dsDNA high-sensitivity kit), and bioanalyzer electrophoretic analysis (TapeStation; gDNA ScreenTape) to assess the quality of our final, purified genomic DNA, in line with standard library preparation quality control conventions 24. NanoDrop A230 absorbance flags residual non-nucleic-acid contaminants that Qubit and TapeStation don't detect 9–10, and we normalize the downstream library-preparation input by Qubit. We summarize NanoDrop and Qubit readings as DNA concentration and the NanoDrop:Qubit ratio, which rises with RNA and other non-dsDNA A260 contaminants. TapeStation data provides the fragment-size distribution, which we use to assess HMW DNA yield (DNA at or above 10 kb) and fragmentation (average DNA size).
For the high-fidelity track, we target an average DNA size above 30 kb, in line with general long-read sequencing requirements (see PacBio and ONT guidelines, for example). For the high-throughput track, we don't set a fixed cutoff but avoid extensively degraded preparations, since reduced-representation genotyping depends on the extraction's fragment-size distribution, which downstream processing can't recover once it's lost. Degraded preparations show a lower average size, a smaller percentage of DNA at or above 10 kb, and wider well-to-well variance. RNA carryover also adds signal below 10 kb, so "single-SPRI" preparations read low without being degraded (Figure 3, B). That RNA can also inflate NanoDrop and Qubit dsDNA readings, so TapeStation signal at or above 10 kb, or quantification after the "RNA-free" step, gives a better measure of DNA amount.
Although our preparations frequently fall below conventional NanoDrop purity thresholds, particularly for A260/A230, they perform reliably in downstream PCR-based molecular identification with nuclear and organellar markers (described more in "Observed performance," raw data on Zenodo). The "Optimization notes" section addresses aspects of the workflow that can affect DNA purity and fragmentation.
Methodological details specific to our testing
Here, we describe the exact strains, culture conditions, and handling that we used to generate the data we report in "Observed performance."
A note on replication and how we report data
We refer to the data in the main figures as the "primary preparation". A second operator independently repeated each track, following the same protocols (we call this the "replication"). Because the replication differed from the primary preparation in some details, we give both versions wherever they diverge.
High-fidelity track
Strains
We obtained C. reinhardtii CC-124 (wild type, mt−, 137c background) and C. smithii CC-1373 (SAG 54.72) from the Chlamydomonas Resource Center (CRC) on slants of Tris–acetate–phosphate (TAP) medium supplemented with yeast extract. We maintained each on plates of TAP with 0.4% (w/v) yeast extract and 1.5% (w/v) agar at room temperature under continuous light, passaging every 11–20 days by streaking and patching onto fresh plates.
Culture and harvest
We inoculated liquid cultures from 14-day-old second-passage plates (sixth-passage plates in the replication). We scraped three to four streaks from each plate into 1 mL of TAP in a microcentrifuge tube, vortexed until homogeneous, and transferred the full volume into 200 mL of TAP in a 1,000 mL baffled flask with a breathable stopper (Thermo Fisher Scientific, 14-127-40D, 3.4 cm inner diameter). We grew cultures at 24.5 °C, shaking at 150 rpm, in a Multitron Standard triple-stack incubator shaker (INFORS HT, MS232T6), under continuous light (photosynthetic photon flux density of 41 ± 5 µmol photons m−2 s−1; illuminance 1,880 ± 220 lx; correlated color temperature 2,590 ± 60 K; color rendering index [CRI] Ra 47.0 ± 1.9). We harvested C. reinhardtii after three days (OD750 = 1.86 in the primary preparation, 2.12 in the replication) and C. smithii after four days (OD750 = 1.19 and 0.96, respectively; NanoDrop One cuvette). In the primary preparation, we pelleted three 20 mL aliquots of C. reinhardtii and three 32.5 mL aliquots of C. smithii (matched by OD750 × volume) in 50 mL conical tubes at 3,000 × g for 5 min at room temperature. We decanted by flicking, which left about 160–180 µL of TAP on each pellet, flash-froze the tubes on dry ice, and stored them at −80 °C. In the replication, we pelleted four 12 mL fractions in 15 mL conical tubes at 3,200 × g for 15 min, decanted, resuspended each pellet in 500 µL of TAP, transferred it to a 1.7 mL microcentrifuge tube, pelleted it again at 15,000 × g for 3 min, and removed the supernatant with a P1000 pipette, leaving no residual TAP. Then we flash-froze the tubes on dry ice and stored them at −80 °C.
Lysis and ethanol precipitation
To offset the residual TAP, we prepared the lysis buffer at 1.35× in the primary preparation (135 mM Tris-HCl pH 7.5, 67.5 mM EDTA pH 8.0, 945 mM NaCl, 16.9 mM potassium ethyl xanthogenate [Fisher Scientific, AAA1145022], and 1.35% [w/v] PVP-40 [Fisher Scientific, AAJ6241722]; 0.22 µm filtered) and at 1× in the replication, where no TAP remained. We scaled proteinase K [NEB P8107S, 800 U/mL] and DTT by the same factor, so that final concentrations after dilution by the residual TAP were equivalent to those of the protocol. We added 450 µL of cold working mix, prepared as a master mix for the six pellets (2,925 µL of 1.35× buffer, 195 µL of proteinase K, and 39 µL of fresh 1 M DTT), directly to each frozen pellet on ice. We then held the tubes on ice for 40 min: we broke up each pellet with the back of an inoculation loop at 15 min on ice, swirled intermittently, and at 25 min on ice, in the primary preparation, we split each slurry into two 1.7 mL microcentrifuge tubes (about 350 µL each) with a wide-bore P1000 tip, using 6–10 gentle pipette strokes. The six fractions per species are therefore technical replicates from a single culture: two fractions from each of three pellets. In the replication, we divided the culture before pelleting, so this step wasn’t needed. We minimized pipette handling throughout to minimize shear-stress-induced fragmentation.
We lysed at 65 °C for 50 min without shaking using a ThermoMixer C with microcentrifuge tube attachment (Eppendorf, 5382000023) and cleared debris at 10,000 × g for 10 min at 4 °C. In the primary preparation, we removed the debris pellet with a wide-bore P1000 tip rather than transferring the supernatant, leaving about 300 µL per tube. In the replication, we transferred about 425 µL of supernatant to a new tube. We scaled the RNase digestion to the supernatant volume using 2 µL of RNase mix (1.35 µL RNase A [Thermo Fisher R1253, 10 mg/mL] and 0.65 µL RNase T1 [Thermo Scientific EN0541, 1,000 U/µL]) per 300 µL, or 3 µL for 425 µL, for 30 min at 37 °C without shaking, then spun again (10,000 × g, 5 min, 4 °C) to clear residual debris. We transferred the supernatant to a new tube and precipitated the DNA using 0.5 volumes of 7.5 M ammonium acetate and 2.5 volumes of cold 100% ethanol. In the replication, reagent volumes were scaled proportionally to the difference in input volume (425 µL versus 300 µL in the primary preparation). We mixed by gentle inversion, incubated for 5 min at 4 °C, pelleted it at 10,000 × g for 15 min at 4 °C, and washed five times with 1 mL of cold 70% ethanol (2 min spins). After air-drying each pellet, we covered each with 25 µL of 37 °C molecular-biology-grade water (40 µL in the replication), incubated for about 10 min at 37 °C with occasional tapping, and stirred and pipetted up and down once with a wide-bore P1000 tip.
Quality control
In the primary preparation, we diluted each fraction 1:10 in water, then measured dsDNA with a Qubit 4 fluorometer (Thermo Fisher Scientific, Q33238) and a 1× dsDNA High Sensitivity (HS) kit (Thermo Fisher Scientific, Q33230), as well as with a NanoDrop One/OneC spectrophotometer (Thermo Fisher Scientific, ND-ONE-W). We multiplied each result by 10 to report concentrations in the undiluted 25 µL fraction, from which we calculated each fraction's NanoDrop:Qubit ratio. We measured RNA with a Qubit 4 fluorometer (Thermo Fisher Scientific, Q33238) and an RNA High Sensitivity kit (Thermo Fisher Scientific, Q32852). In the replication, we measured undiluted fractions. We ran each fraction on a Genomic DNA ScreenTape (Agilent, 5067-5365) using a 4150 TapeStation System (Agilent, G2992AA), mixing sample and buffer by flicking rather than vortexing to minimize shearing of the DNA measured in the assay, and calculated average DNA size and the percentage of DNA at or above 10 kb from each lane's exported trace. We used the Genomic DNA ScreenTape ladder and sample buffer reagent kit (Agilent, 5067-5366); the sample buffer includes a 100 bp synthetic DNA fragment (referred to as "lower marker") that aligns each sample's data to the provided genomic DNA ladder.
Species typing and organellar PCR
To confirm species identity, we designed a nuclear marker spanning a 1,788 bp deletion on chromosome 9 that's present in CC-1373 but not CC-124 (NC_057012.1: 7,367,489–7,369,276). We found the deletion by aligning public whole-genome resequencing reads for each strain (SRR1734609, CC-124; SRR1734611, CC-1373) 25 to the C. reinhardtii v5.5 reference (GCF_000002595.2) with BWA 26 (v0.7.19-r1273; RRID: SCR_010910) using the MEM algorithm. We then flagged 100 bp windows (mosdepth 27 v0.3.14 [RRID: SCR_018929]) with at least 20× coverage in CC-124, at most 5× in CC-1373, and at least 10× in the CC-1373 windows flanking the gap. We confirmed the deletion with read pairs bridging the gap in CC-1373 and absent in CC-124, and placed primers in flanking sequences that 1) lacked single-nucleotide polymorphisms (SNPs) using BCFtools 28 (v1.22; RRID: SCR_005227; mpileup) and 2) were unique in the genome as judged by BLASTN 29 (v2.16.0+; RRID: SCR_004870). To check for organellar DNA, we designed presence/absence primers for chloroplast rbcL and mitochondrial cox1 against the organellar references (NC_005353.1 and NC_001638.1). Both amplify the same size product from either species, but the cox1 amplicon carries two SNPs (NC_001638.1: 5,911 C→T and 5,929 C→A) that distinguish CC-1373 from CC-124 by sequencing (Table 1).
| Target | Genome (reference) | Primer pair (5′ to 3′) | Product |
|---|---|---|---|
| chr9 deletion marker | Nuclear (NC_057012.1) | CAAGAGACCCGTCCACGTGACG AGTTCTGGCCAGGGAGGGTTGG | ~1,937 bp, CC-124; ~149 bp, CC-1373 |
| rbcL | Chloroplast (NC_005353.1) | AGCCGGTGTAAAAGACTACC AAGCAGGTGGAATACGAAGG | 389 bp, both |
| cox1 | Mitochondrion (NC_001638.1) | TTCTGGTTCTTTGGTCACCC AAAACGGCACCCATACTCAA | 455 bp, both; two CC-1373 SNPs |
Table 1. Primers for species typing and organellar DNA detection.
The chromosome 9 marker distinguishes CC-124 from CC-1373 by product size. The chloroplast and mitochondrial markers amplify the same product from both strains and confirm that organellar DNA is present; two SNPs in the mitochondrial amplicon distinguish the strains by sequencing.
We first tested these PCRs and sequenced the resulting amplicons using DNA from C. reinhardtii and C. smithii cultures in an earlier high-fidelity preparation from the same CRC stocks (50 mL TAP cultures harvested after three days). Each 25 µL reaction contained 12.5 µL of 2× GoTaq master mix (Promega, M7122), 0.5 µM of each primer, and 0.5 µL of template diluted 1:30 in water. Using a SimpliAmp Thermal Cycler (Thermo Fisher Scientific, A24811), we cycled at 95 °C for 2 min; 35 cycles of 95 °C for 30 s, 55 °C for 30 s, and 72 °C for 2.5 min; and 72 °C for 5 min. We ran 5 µL of each reaction on precast E-Gel agarose gels (2% for the chr9 and rbcL reactions, 1% for cox1). We sent products for ONT long-read, linear amplicon sequencing (Angstrom Innovation). In house, we aligned raw reads with minimap2 30 (v2.31, map-ont preset; RRID: SCR_018550) to the C. reinhardtii v5.5 nuclear genome along with both organellar references, so any off-target products would map elsewhere rather than onto the intended locus. We sorted and indexed the alignments with SAMtools 28 (v1.22.1; RRID: SCR_002105). Using pysam 31 (v0.23.3; RRID: SCR_021017) and SAMtools, we calculated on-target rates as the fraction of primary reads overlapping the intended locus (±200 bp), called chr9 genotypes from mean read depth across the deletion interior (NC_057012.1: 7,368,000–7,368,800), and called cox1 genotypes from base counts at the two SNPs. We compared the two strains' consensus sequences by strand-corrected pairwise alignment (MAFFT 32 v7.526 [RRID: SCR_011811]) and assigned each consensus to its locus by BLASTN (v2.16.0+) against the v5.5 genome and both organellar references.
To validate species identity for the 12 fractions, we performed the chr9 PCR with the same reaction mixtures and SimpliAmp thermocycler cycling protocol, this time using 0.5 µL of template diluted 1:10 in water. We ran 3 µL of each reaction on a 1% agarose gel with O'GeneRuler Express DNA Ladder (Thermo Scientific) alongside no-template controls.
High-throughput track
Species and hybrid generation
We created hybrid haploid offspring from C. reinhardtii CC-124 (mt−) and C. smithii CC-1373 (mt+) using the following protocol. We grew cultures of CC-124 and CC-1373 to log phase in liquid TAP medium. We then centrifuged the cultures at 5,000 × g for 10 min. We then removed the TAP medium and replaced it with 200 µL sterile water. We then incubated the cultures in the dark for 2 h. We qualitatively assessed gametogenesis by placing 5 µL of both cultures on a single microscope slide such that they didn’t touch. Then we bridged the two spots with 5 µL of sterile water and assessed the motion of the cells qualitatively. If gametes were present, we then mixed the cultures into one tube and placed them in the dark overnight. We then spread the cells onto a solid TAP medium plate containing 4% agarose at low density so individual cells were separated, covered the plate with an adhesive aluminum foil seal (VWR, 75805-268), and placed it in the dark for seven days. We then dissected mature zygospores with a needle to isolate individual strains. For each zygospore, we only propagated a single cell.
We maintain the progeny as 1 mL TAP cultures in 2 mL 96-well deep-well plates, one strain per well, under breathable seals, and passage them monthly on an Opentrons Flex by transferring 100 µL of each culture into 900 µL of fresh TAP. For the primary preparation data shown, we used a single 96-well plate of progeny. For the replication, we used a plate of CC-124 grown the same way, rather than haploid progeny.
Culture and harvest
We resuspended every well of a stock 96-well deep-well plate passaged 13 days earlier (14 days for the replication) with four to five strokes with a multichannel pipette set to 900 µL, and transferred 100 µL per well into a 2 mL 96-well deep-well plate pre-filled with 900 µL of fresh TAP, preserving the plate layout. We sealed the plate with an AeraSeal breathable seal (Excel Scientific, BS-25) and incubated it at 24.5 °C, shaking at 150 rpm, in a Multitron Standard triple-stack incubator shaker (INFORS HT, MS232T6), under continuous light (photosynthetic photon flux density of 41 ± 5 µmol photons m−2 s−1; illuminance 1,880 ± 220 lx; correlated color temperature 2,590 ± 60 K; CRI Ra 47.0 ± 1.9) for five days. We spot-checked OD750 (NanoDrop One cuvette). In the primary plate, two wells with homogeneous culture had OD750 values of 1.86 and 2.09, and two wells where cells had settled into pellets had OD750 values of 1.08 and 1.44. In the replication plate, three wells read 2.33, 2.30, and 1.80. We harvested cells by centrifuging the plates at 3,200 × g for 10 min, decanting supernatant by flicking the plate three times into the sink, and blotting the inverted plate on a lint-free wipe. We then sealed the plate with an adhesive aluminum foil seal, flash-froze it on dry ice for 10 min, and stored it at −80 °C for eight days.
Lysis and SPRI cleanup
We processed the resulting plate, keeping it in 96-well format throughout, using 12-channel pipettes. We prepared lysis buffer (100 mM Tris-HCl pH 7.5, 10 mM EDTA pH 8.0, 700 mM NaCl, 12.5 mM potassium ethyl xanthogenate), filtered it through a 0.22 µm membrane, and kept it on ice. We held the frozen plate at room temperature for 4 min, lidded but unsealed, so the buffer wouldn't freeze on contact with the pellets. The pellets were still visibly frozen after this time. We then added 100 µL of ice-cold lysis buffer per well, without resuspending, and held the plate on ice for 30 min. We transferred each lysate to a semi-skirted 96-well PCR plate (VWR, 101100-924), mixing three to six times with a regular-bore P1000 pipette set to 100 µL to limit bubbles, spun the plate briefly on a benchtop plate microcentrifuge, sealed it with an adhesive aluminum foil seal, and incubated it at 65 °C for 50 min without shaking using a ThermoMixer C with PCR plate attachment (Eppendorf, 5382000023). We placed the samples on ice immediately after the incubation. We then cleared lysates at 3,214 × g for 15 min at 4 °C and transferred approximately 95 µL of supernatant per well to a fresh plate, leaving volume above the pellet to avoid disturbing it.
We cleaned the entire plate with a single SPRI pass: For every well, we added 120 µL of Beckman Coulter SPRIselect beads (Beckman Coulter, B23317–B23319; 1.2× the nominal 100 µL lysate), mixed gently by pipetting up and down twice, incubated for 10 min at room temperature off the magnet and 10 min on a DynaMag-96 side-skirted magnet (Thermo Fisher Scientific, 12027), and removed the supernatant. We conducted all SPRI handling steps with regular-bore P300 pipette tips unless otherwise noted. We washed four times with 200 µL of freshly prepared 80% ethanol, taking the plate off the magnet and resuspending the beads by scraping and pipetting two to four times for each wash, then returning it to the magnet for 2 min. After the final wash, we removed residual ethanol with a 20 µL pipette, air-dried the beads to a matte finish (8 min), eluted in 40 µL of molecular-biology-grade water (15 min off the magnet, 20 min on), and transferred approximately 37 µL to a new 96-well PCR plate (leaving approximately 3 µL to avoid disturbing the beads). For half of the primary plate (48 wells) and the replicate plate, this was the final "single-SPRI" product. For the other half of the primary plate, we continued processing the 48 wells through the "RNA-free" steps. For these wells, we added each eluate to 3 µL of digest mix (0.5 µL RNase A [10 mg/mL], 0.5 µL RNase T1 [1,000 U/µL], and 2 µL proteinase K [800 U/mL]; same products as the high-fidelity track) pre-dispensed on ice, incubated for 30 min at 37 °C and then 30 min at 55 °C in a SimpliAmp thermocycler (lid set to 60 °C), and cleaned up again with 40 µL of SPRIselect (1.0×) on the same DynaMag-96 magnet: 5 min off and 3 min on the magnet, two 200 µL washes with 80% ethanol on the magnet without resuspension, 7 min of drying, and elution in 22 µL of water (5 min off, 5 min on). We then transferred 20 µL to a new 96-well PCR plate. We stored eluates at 4 °C for one day until quality control (QC).
Quality control
We measured DNA concentration by Qubit (Qubit 4 fluorometer; 1× dsDNA High Sensitivity assay) and NanoDrop (NanoDrop One; dsDNA application) in 12 wells per sample set, one row of each plate. In the same primary wells and in three replication wells, we also measured RNA by Qubit (RNA High Sensitivity assay) and profiled fragment size on an Agilent 4150 TapeStation using Genomic DNA ScreenTape, plus High Sensitivity D5000 ScreenTape for the primary samples, mixing sample and buffer by flicking rather than vortexing to minimize shearing of the DNA measured in the assay. We ran all measurements on undiluted eluate (about 40 µL for "single-SPRI," 20 µL for "RNA-free") following the manufacturers' instructions. In the primary plate, each row held different strains, so the results compare two groups of 12 strains rather than matched replicates. All replication wells contain the same strain (CC-124). For each panel well, we calculated the NanoDrop:Qubit ratio and, from its Genomic DNA ScreenTape trace, average DNA size and the percentage of DNA at or above 10 kb. The Genomic DNA ScreenTape's 100 bp lower marker saturates the detector across roughly 35–400 bp and could mask sample DNA there, so we used each well's High Sensitivity D5000 trace (lower marker at 15 bp) to measure the share of signal, excluding both markers, at 70–150 bp and 60–400 bp.
Quality control analysis
We calculated DNA concentration as A260 × 50 ng/µL, multiplied by the dilution factor. We calculate the NanoDrop:Qubit ratio by dividing that value by the Qubit dsDNA concentration, indicating the degree of RNA and/or non-nucleic A260 contaminants. We plotted NanoDrop spectra normalized to each sample's own A260.
For TapeStation measurement, we exported each lane's raw electropherogram trace from the Agilent TapeStation analysis software (version 4.1.1) and converted migration position to fragment size using a monotone piecewise cubic Hermite interpolating polynomial (PCHIP) of log10(size) against the ladder lane on the same ScreenTape, extrapolating linearly in log10(size) beyond the end bands. Signal above the ladder’s largest band (48.5 kb) is sized by extrapolation alone, so we treat average sizes above that as evidence of HMW DNA rather than as precise size estimates; the 10 kb cutoff falls within the calibrated range. We reported two metrics from each trace: average DNA size (the fluorescence-weighted mean fragment size) and the percentage of DNA at or above 10 kb. We calculated both using only signal between 400 bp and 1 Mb, excluding the lower marker and the baseline at the extrapolated top of the size scale. We plotted each trace normalized to its highest point above 400 bp. To compare DNA amount between conditions, we divided each lane's signal at or above 10 kb by its lower-marker signal (50–150 bp).
Pub preparation
We used Grammarly Enterprise to copy-edit draft text to match Arcadia's style and to suggest grammar and sentence rephrasing. We used Claude (Opus 5.5 and Sonnet 5) to help write, clean up, and review code; to suggest wording ideas, write text, reorganize text using a template, expand on summary text that we provided, copy-edit draft text to match Arcadia's style, and clarify and streamline text; to generate figure mockups; and to suggest papers on relevant science, after which we did further reading and cited some of this literature. We also used Claude to compute QC metrics from raw instrument exports (TapeStation, NanoDrop, Qubit values, and summary statistics). We used Phylo to analyze public Chlamydomonas resequencing data to identify the chromosome 9 deletion distinguishing CC-124 from CC-1373, to design species-typing and organellar PCR primers, and to help write the amplicon-sequencing analysis code from our pseudocode. We also used ChatGPT (GPT-6 and GPT-6.1 Sol) to suggest wording ideas, clarify and streamline text, and to check the manuscript and other materials for rigor, reproducibility, style, and internal consistency, and we made edits based on its feedback.
We reviewed all AI-assisted content and take responsibility for its accuracy and integrity.
Observed performance
High-fidelity track
We used the high-fidelity track to prepare genomic DNA from C. reinhardtii (CC-124) and C. smithii (CC-1373), processing six fractions per species, each from a single culture to test consistency across replicate preparations. TapeStation analysis showed that we extracted high-molecular-weight DNA from both species (Figure 2, A). DNA at or above 10 kb made up 78.3 ± 7.5% of the signal for C. reinhardtii and 58.2 ± 10.4% for C. smithii (mean ± standard deviation [SD]; Figure 2, B), and average fragment size was correspondingly larger in C. reinhardtii (105 ± 21 kb) than C. smithii (68 ± 19 kb), and every fraction averaged above 50 kb (51–129 kb; Figure 2, C). Because 31–73% of each fraction’s signal ran above the ladder’s largest band (48.5 kb), these averages partly rest on extrapolated sizes. Qubit double-stranded DNA (dsDNA) concentrations averaged 76 ± 20 ng/µL for C. reinhardtii and 46 ± 32 ng/µL for C. smithii (Figure 2, E). Qubit RNA, measured in one of the six fractions per species, showed that RNA persisted at roughly 1:1 with dsDNA in the same fractions (128 vs. 105 ng/µL in C. reinhardtii; 24.8 vs. 36.6 ng/µL in C. smithii; Figure 2, F). NanoDrop absorbance spectra showed a peak near 260 nm characteristic of nucleic acid for both species, and C. smithii also absorbed strongly toward 230 nm, consistent with its lower A260/A230 (Figure 2, D), and the NanoDrop:Qubit ratio was higher and more variable in C. smithii (12.6 ± 5.7) than C. reinhardtii (4.9 ± 1.1) (Figure 2, G). C. smithii's lower yield and higher, more variable NanoDrop:Qubit ratio indicate greater residual non-nucleic-acid contamination. Nevertheless, both species consistently yielded HMW DNA, with estimated average sizes above our 30 kb high-fidelity target across all six replicate fractions. Purity remains a limitation: RNA carried over at roughly equal mass to DNA in the fractions we measured, so we'd need to remove the RNA before whole-genome sequencing. Low A260/A230 and elevated NanoDrop:Qubit ratios, especially in C. smithii, indicate further carryover of contaminants.
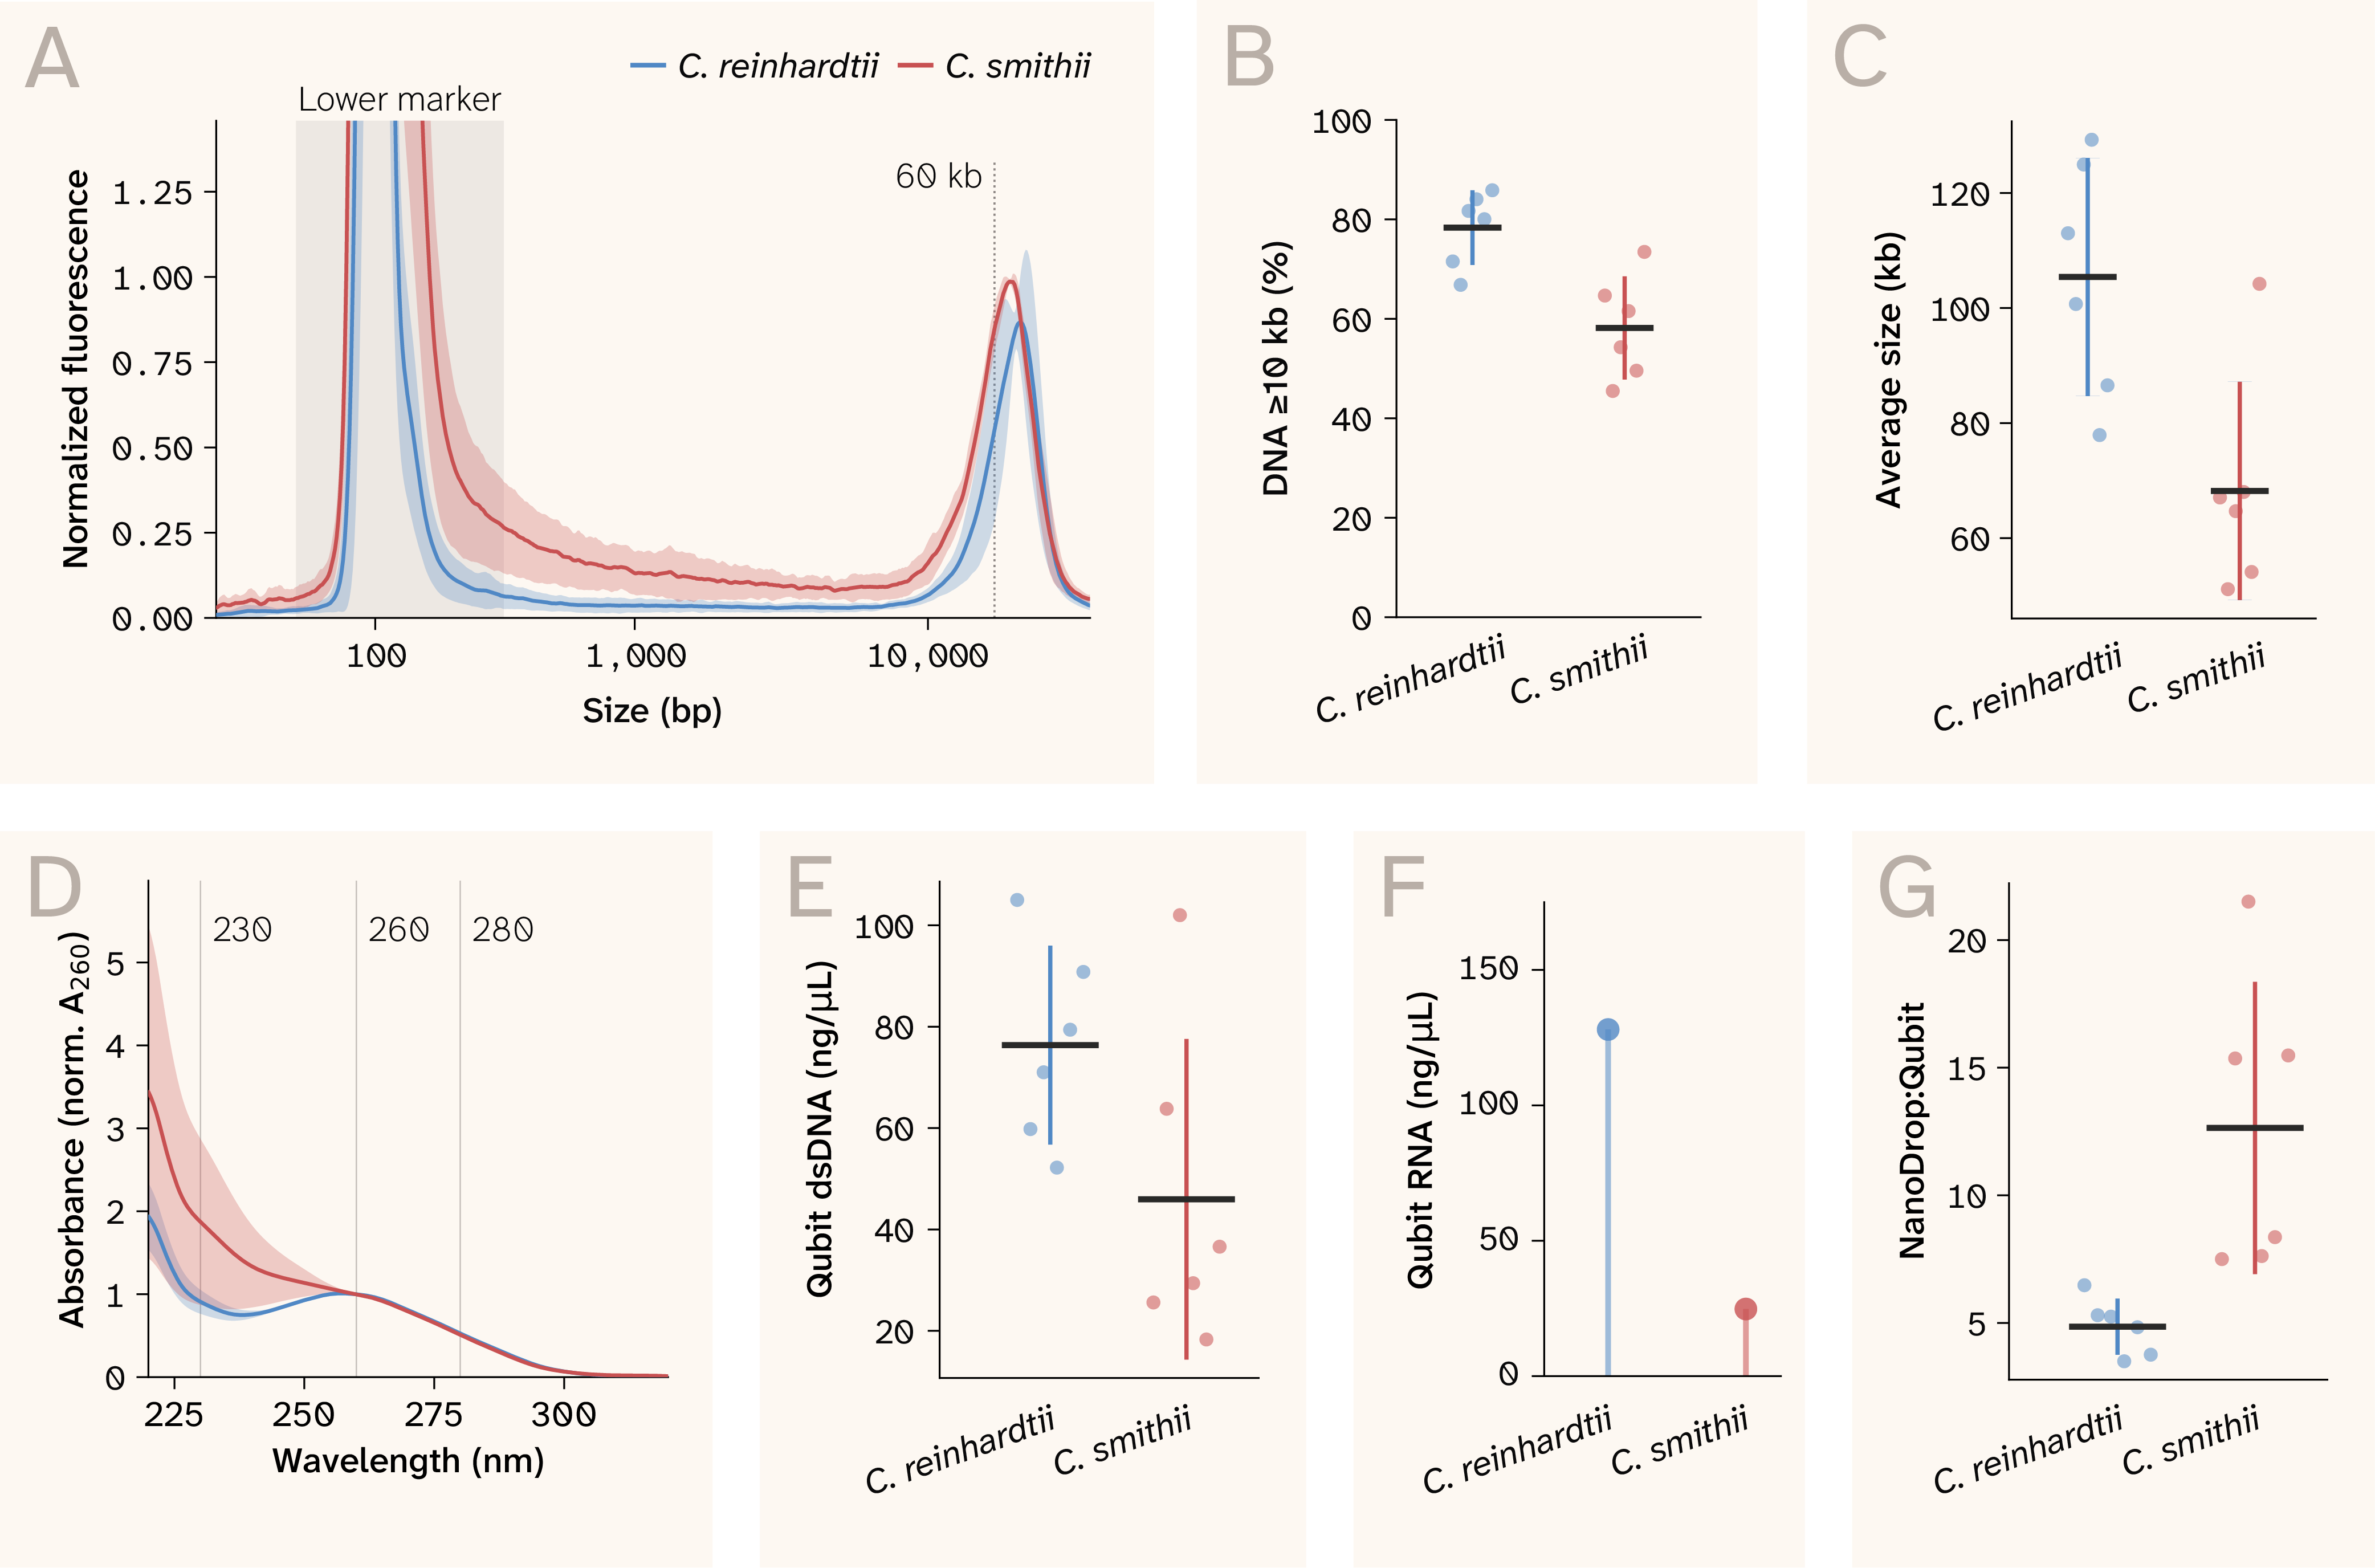
Figure 2. Representative quality control data from the high-fidelity (ethanol precipitation) track.
n = 6 for each species (C. reinhardtii and C. smithii) in each panel.
(A) TapeStation electropherogram traces (Genomic DNA [gDNA] ScreenTape), normalized to each lane's highest point above 400 bp; line and shaded band show the mean ± standard deviation (SD) per species. The lower marker region (~35–400 bp, the assay's internal size standard) is shaded and labeled; the dotted line marks 60 kb.
(B) Percentage of DNA at or above 10 kb, the share of each lane's trace signal above 400 bp that falls at or above 10 kb.
(C) Average DNA fragment size, the fluorescence-weighted mean size (>400 bp) of each lane's trace.
(D) NanoDrop (ND) absorbance spectra normalized to each sample's own A260; mean ± SD per species, with reference lines at 230, 260, and 280 nm. Shaded bands and error bars throughout represent sample standard deviation.
(E) Qubit double-stranded DNA (dsDNA) concentration.
(F) Qubit RNA concentration, a direct measure of RNA carryover. We measured RNA on one of six primary preparation samples per species. The corresponding Qubit dsDNA concentrations for these samples were 105 ng/µL (C. reinhardtii) and 36.6 ng/µL (C. smithii).
(G) NanoDrop:Qubit ratio, NanoDrop concentration divided by Qubit dsDNA concentration.
In (B, C, E, G), the black horizontal bar marks the mean, the colored whisker marks ± SD, and points show individual samples (n = 6 per species).
A second operator independently repeated the protocol with two fractions per species (Table 2). DNA yield fell within the primary range for both species, and absorbance ratios were similar, although CC-124 had a higher NanoDrop:Qubit ratio in the replication (8.8–10.5 vs. 3.5–6.5).
Expand to compare results from the same high-fidelity protocol run independently by a second operator.
| Strain | Experiment | Samples (n) | DNA yield (Qubit, µg) | NanoDrop:Qubit | A260/A280 | A260/A230 | Residual RNA (Qubit, µg) |
|---|---|---|---|---|---|---|---|
| CC-124 | Primary | 6 | 1.30–2.62 | 3.5–6.5 | 1.84–1.94 | 0.87–1.31 | 3.20 (n = 1) |
| CC-124 | Replication | 2 | 2.40–2.50 | 8.8–10.5 | 1.90–1.97 | 1.10–1.25 | 2.08–2.20 |
| CC-1373 | Primary | 6 | 0.46–2.55 | 7.5–21.5 | 1.89–2.07 | 0.32–1.53 | 0.62 (n = 1) |
| CC-1373 | Replication | 2 | 0.93–0.98 | 8.4–10.6 | 1.91–1.92 | 0.62–0.68 | 1.28–1.40 |
Table 2. DNA yield, purity, and residual RNA of gDNA extracted using the high-fidelity method.
Values are ranges across individual preps from the primary experiment (n = 6 per species) and the replication experiment (n = 2 per species). We measured DNA yield and residual RNA by Qubit. NanoDrop:Qubit is the unitless ratio of NanoDrop to Qubit DNA concentration. A260/A280 and A260/A230 are NanoDrop absorbance ratios, used as indicators of protein and organic contaminant carryover. We measured residual RNA on only one of the six primary preps per species, so those values are single measurements (n = 1).
To ask whether our preparations recover genomic DNA from all three genetic compartments (nucleus, chloroplast, and mitochondrion) and to confirm strain identity, we designed a PCR marker for each: a chromosome 9 deletion that distinguishes the two species, chloroplast rbcL, and mitochondrial cox1. We validated the three markers by PCR and amplicon sequencing on DNA from a separate, earlier high-fidelity preparation of the same CRC stocks. Sequencing confirmed each product's identity: C. reinhardtii reads covered the full chromosome 9 amplicon, while C. smithii reads matched the ~150 bp deletion allele predicted from public CC-1373 resequencing reads, with no coverage of the deletion interior. 99.7–100% of mapped rbcL and cox1 reads were on target in both strains, showing that the extraction recovers chloroplast and mitochondrial DNA alongside nuclear DNA, and the two cox1 SNPs independently assigned each strain correctly. Our working assumption is that, given the sizes of these genomes (megabase-scale nuclear chromosomes 33, a ~205 kb chloroplast genome, and a ~15.8 kb linear mitochondrial genome in C. reinhardtii 34) and TapeStation traces without prominent bands below 10 kb, the preparations carry largely intact DNA from all three compartments. We then confirmed species identity for the 12 fractions by running the chromosome 9 PCR on each: The marker amplified from all 12 fractions, showing that DNA from every fraction was PCR-amplifiable, and each fraction gave the product size expected for its species (the ~1.9 kb full-length band for C. reinhardtii, the ~150 bp deletion band for C. smithii), with blank no-template controls.
Together, these results show that the chromosome 9, rbcL, and cox1 assays reliably distinguish and confirm both species and detect DNA from all three compartments. Each of the 12 extracted fractions was correctly identified, confirming that the high-fidelity xanthate protocol reproducibly yields high-molecular-weight genomic DNA, including chloroplast and mitochondrial DNA, from two divergent Chlamydomonas species.
High-throughput track
For the high-throughput track, we compared the "single-SPRI" and the optional "RNA-free" protocols using haploid progeny from the C. reinhardtii × C. smithii cross. For each condition, we prepared 48 wells (half of the plate) and performed full QC on 12 representative strains per condition (different strains in each group). DNA at or above 10 kb made up 66.0 ± 9.0% of the signal for "RNA-free" versus 24.3 ± 6.1% for "single-SPRI" (Figure 3, B), and average DNA size was 99 ± 17 kb versus 25 ± 7 kb (Figure 3, C). High Sensitivity D5000 traces showed no band hidden under the lower marker: 70–150 bp held 0.2 ± 0.2% of lane signal for "RNA-free" and 0.9 ± 0.5% for "single-SPRI," and 60–400 bp held 3.4 ± 3.2% and 5.8 ± 2.3%, the low end of a continuous smear, so the 400 bp cutoff excludes little sample signal. The low-molecular-weight signal specific to "single-SPRI" (Figure 3, A) tracked with residual RNA rather than degraded genomic DNA: The "single-SPRI" samples carried 141 ± 26 ng/µL of RNA by Qubit, while "RNA-free" samples were at or below the assay's detection limit in 11 of 12 samples (the twelfth read 9.0 ng/µL; Figure 3, F). The NanoDrop:Qubit ratio, which rises when A260 comes from something other than dsDNA, was 9.2 ± 2.2 for "single-SPRI" versus 1.8 ± 0.8 for "RNA-free" (Figure 3, G). Qubit's dsDNA and RNA HS dyes are selective for their target nucleic acid but may still register signal from the other when it's present at more than roughly 1:1 excess (Qubit RNA HS Assay Kit User Guide); since "single-SPRI" samples carry about sixfold more RNA than dsDNA by Qubit, the reported dsDNA concentration for "single-SPRI" may include some RNA-driven signal. Qubit dsDNA concentration was 1.9 ± 0.8 ng/µL for "RNA-free" versus 25 ± 9 ng/µL for "single-SPRI" (Figure 3, E). Although the lower apparent dsDNA yield may partly reflect the removal of RNA signal, DNA loss during the second SPRI cleanup likely also contributed. A second operator repeated the single-SPRI protocol on a plate of CC-124 cells rather than haploid progeny (Table 3). DNA yield, purity ratios, and residual RNA were comparable to the primary plate. Because "single-SPRI" is faster to implement, it's the version we're carrying forward to genotype the collection.
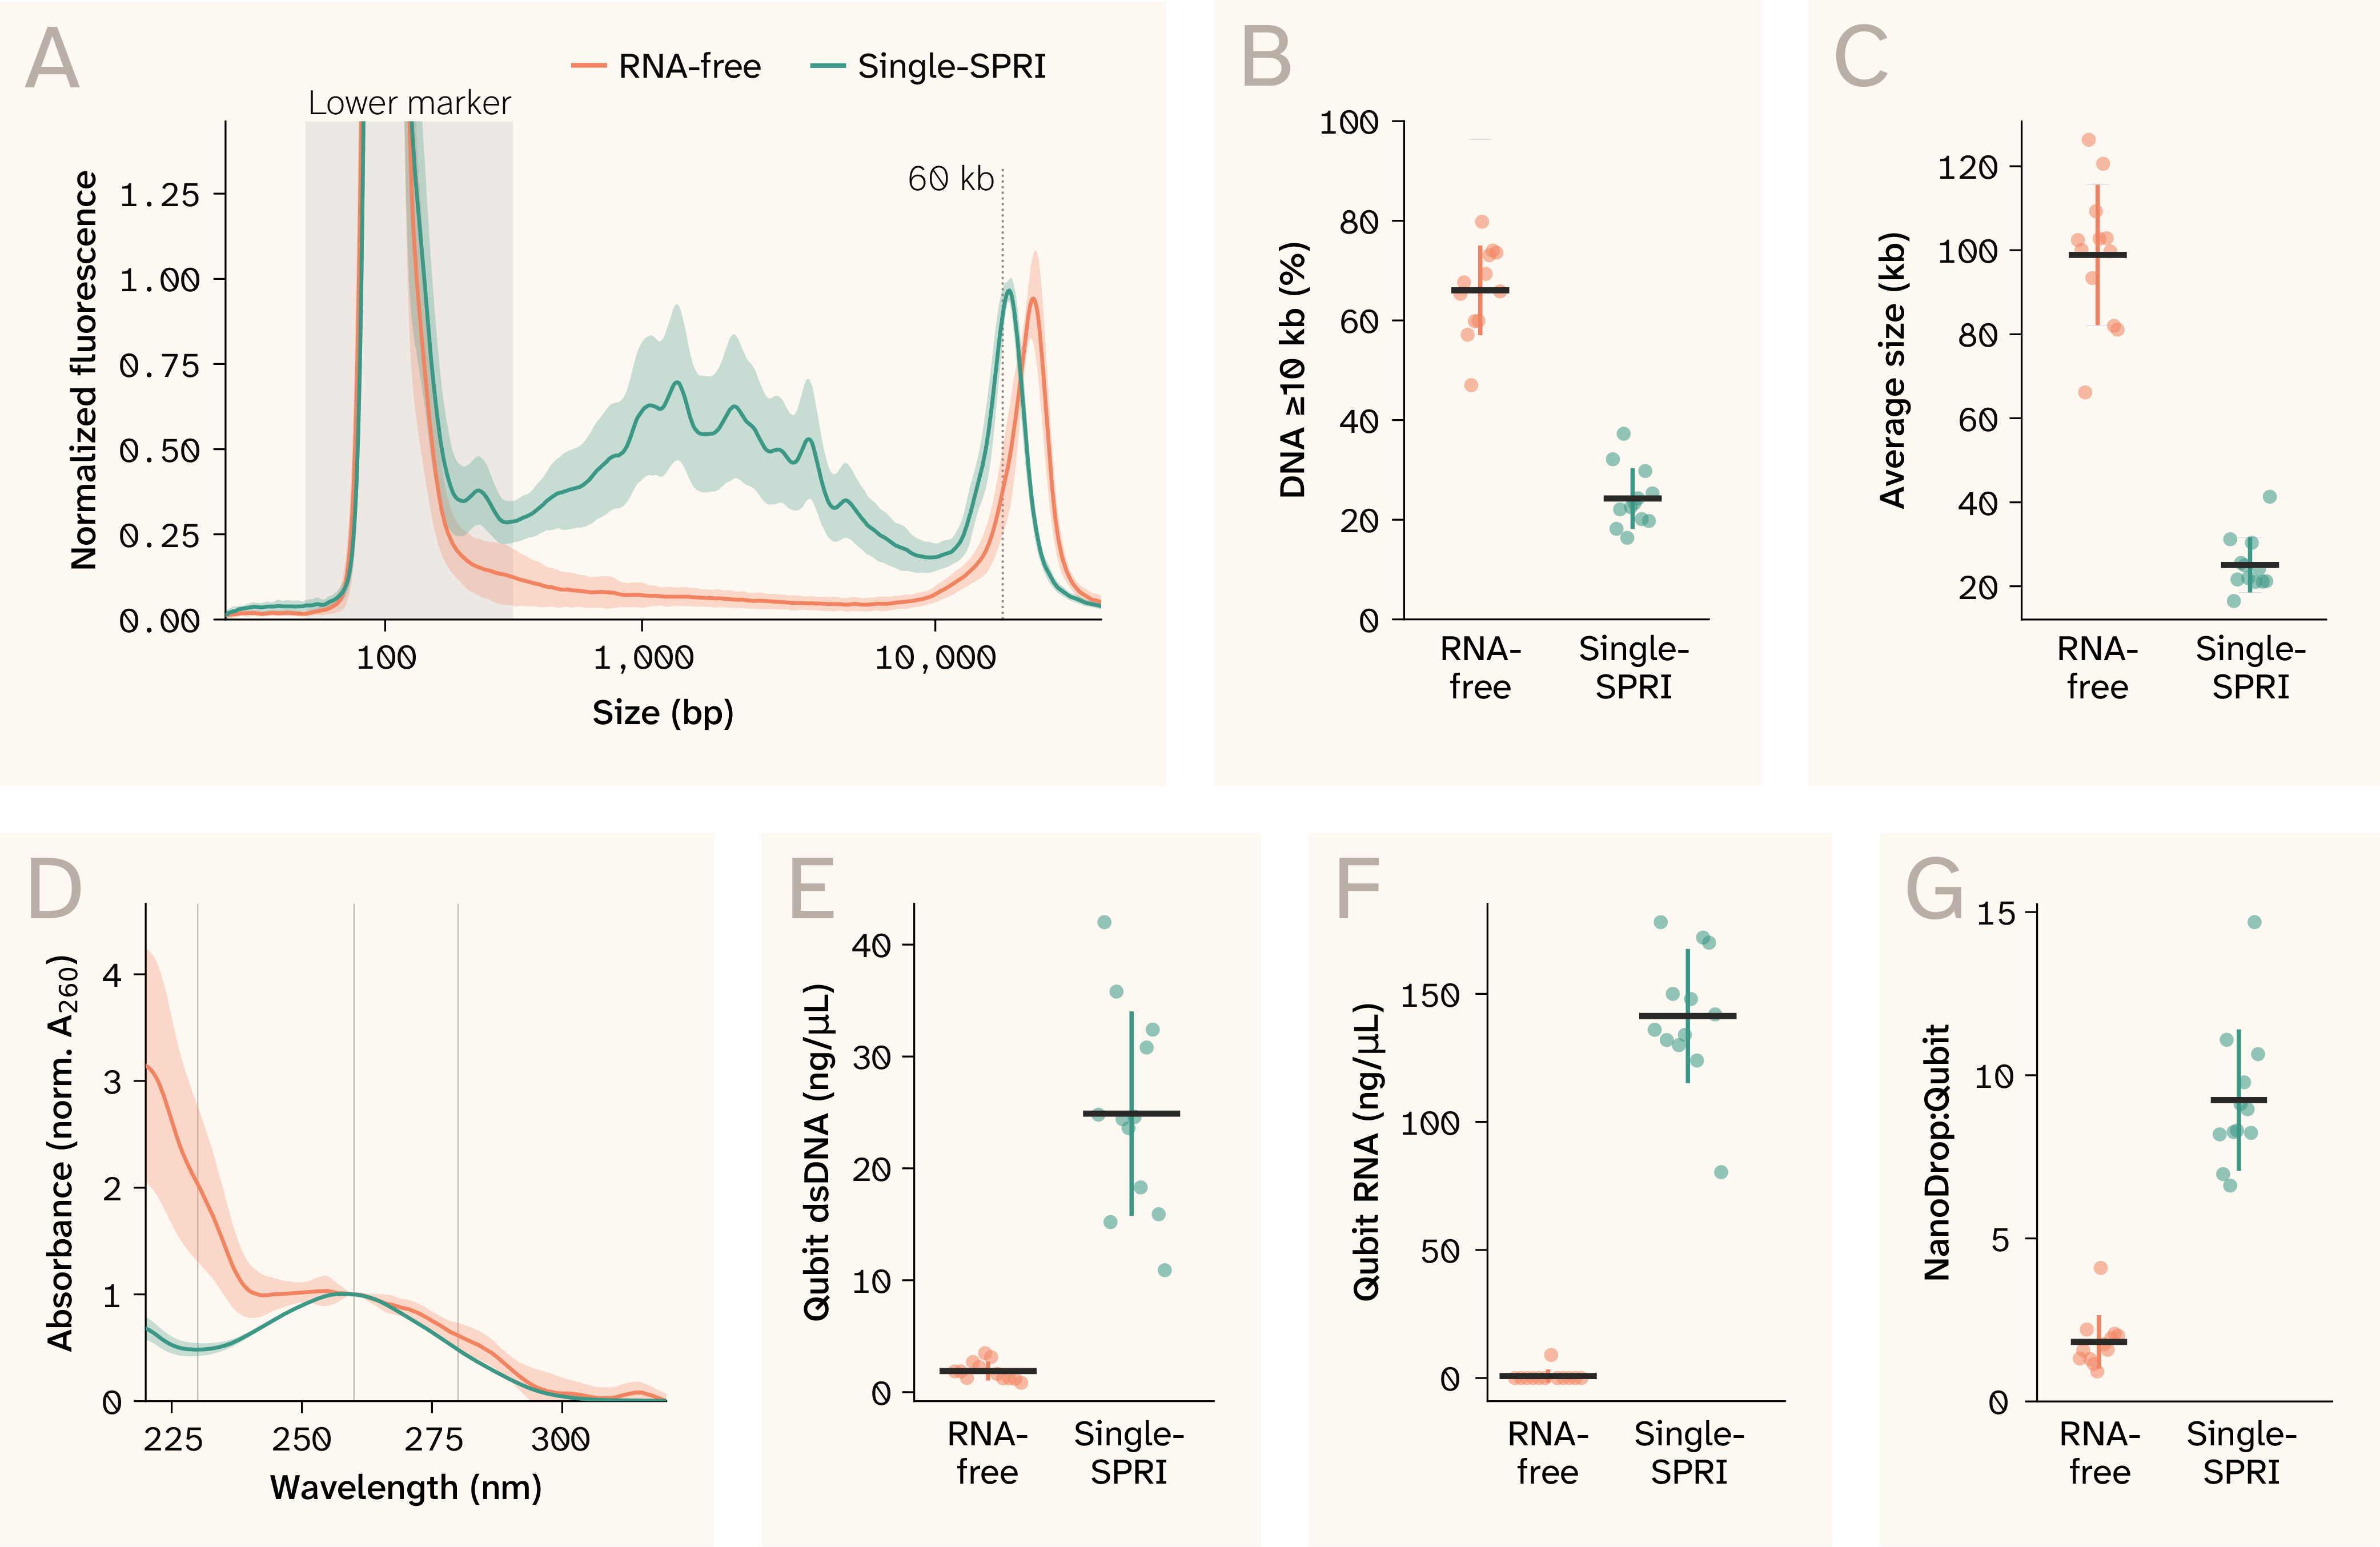
Figure 3. Representative quality control data from the high-throughput (SPRI) track on C. reinhardtii × C. smithii haploids.
"RNA-free" (RNase and proteinase K digestion plus a second SPRI cleanup) versus "single-SPRI," n = 12 different strains per condition (not matched replicates).
(A) TapeStation genomic DNA (gDNA) ScreenTape electropherograms (mean ± SD envelope across replicates), sized against ladder-calibrated migration position; 60 kb marked for reference. The "single-SPRI" traces carry a broad low-to-mid-molecular-weight hump between roughly 200 bp and 10 kb that is absent from "RNA-free."
(B) Percentage of DNA at or above 10 kb, the share of each lane's trace signal above 400 bp that falls at or above 10 kb.
(C) Average DNA size, the fluorescence-weighted mean size above 400 bp.
(D) NanoDrop (ND) ultraviolet–visible (UV–Vis) spectra normalized to A260 (mean ± SD).
(E) Qubit double-stranded DNA (dsDNA) concentration.
(F) Qubit RNA concentration, a direct measure of RNA carryover. Readings below the detection limit are plotted at 0.
(G) NanoDrop:Qubit ratio, NanoDrop concentration divided by Qubit dsDNA concentration.
Points show individual strains; black bars and colored whiskers show the mean ± SD.
Expand to compare results from the same high-throughput protocol run independently by a second operator.
| Strain | Experiment (single-SPRI) | Samples (n) | DNA yield (Qubit, µg) | NanoDrop:Qubit | A260/A280 | A260/A230 | Residual RNA (Qubit, µg) |
|---|---|---|---|---|---|---|---|
| Haploid progeny | Primary | 12 | 0.44–1.68 | 6.6–14.7 | 1.98–2.13 | 1.54–2.27 | 3.2–7.1 |
| CC-124 | Replication | 12 | 1.18–2.19 | 6.4–9.1 | 2.10–2.18 | 2.05–2.34 | 6.3–7.8 (n = 3) |
Table 3. DNA yield, purity, and residual RNA of gDNA extracted using the high-throughput single-SPRI method.
Values are ranges across individual preps from the primary experiment (n = 12) and the replication experiment (n = 12). We measured DNA yield and residual RNA by Qubit. NanoDrop:Qubit is the unitless ratio of NanoDrop to Qubit DNA concentration. A260/A280 and A260/A230 are NanoDrop absorbance ratios, used as indicators of protein and organic contaminant carryover. We measured residual RNA on all 12 primary preps but only three of the 12 replication preps, so the replication range reflects those three.
Optimization notes
A note on the data in this section
We collected the data in Figure 4 as we developed our methodology, so each panel comes from a slightly different version of our protocols. We only ran each comparison once (except that the high-throughput cold-thaw data combine two preparations). These aren't rigorously replicable data. We're simply sharing them to explain how we made the methodological choices reflected in our final protocols and to inform future optimization efforts.
You can find the data from all preparations on Zenodo, along with a README that maps each preparation to its figure panels and protocol version.
We developed our method and the two parallel tracks with cultures of C. reinhardtii, C. smithii, and haploid progeny from a cross between the two. Two problems dominated development: DNA fragmentation and a persistent A260/A230 depression.
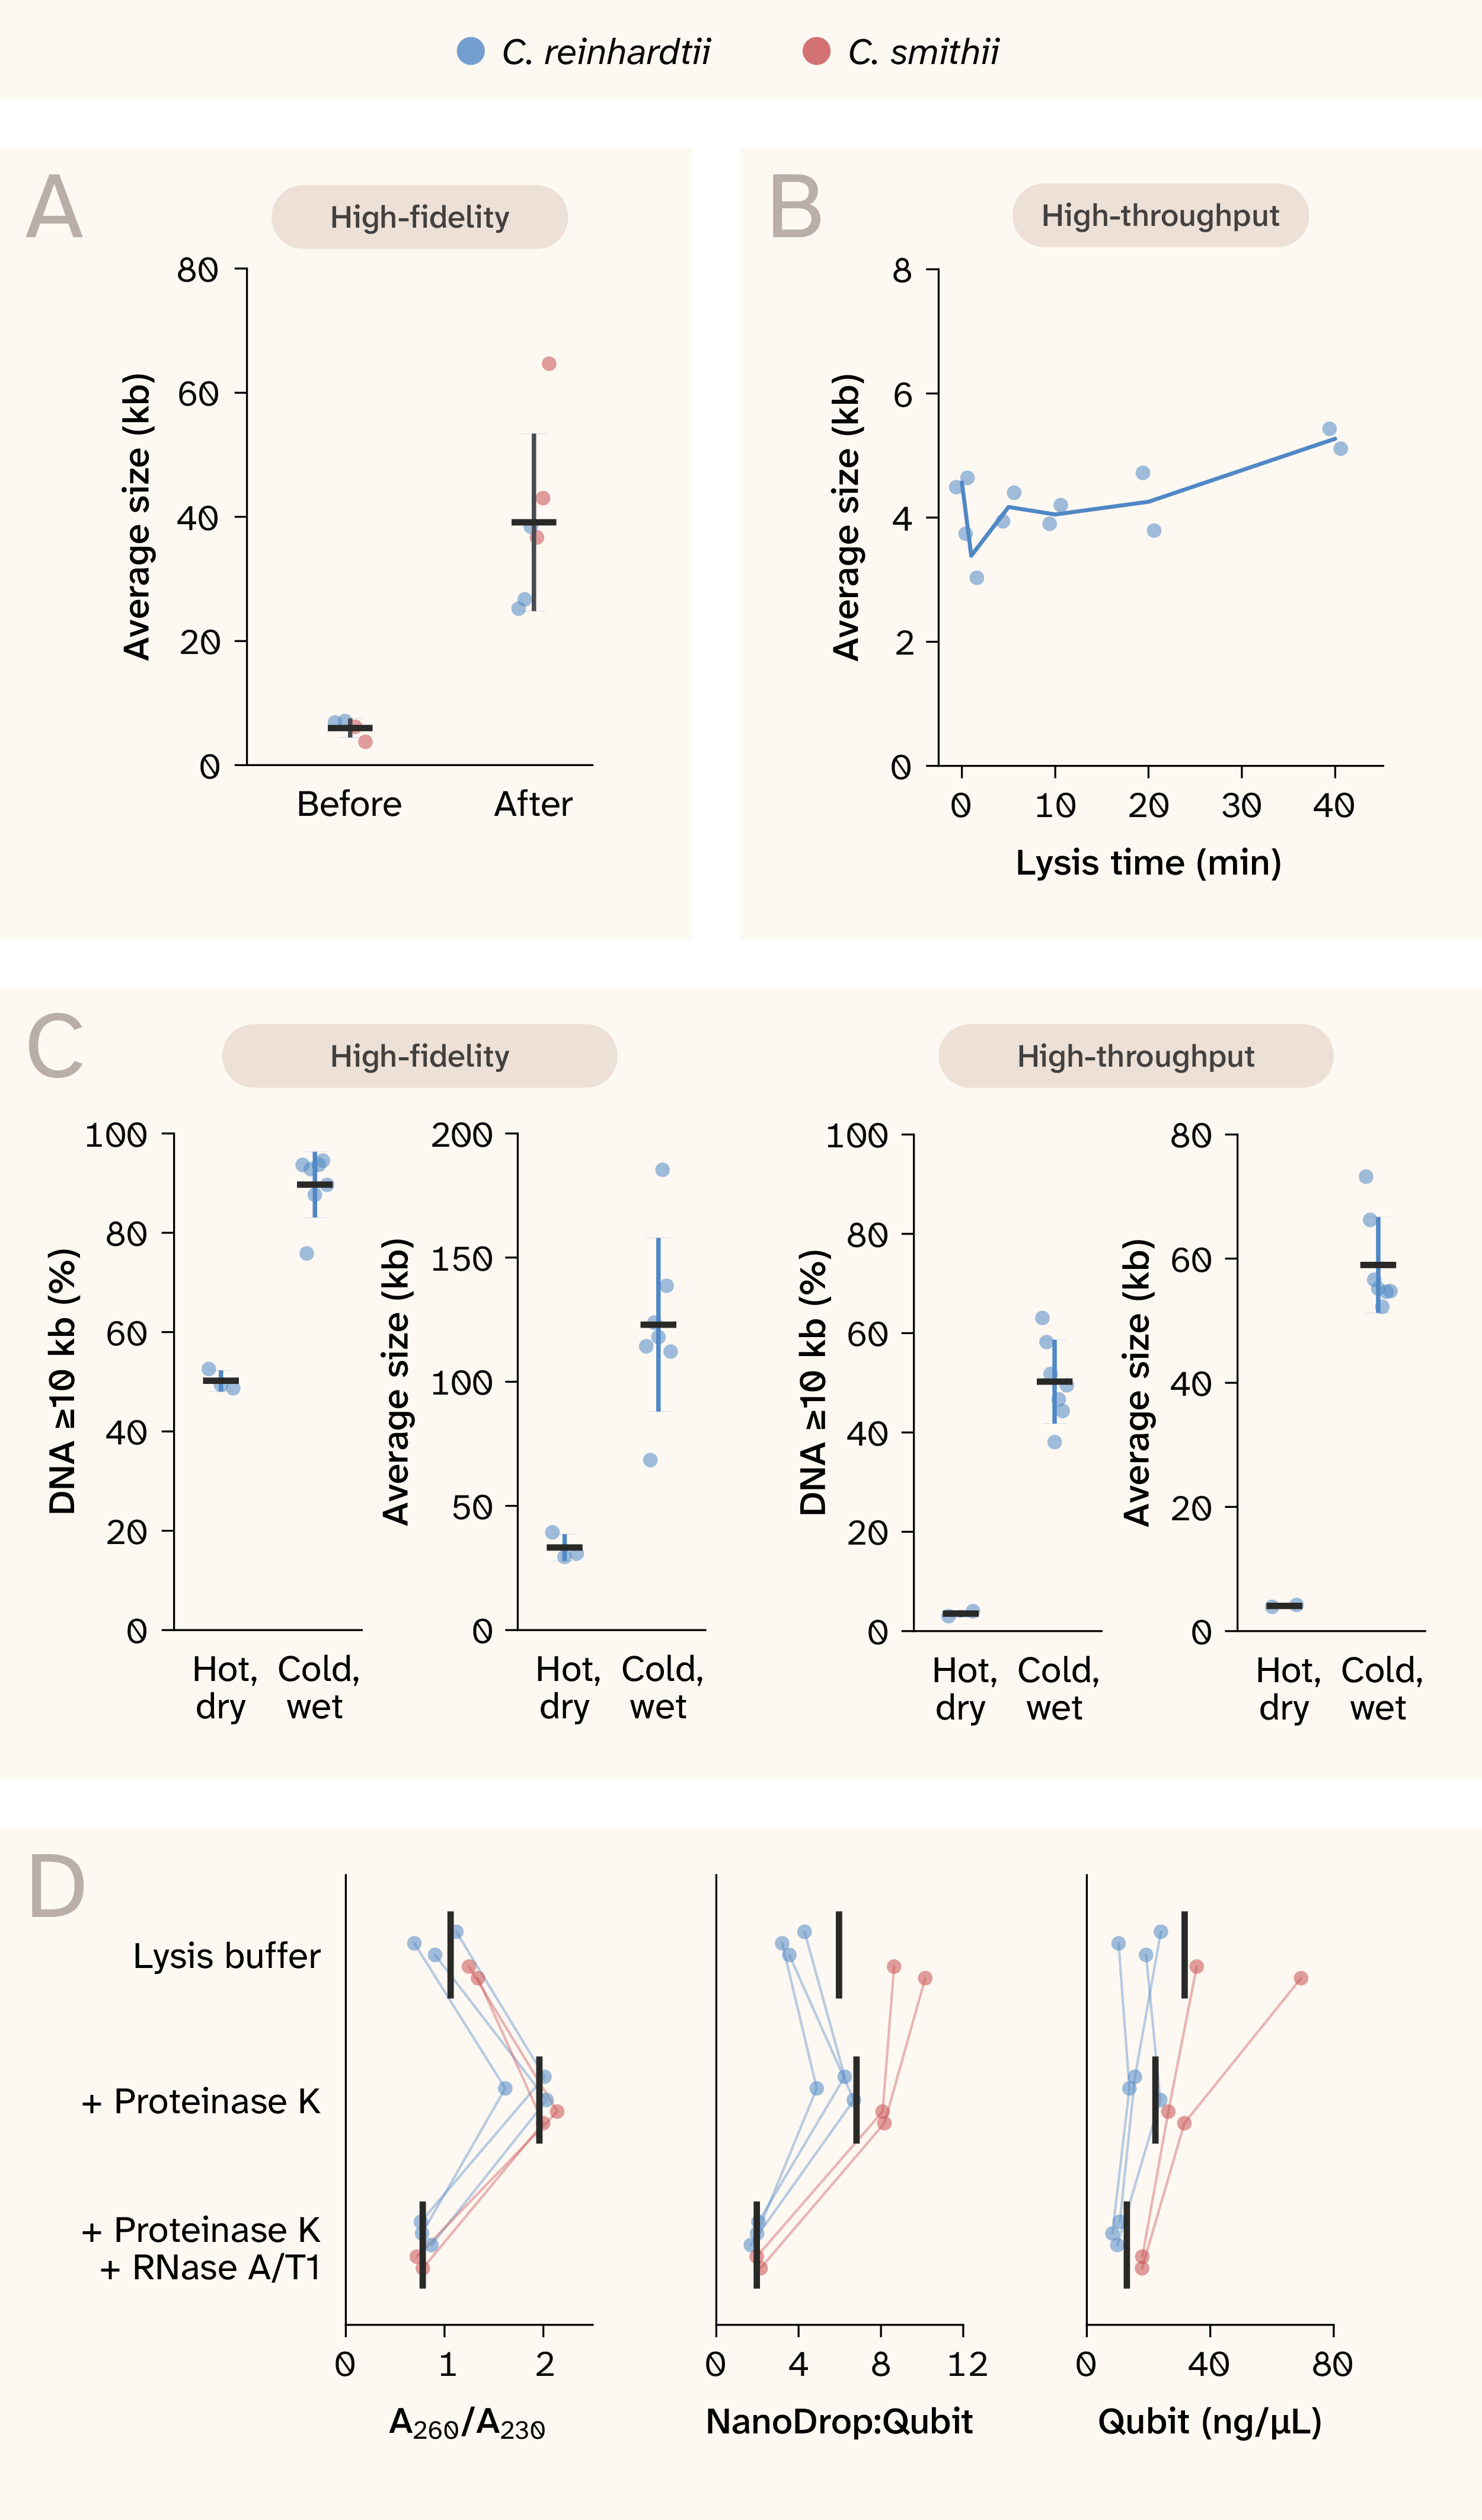
Figure 4. Handling, thaw, and lysis-additive changes that affected genomic DNA fragmentation and A260/A230.
(A) High-fidelity average DNA size of C. reinhardtii and C. smithii before and after switching to wide-bore tips, 10,000 × g precipitation spins, and unassisted pellet resuspension.
(B) High-throughput average DNA size of C. reinhardtii CC-124 (n = 2 per time point) across a lysis time course after a 3 min, 65 °C dry thaw; the line connects the means at each time point.
(C) Hot dry thaw versus cold wet thaw with 50 mM ethylenediaminetetraacetic acid (EDTA) and 10 mM dithiothreitol (DTT) in C. reinhardtii CC-124: percentage of DNA at or above 10 kb and average DNA size for the high-fidelity track and for the high-throughput track at a matched 10-minute lysis.
(D) A260/A230, NanoDrop:Qubit, and Qubit concentration for matched lysates in lysis buffer alone, with proteinase K, and with proteinase K and RNase A/T1; lines connect each culture (n = 5: three C. reinhardtii and two C. smithii).
In (A–D), points are individual samples. In (A), (C), and (D), black bars are means; in (A) and (C), whiskers represent ± SD.
Fragmentation had two sources. First, we suspected that mechanical force might be a contributor, so we tried gentler handling. For the high-fidelity track, after we switched to wide-bore tips, 10,000 × g precipitation spins (down from 21,000 × g), and unassisted pellet resuspension, high-fidelity average DNA size rose from 3.8–7.1 kb (n = 4) to 25–65 kb (n = 6; Figure 4, A). This indicated that mechanical handling was likely a major source of fragmentation.
The second cause of fragmentation was the pre-lysis thaw. In earlier protocols for both tracks, we thawed frozen cell pellets with a 3 min dry thaw at 65 °C prior to lysis. In a high-throughput lysis time course, samples were already fragmented (average DNA size 4.5–4.6 kb) at our zero-minute time point and didn't worsen through 40 min (Figure 4, B), so we suspected the 3 min dry thaw at 65 °C that came before lysis was degrading the DNA. We first addressed this with several changes at once to determine whether it was surmountable: We added cold lysis buffer directly to frozen pellets and held them on ice before ramping to 65 °C, and we raised the EDTA concentration from 10 to 50 mM and added 10 mM DTT. At a matched 10-minute lysis in the same base buffer, the high-throughput share of DNA at or above 10 kb rose from 3.0–4.0% (n = 2) to 38–63% (n = 7), and average DNA size rose from 3.9–4.2 kb to 52–73 kb (Figure 4, C). After the same change, high-fidelity average DNA size rose from 29–39 kb (n = 3) to 68–185 kb (n = 7), and the share of DNA at or above 10 kb rose from 49–53% to 76–95% (Figure 4, C). On the high-throughput track, we then dropped the added EDTA and DTT but kept the cold wet thaw. In haploid progeny from the cross (12 strains per condition), the molecular weight of genomic DNA remained high. In "RNA-free" preparations, average DNA size was 66–126 kb and 47–80% of DNA was at or above 10 kb (n = 12; Figure 3, B–C). We kept these components, together with proteinase K and PVP-40, in the buffer for the high-fidelity track, which produced an average DNA size of 68–185 kb with them in place. We haven't tested removing any of these components from the current version of the high-fidelity track. Adding buffer to frozen pellets means any residual medium dilutes it, so when pellets retain medium we prepare the xanthate buffer, proteinase K, and DTT at a higher concentration to keep final lysis concentrations unchanged (1.35× for the 160–180 µL of residual TAP per pellet in our PacBio HiFi preparations).
On matched lysates, adding proteinase K to the lysis buffer raised the mean A260/A230 from 1.06 to 1.96 (n = 5; Figure 4, D). Adding RNase A/T1 to the same lysis removed RNA (NanoDrop:Qubit fell from 6.81 to 1.96) but dropped A260/A230 to 0.78 and cut Qubit yield by 42% (Figure 4, D). We moved RNase digestion out of lysis and instead included it after the debris-clearing spin on the high-fidelity track, and after the first SPRI cleanup in the "RNA-free" protocol.
The low A260/A230 persisted across development and remains unresolved. It didn't prevent downstream amplification on either track, but we can't yet say whether it affects long-read sequencing of DNA from the high-fidelity track, since we haven't run whole-genome sequencing.
Code and figure scripts are available in our GitHub repository (DOI: 10.5281/zenodo.23962399).
Raw QC data (NanoDrop, Qubit, and TapeStation) and strain- and organelle-typing primers, gels, and amplicon sequencing are available on Zenodo, organized by prep ID, with a README that maps each prep to its figure panels and protocol version.
Next steps
We're using the high-throughput track to genotype a collection of C. reinhardtii × C. smithii haploids using reduced-representation sequencing, with the entire workflow automated on an Opentrons Flex. In parallel, we plan to use the high-fidelity track to sequence the genomes of the two parental strains used in this cross. The current high-fidelity protocol meets our needs for genotyping, but further optimization is needed before it'll be suitable for PacBio whole-genome sequencing, particularly to reduce residual RNA contamination. We’ll share updates as this work progresses.
We expect the same high-throughput approach to be broadly applicable to other diversity panels, including mutagenesis libraries and other interspecific crosses. Longer-term, we aim to adapt both protocols to additional organisms and demonstrate that the high-fidelity track can be adapted to generate the high-molecular-weight DNA needed to build reference genomes for organisms that lack them.
If you try these protocols on your own organisms, we'd like to hear how well they transfer and which adjustments improve performance for different species.
Be the first to comment on this publication.